")
Back to Journals » International Journal of Chronic Obstructive Pulmonary Disease » Volume 15
Do We Need to Assess Quality-of-Life with Both the St George’s Respiratory Questionnaire and the EuroQol 5-Dimension Questionnaire in a Clinical Study with an Economic Component: Insights from the REVOLENS Study in Severe Emphysema
Authors Bulsei J, Pfister J, Leroy S, Perotin JM , Barbe C , Marquette CH , Deslee G, Durand-Zaleski I
Received 22 July 2019
Accepted for publication 31 October 2019
Published 14 January 2020 Volume 2020:15 Pages 135—142
DOI https://doi.org/10.2147/COPD.S223632
Checked for plagiarism Yes
Review by Single anonymous peer review
Peer reviewer comments 2
Editor who approved publication: Dr Richard Russell
Julie Bulsei, 1 Jeanne Pfister, 1 Sylvie Leroy, 2 Jeanne Marie Perotin, 3 Coralie Barbe, 4 Charles-Hugo Marquette, 2 Gaëtan Deslee, 3 Isabelle Durand-Zaleski 1
On behalf of the REVOLENS study group
1AP-HP URC Eco IdF, Unité de recherche clinique en économie de la santé d’Ile de France, Paris, France; 2Service de Pneumologie, CHU de Nice, FHU OncoAge, Université Côte d’Azur, Nice, France; 3Service de Pneumologie, INSERM U1250, Hôpital Universitaire, Reims, France; 4Unité d’Aide Méthodologique, Pôle Recherche et Santé Publique, Hôpital Universitaire de Reims, Reims, France
Correspondence: Julie Bulsei
Urc Eco Ile-de-France (AP-HP), Hôtel Dieu, 1, place du Parvis Notre-Dame, Paris 75004, France
Tel +33 1 40 27 57 52
Email [email protected]
Introduction: The use of two quality-of-life questionnaires in a single clinical trial with an economic component can be challenging due to the associated workload in terms of data collection and an increased risk of missing data. The aim of our study was to determine whether the questionnaire chosen to measure health status, the St. George’s Respiratory Questionnaire (SGRQ), could be administered on its own without adding the EuroQol five dimensions questionnaire (EQ-5D) for economic evaluation in emphysema studies.
Materials and Methods: Data were prospectively collected during the REVOLENS trial assessing endobronchial coil treatment in severe emphysema. To quantify the association between the two questionnaires, correlations between the EQ-5D and the SGRQ were first tested and the concordance was then studied in order to know whether the two questionnaires were interchangeable. Finally, the Starkie et al algorithm predicting EQ-5D utility values from the SGRQ was used on REVOLENS’s individual patient data. The Student’s t-test, correlation and concordance between EQ-5D individual value (from the REVOLENS study) and predicted value (from the Starkie et al algorithm) were studied to test this algorithm.
Results: Results showed a strong correlation but no concordance between the EQ-5D and the SGRQ, demonstrating that the two questionnaires are not interchangeable. Moreover, the algorithm predicting EQ-5D utilities from the SGRQ did not provide utility values comparable to those observed in the REVOLENS study. Indeed, our study demonstrated a strong correlation between predicted and individual EQ-5D values but no concordance.
Conclusion: The use of both the EQ-5D and the SGRQ in a clinical study with an economic component is justified. Based on our results, the SGRQ should not be used to obtain a utility score to calculate the incremental cost-effectiveness ratio and conclude on the efficiency of an intervention in emphysema patients.
Keywords: quality-of-life, St. George’s Respiratory Questionnaire, EuroQol five dimensions questionnaire, correlation, concordance
Introduction
The EuroQol five dimensions questionnaire (EQ-5D) is a standardized instrument used to measure health-related quality of life (HRQoL). The 5-level EQ-5D version (EQ-5D-5L) was introduced by the EuroQol group in 2009 to improve the instrument’s sensitivity and to reduce ceiling effects, as compared to the previous version, the EQ-5D-3L.1,2 The EQ-5D is used in economic evaluation, and many countries generated a population-specific utilities value set. This utility value is a component of the quality-adjusted life-year (QALY) which has a number of useful properties and is the current standard for conducting cost-effectiveness analyses.3
The validity of the EQ-5D compared to disease-specific HRQoL questionnaires including the St. George’s Respiratory Questionnaire (SGRQ) has been demonstrated in outpatients with chronic obstructive pulmonary disease (COPD).4 The use of two quality-of-life questionnaires in a clinical trial can be challenged due to the overload of work and the risk of increasing the number of missing data related to the multiplication of data to be collected from patients. Starkie et al had developed an algorithm predicting EQ-5D utility from the SGRQ in subjects with COPD, with the following resulting model: EQ-5D = 0.9617–0.0013*SGRQ total - 0.0001*SGRQ total2 + 0.0231*male.5
The aim of our study was to determine whether the questionnaire chosen to measure health status, the SGRQ, could be administered on its own without adding the EQ-5D for economic evaluation in emphysema studies.
Materials and Methods
The REVOLENS Study
The design and results of the REVOLENS study (NCT01822795) had previously been published.6,7 This study was a prospective randomized open-blinded end-point (PROBE) trial conducted in ten French sites throughout France. Patients with severe emphysema were randomly assigned in a 1:1 ratio to lung volume reduction coil treatment or usual care and were followed during 5 years. This study was approved by the Ethics Committee of Dijon Est I (N°2012-A01477-36), and by the French Agency for Medicines and Health Products (ANSM). All participants provided written informed consent to participate in the study. The primary endpoint of the REVOLENS study was the improvement of at least 54 meters in the 6 mins walk test at 6 months. The aim of the economic evaluation was to estimate the 1-year cost-effectiveness of lung volume reduction coil treatment compared to usual care in patients with severe emphysema included in the REVOLENS trial.6,8
Quality-of-Life Questionnaires Used in the REVOLENS Study
Two quality-of-life questionnaires were used in the REVOLENS study, the generic EQ-5D and the disease-specific SGRQ.
The EQ-5D-5L comprises a descriptive system and a visual analogue scale (VAS). The descriptive system is composed of five health dimensions (mobility, self-care, usual activities, pain/discomfort and anxiety/depression) with 5 levels of health state (no problems, slight problems, moderate problems, severe problems and extreme problems). For each of the 5 dimensions, the participant’s answer is converted to a number between 1 and 5, expressing the health state reported. The responses are combined to produce a five-digit number describing the participant’s health status which is converted to a utility value from the country-specific value set. The French EQ-5D-5L value set has utility between −0.530 (health condition worse than death) and 1 (best possible health). The VAS records the respondent’s self-rated health status on a graduated scale from 0 to 100, with higher scores for higher HRQoL.1,4
The SGRQ is a 50-item questionnaire developed to measure health status in patients with chronic airflow limitation. The responses to these items can be aggregated into a total score and three sub-scores for symptoms, activity and impact domains. There may be between 2 and 5 response options for each question. The participant’s answers are weighted, and scores are calculated by dividing the summed weights by the maximum possible weight. The result is expressed as a percentage ranging from 0%, the best possible score, to 100%, the worst possible score.9,10
Statistical Analysis
Data were prospectively collected during the REVOLENS trial and statistical analyses were performed on the REVOLENS intention-to-treat population. The sample size has been previously calculated based upon the primary endpoint of the clinical study (improvement of at least 54 meters in the 6 mins walk test at 6 months) and 100 patients were included in the study accordingly.6 Questionnaires responses were analyzed at baseline for the 2 groups together due to randomization and at 1 year for the 2 separated groups (coil treatment group versus usual care group). The remaining statistical analyses were done at baseline and at 1 year for the 2 groups together in order to obtain more robust results. 1-year results for the 2 separated groups were presented in secondary analyses. Data were presented using means with 95% confidence interval (CI) as appropriate and missing data were imputed by the average in each group.
To quantify the association between the 2 questionnaires, correlations between the EQ-5D and the SGRQ and between the EQ-5D and each domain of the SGRQ were first tested at baseline and 1 year. The correlation coefficient on the study population was estimated using the Pearson correlation test if data follow a normal distribution and otherwise the Spearman correlation test. The sign of the correlation coefficient indicates the direction of the association and the magnitude of the correlation coefficient indicates the strength of the association. The correlation between the 2 questionnaires can be positive (higher scores of one questionnaire were associated with higher scores of the other) or negative (higher scores of one questionnaire are associated with lower scores of the other). Strength of correlation was classified as follows: absent (r < ±0.20), weak (r = ±0.20 to ±0.34), moderate (r = ±0.35 to ±0.50), and strong (r > ±0.50).11–13 Correlation diagrams were then plotted.
In order to know if the 2 questionnaires are interchangeable, the concordance between the EQ-5D and the SGRQ was studied at baseline and 1 year using the Lin’s concordance correlation coefficient (CCC)14 and the Bland-Altman diagram.15 Values for Lin’s coefficient were interpreted according to these levels of concordance: poor (CCC < 0.40), fair (CCC = 0.40 to 0.59), good (CCC = 0.60 to 0.74) and excellent (CCC > 0.75). The principle of the Bland-Altman diagram is to appreciate the difference between the 2 health utility scores obtained with each of the two questionnaires and to deduce, for the study population, the bias (which is the mean difference between the two questionnaires), the precision (which describes how close the values are) and the 95% agreement limits. It is expected that the 95% agreement limits include 95% of differences between the two questionnaires. In case of perfect match, the Lin’s coefficient will be 1, with a bias of zero and agreement limits close to the bias on the Bland Altman plot. In order to appreciate the interchangeability SGRQ data were adjusted to the same scale as the EQ-5D with the following equation: 1 – (SGRQ score/100).
Finally, the Starkie et al algorithm predicting EQ-5D utility value from the SGRQ utility value in subjects with COPD was used with the REVOLENS individual data.5 The Student’s t-test, correlation and concordance between EQ-5D individual value (from the REVOLENS study) and EQ-5D predicted value (from the Starkie et al algorithm) were studied to test this algorithm at baseline and 1 year.
A p-value less than 0.05 was considered significant. SAS (Version 9.4, SAS Institute, Cary, NC, USA) and R (Version 3.4, R Foundation for Statistical Computing, Vienna, Austria) were used for analysis.
Results
A hundred patients were included in the REVOLENS study. Baseline characteristics in each group were presented in Appendix 1.
Questionnaires Responses
Table 1 shows the distribution of patient answers to the EQ-5D descriptive system at baseline and 1 year. The mobility and usual activities dimensions were those where we found the greatest number of severe or extreme problems at baseline and 1 year with no significant difference between the 2 groups at 1 year (p= 0.16 and 0.55, respectively). Figure 1 showed SGRQ scores at baseline and 1 year for each domain. The activity domain was the one where the average score was the highest at baseline and 1 year with significant difference between the 2 groups at 1 year (p= 0.03). Total EQ-5D and SGRQ scores at baseline and 1 year are presented in Figure 2. There was no significant difference between the 2 groups at 1 year for the 2 scores (p= 0.06 and 0.10, respectively).
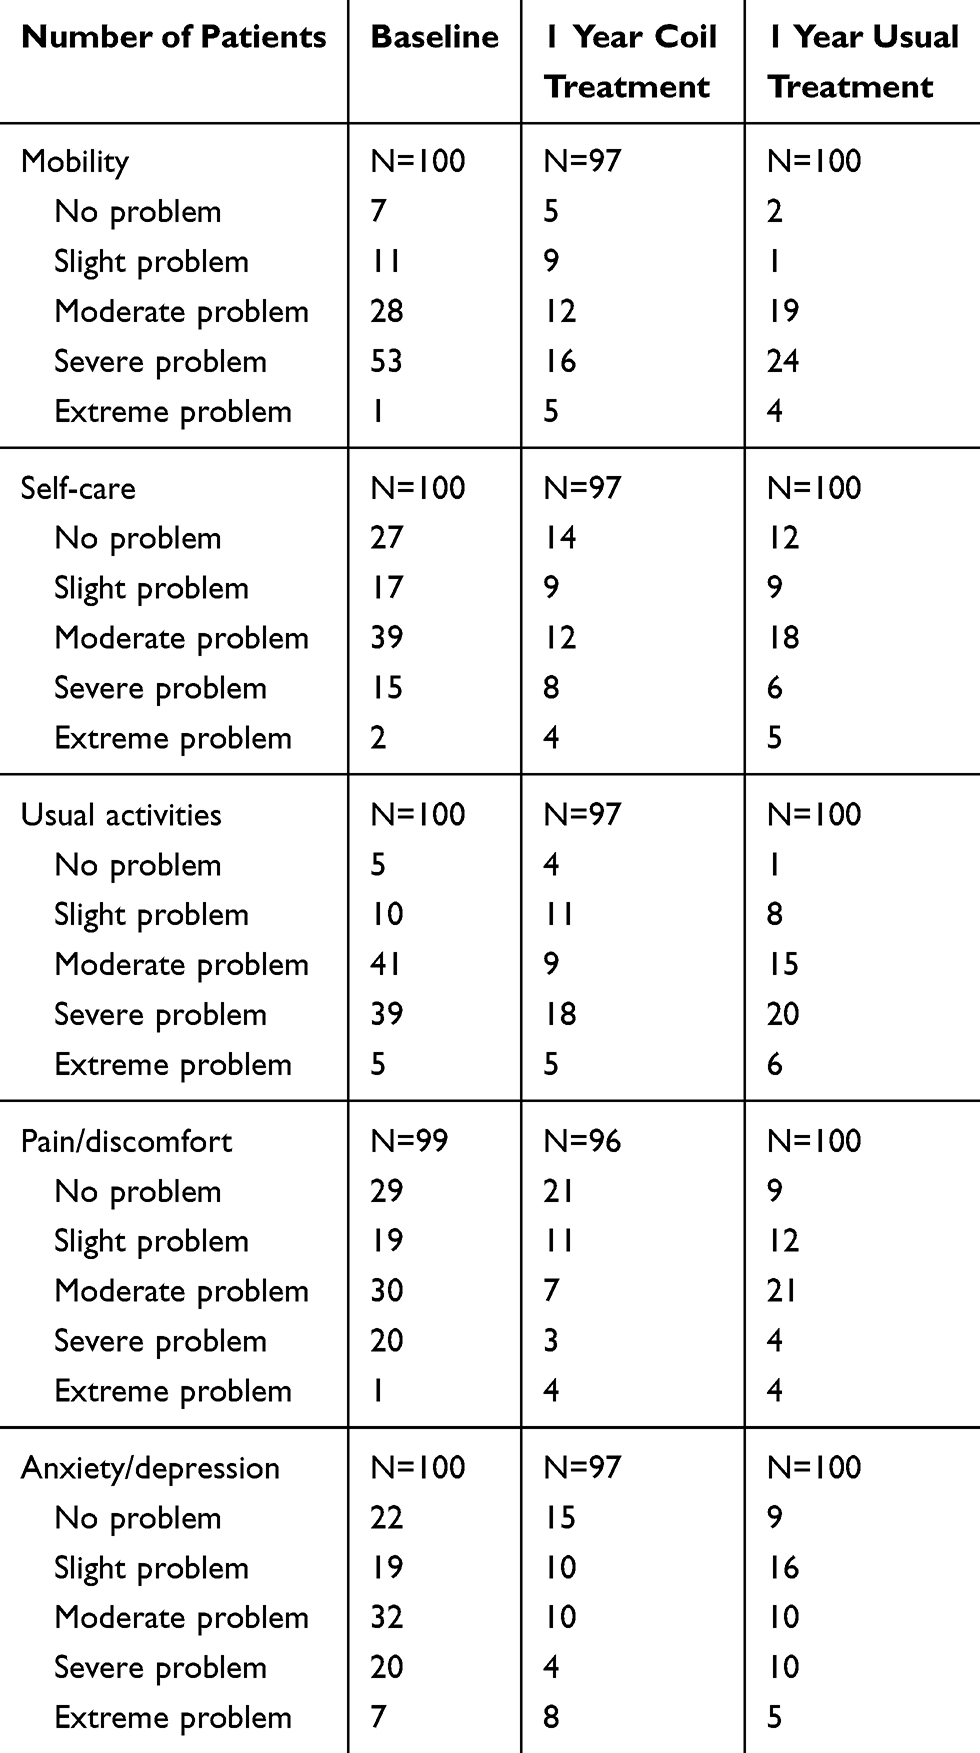 |
Table 1 Distribution of Responses to the EQ-5D Descriptive System at Baseline and 1 Year |
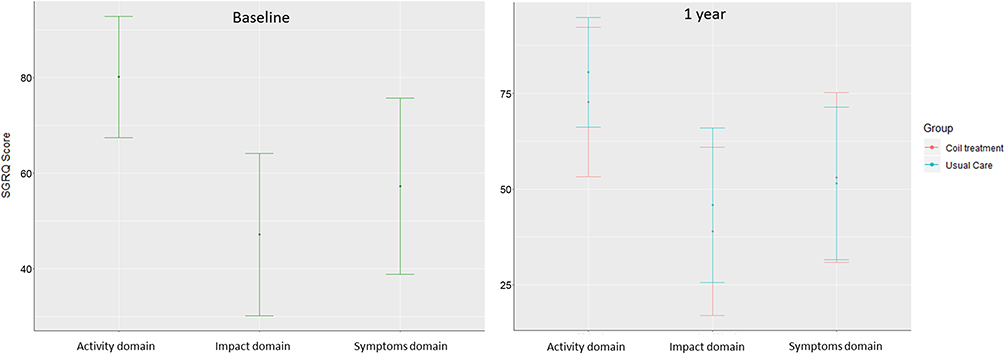 |
Figure 1 Average values of the SGRQ at baseline and 1 year. |
 |
Figure 2 Total EQ-5D and SGRQ scores at baseline and 1 year. |
Correlation
A strong negative correlation between the EQ-5D and the SGRQ total score was observed at baseline and 1 year (p<0.0001 for both). The EQ-5D was strongly correlated with each domain of the SGRQ at baseline and at 1 year (p<0.0001 for all) with the exception of the Symptoms domain at baseline for which the correlation was moderate (p=0.0004) (Table 2). The correlation diagram is presented in Appendix 2. The strong negative correlation between the EQ-5D and the SGRQ total score was also observed when the correlation was studied separately in the coil treatment group and in the usual care group at 1 year (p<0.0001 for both) (Appendix 3a and b).
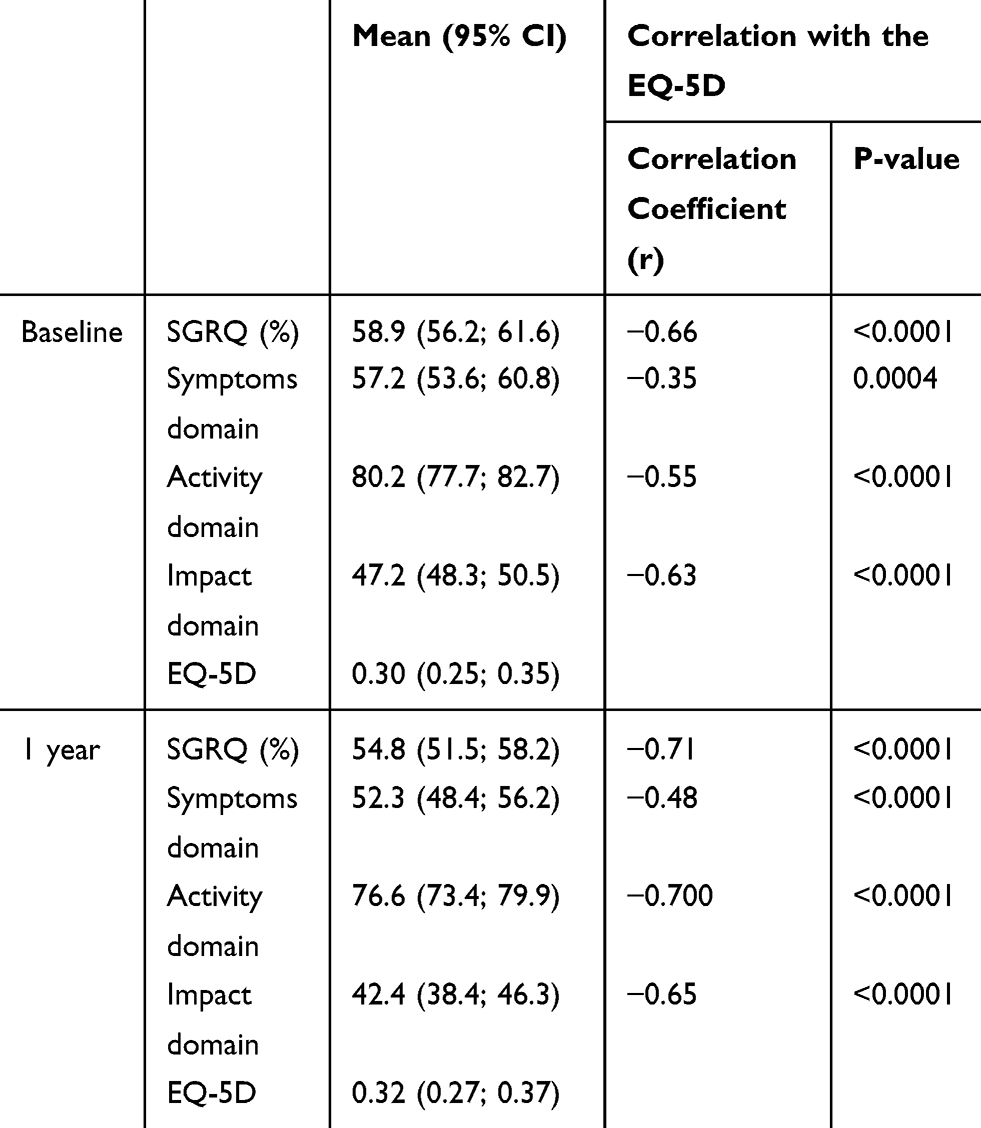 |
Table 2 Correlation Between the EQ-5D and the SGRQ at Baseline and 1 Year |
Concordance
The Lin’s coefficient was 0.48 (0.37; 0.58) at baseline and 0.54 (0.43; 0.64) at 1 year. The Bland Altman plots presented in Figure 3 showed significant points dispersion at baseline and 1 year. The agreement limits were between −0.47 (−0.54; −0.41) and 0.26 (0.20; 0.33) at baseline and between −0.49 (−0.56; −0.43) and 0.23 (0.17; 0.29) at 1 year. In addition, there was a negative bias with a 95% confidence interval excluding zero of −0.11 (−0.07; −0.14) at baseline and −0.13 (−0.17; −0.10) at 1 year, indicating that the EQ-5D score was smaller than the SGRQ score. The significant point’s dispersion and the Lin’s coefficient showed fair concordance between the 2 questionnaires. The fair concordance between the 2 questionnaires was also observed when the concordance was studied separately in the coil treatment group and in the usual care group at 1 year (Appendix 4).
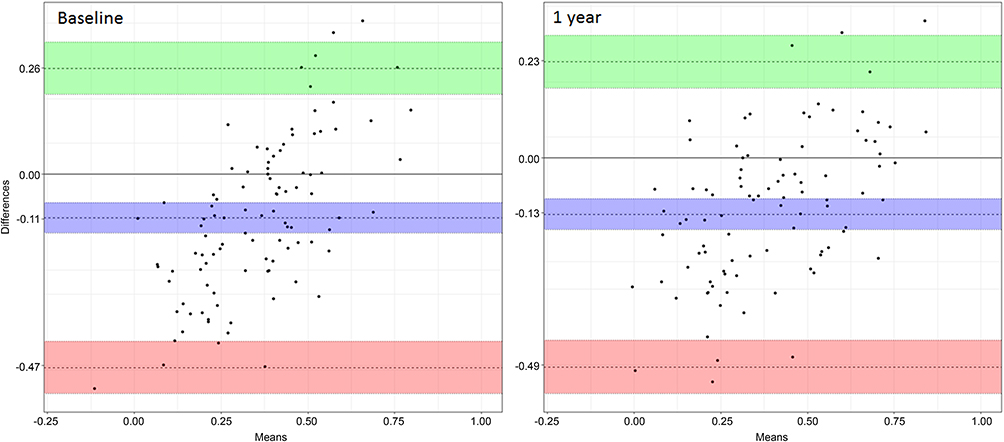 |
Figure 3 Bland Altman Plot of the EQ-5D and the SGRQ score at baseline and 1 year. |
EQ-5D Predicted Value from the SGRQ with Starkie et al Algorithm
A statistically significant difference between the EQ-5D value predicted by the SGRQ and the EQ-5D individual value was observed at baseline and 1 year with a strong positive correlation (p<0.0001) (Table 3). The correlation diagram is presented in Appendix 5. The Lin’s coefficient was 0.39 (0.28; 0.49) at baseline and 0.41 (0.30; 0.50) at 1 year. The Bland Altman plots presented in Figure 4 showed significant points dispersions at baseline and 1 year. Indeed, the agreement limits were between −0.13 (−0.19; −0.06) and 0.59 (0.53; 0.66) at baseline and between −0.12 (−0.18; −0.05) and 0.64 (0.57; 0.70) at 1 year. In addition, there was a positive bias with a 95% confidence interval excluding zero of 0.23 (0.20; 0.27) at baseline and 0.26 (0.22; 0.30) at 1 year, meaning that the EQ-5D predicted value was higher than the EQ-5D individual value. The significant point’s dispersion and the Lin’s coefficient showed poor to fair concordance between the 2 questionnaires.
 |
Table 3 EQ-5D Predicted Value and EQ-5D Individual Value at Baseline and 1 Year |
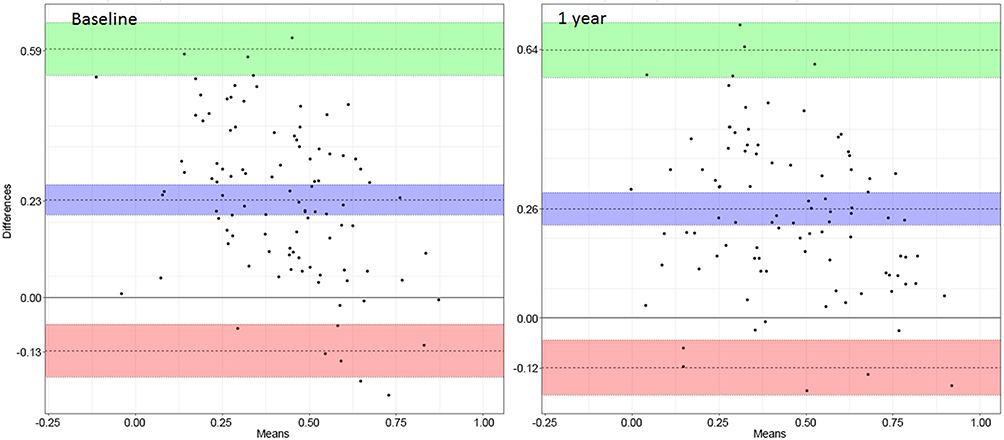 |
Figure 4 Bland Altman plot of the EQ-5D predicted value and EQ-5D individual value at baseline and 1 year. |
Discussion
To our knowledge, this is the first study specifically assessing utility data obtained from a population of patients with severe emphysema who responded to both EQ-5D, a generic quality-of-life questionnaire and SGRQ, a specific quality-of-life questionnaire. The agreement between these 2 questionnaires was studied in order to know if they are both required for a clinical study with an economic component. Results showed a strong correlation but no concordance between the EQ-5D and the SGRQ at baseline and 1 year, demonstrating that these 2 questionnaires are not interchangeable. The correlation analysis showed a moderate rather than strong correlation of the EQ-5D total score with the SGRQ symptom domain at baseline, unlike with other domains. This may be due to the fact that the EQ-5D is a generic questionnaire while the SGRQ is specific to COPD patients and therefore better captures the symptoms of this specific population. Comparable results were found when the analysis was performed at 1 year on the 2 separate groups. Moreover, the algorithm predicting EQ-5D utility from the SGRQ in subjects with COPD did not provide utility values comparable to those observed in the REVOLENS study. Indeed, this study demonstrated a strong correlation between the EQ-5D predicted value and the EQ-5D individual value but no concordance.
Comparability
A 2017 Indian study investigated the relationship between health-related quality of life, measured using the EQ-5D, and respiratory health status, measured using the SGRQ, among coal-based sponge iron plant workers in India.16 This study showed no-to-weak correlation between each component of the 2 questionnaires whereas our study found a strong correlation. This difference can be explained by the difference between patient characteristics in the 2 studies, with severe COPD emphysematous patients in the REVOLENS study. In a COPD population, Wilke et al showed a moderate to strong correlation between the EQ-5D and the SGRQ depending on the time points (r = −0.42 to −0.54, p<0.01)11 and Nolan et al also showed a strong correlation between the 2 questionnaires (r = −0.62, p<0.001). However, it has to be pointed out that the concordance between the EQ-5D and the SGRQ has never been investigated.
One of the limitations of this study is that in the Bland Altman plots, we did not establish the a priori agreement limits due to the lack of data in the literature. So our conclusion on the mismatch was only based on the significant point’s dispersion on the Bland Altman plots and on the Lin’s concordance correlation coefficients. Another limitation is due to the fact that the Starkie et al algorithm was developed for the English population and even if utility weights are close in France, they are not identic. Moreover, we suppose that the EQ-5D-3L was used and not the EQ-5D-5L like in the REVOLENS study which may explain the non-concordance between the EQ-5D predicted value and the EQ-5D individual value. Finally, the sample size has been calculated on the primary endpoint of the clinical study and 100 patients were thus included [6]. The sample size was also calculated using the concordance parameter. With a power of 90%, the sample size required would be 111 which is very close to the initial sample size calculation.
To conclude, due to the lack of concordance between the SGRQ score and the EQ-5D score and to the poor performance of the Starkie et al algorithm, the use of both questionnaires in a clinical study with an economic component is justified. Based on our results, the SGRQ should not be used to obtain a utility score to calculate the incremental cost-effectiveness ratio (ICER) in euro per QALY gained for an economic study.
Ethics Approval
The Ethics Committee of Dijon Est I and the French Agency for Medicines and Health Products Health approved the study protocol. The trial was conducted in accordance with the Declaration of Helsinki. Trial Registration: ClinicalTrials.gov Identifier NCT01822795
Availability of Data and Material
The datasets analysed during the current study are available from the Delegation of Clinical Research and Innovation of Reims University Hospital Center (Délégation à la Recherche Clinique et à l’Innovation, [email protected]) on reasonable request.
Acknowledgments
The members of the REVOLENS Study Group include all authors and Sandra Dury, Hervé Vallerand, François Lebargy, Claire Launois (Hôpital Universitaire de Reims), Johanna Pradelli, Jonathan Benzaquen, Matthieu Buscot, Celine Sanfiorenzo, Sylvia Korzeniewski, Andrea Mazzetta, Jennifer Griffonnet, Ariane Guillemart, Demosthenes Makris (Hôpital Universitaire de Nice), Hervé Mal, Marie Christine Dombret, Frédérique Servin, Marie Pierre Debray (Hôpital Universitaire Bichat, Paris), Hervé Dutau, Sophie Laroumagne, Fabienne Bregeon, Carine Gomez, Philippe Astoul (Hôpital Universitaire de Marseille), Nathalie Lesavre (Centre d’Investigation Clinique 1409, AP-HM, Marseille), Arnaud Bourdin, Jean Pierre Mallet, Anne Sophie Gamez MD, Philippe Tarodo, Christophe Brousse, Clément Broissin (Hôpital Universitaire de Montpellier), Jean Michel Vergnon,Yoann Thibout, Fabrice Di Palma, Frédéric Costes (Hôpital Universitaire de Saint Etienne), Christophe Pison, Amandine Briault, François Arbib, Emilie Reymond, G. Ferrettti (Hôpital Universitaire Grenoble Alpes), Romain Kessler, Michele Porzio, Benjamin Renaud-Picard (Hôpital Universitaire de Strasbourg), Vincent Jounieaux, Bénédicte Toublanc, Géraldine François (Hôpital Universitaire d’Amiens), Mathieu Salaün, Luc Thiberville, Antoine Cuvelier, Samy Lachkar (Hôpital Universitaire de Rouen), Delphine Gras (Monitoring team, Hôpital Universitaire de Reims), Philippe Benoit (Pharmacie, Hôpital Universitaire de Reims), Annick Leclainche, Damien Jolly (Pôle recherche et innovation, Hôpital Universitaire de Reims), François Fourrier, Eric Hachulla, Nicolas Roche, Daniel Dusser (Data and Safety Management Board). These collaborators did not receive any compensation for their contributions.
Author Contributions
All authors contributed to data analysis, drafting or revising the article, gave final approval of the version to be published, and agree to be accountable for all aspects of the work.
JB, GD and IDZ had full access to all of the data in the study and take responsibility for the integrity of the data and the accuracy of data analysis. Study concept and design: JB, GD, CHM, CB, IDZ; Acquisition of data: JB, SL, JMP, HM, CHM, HD, AB, JMV, CP, RK, VJ, MS, AM, SD, CB, MB, GD, IDZ; Analysis and interpretation of data: JB, IDZ; Drafting of the manuscript: JB, GD, IDZ; Critical revision of the manuscript for important intellectual content: JB, SL, JMP, HM, CHM, HD, AB, JMV, CP, RK, VJ, MS, AM, SD, CB, MB, GD, IDZ; Statistical analysis: JB, JP, IDZ; Study supervision: GD, IDZ.
Funding
The REVOLENS Study was supported by an academic grant from the French Ministry of Health (Direction Générale de l’Offre de Soins, PSTIC-2012) which required a randomized trial design associated with an economic evaluation including a cost-effectiveness analysis. The coils were purchased from the manufacturer (PneumRx/BTG, Mountain View, CA). PneumRx/BTG provided financial support for the follow-up of the patients after 1 year which had no involvement in the study design and conduct of the study, collection, management, analysis, and interpretation of the data, preparation, review, or approval of the manuscript, and decision to submit the manuscript for publication.
The French Ministry of Health had full access to the results of the study but had no involvement in the design and conduct of the study, collection, management, analysis, and interpretation of the data, preparation, review, or approval of the manuscript, and decision to submit the manuscript for publication.
Disclosure
Charles Hugo Marquette and Gaëtan Deslée have been involved as investigators in previous studies sponsored by BTG/PneumRx and received travel reimbursements and speaker fees for educational sessions and consulting from BTG/PneumRx. Gaëtan Deslee also reports grants and personal fees from BTG/PneumRx during the conduct of the study, and personal fees from Boehringer, AstraZeneca, Chiesi, Novartis, and Nuvaira, outside the submitted work. Julie Bulsei, Jeanne Pfister, and Isabelle Durand-Zaleski report grants from French Ministry of Health, during the conduct of the study. Sylvie Leroy, Jeanne Marie Perotin, and Coralie Barbe indicated no conflicts of interest in this work.
References
1. EQ-5D-5L – EQ-5D. Euroqol.Available from: https://euroqol.org/eq-5d-instruments/eq-5d-5l-about/.
2. Gusi N, Olivares PR, Rajendram R. The EQ-5D health-related quality of life questionnaire. In: Preedy VR, Watson RR, editors. Handbook of Disease Burdens and Quality of Life Measures. New York: Springer; 2010: 87–99. Available from: http://link.springer.com/referenceworkentry/10.1007/978-0-387-78665-0_5.
3. Guide to the methods of technology appraisal 2013. Guidance and guidelines | NICE. Available from: https://www.nice.org.uk/process/pmg9/chapter/foreword. Accessed November 9, 2018.
4. Nolan CM, Longworth L, Lord J, et al. The EQ-5D-5L health status questionnaire in COPD: validity, responsiveness and minimum important difference. Thorax. 2016;71(6):493–500. doi:10.1136/thoraxjnl-2015-207782
5. Starkie HJ, Briggs AH, Chambers MG, Jones P. Predicting EQ-5D values using the SGRQ. Value Health J Int Soc Pharmacoeconomics Outcomes Res. 2011;14(2):354–360. doi:10.1016/j.jval.2010.09.011
6. Deslée G, Mal H, Dutau H, et al. Lung volume reduction coil treatment vs usual care in patients with severe emphysema: the REVOLENS randomized clinical trial. JAMA. 2016;315(2):175–184. doi:10.1001/jama.2015.17821
7. Deslee G, Barbe C, Bourdin A, et al. Cost-effectiveness of lung volume reduction coil treatment in emphysema. STIC REVOLENS. Rev Mal Respir. 2012;29(9):1157–1164. doi:10.1016/j.rmr.2012.09.010
8. Bulsei J, Leroy S, Perotin J-M, et al. Cost-effectiveness of lung volume reduction coil treatment in patients with severe emphysema: results from the 2-year follow-up crossover REVOLENS study (REVOLENS-2 study). Respir Res. 2018;19(1):84. doi:10.1186/s12931-018-0796-x
9. St. George’s Respiratory Questionnaire – Health Status Research Team. Available from: http://www.healthstatus.sgul.ac.uk/sgrq.
10. Molken MR, Roos B, Van Noord JA. An empirical comparison of the St George’s Respiratory Questionnaire (SGRQ) and the Chronic Respiratory Disease Questionnaire (CRQ) in a clinical trial setting. Thorax. 1999;54(11):995–1003. doi:10.1136/thx.54.11.995
11. Wilke S, Janssen DJ, Wouters EF, Schols JM, Franssen FM, Spruit MA. Correlations between disease-specific and generic health status questionnaires in patients with advanced COPD: a one-year observational study. Health Qual Life Outcomes. 2012;10:98. doi:10.1186/1477-7525-10-98
12. Pickard AS, Yang Y, Lee TA. Comparison of health-related quality of life measures in chronic obstructive pulmonary disease. Health Qual Life Outcomes. 2011;9:26. doi:10.1186/1477-7525-9-26
13. Juniper E, Guyatt G, Jaeschke R. How to develop and validate a new health-related quality of life instrument. In: Quality of Life and Pharmacoeconomics in Clinical Trials.
14. Lin LI-K. A concordance correlation coefficient to evaluate reproducibility. Biometrics. 1989;45(1):255–268. doi:10.2307/2532051
15. Bland JM, Altman DG. Measuring agreement in method comparison studies. Stat Methods Med Res. 1999;8(2):135–160. doi:10.1177/096228029900800204
16. Biswas M, Chattopadhyay K. Relationship between health-related quality of life and respiratory health status among coal-based sponge iron plant workers in Barjora, India. Z Gesundheitswissenschaften. 2018;26(3):355–359. doi:10.1007/s10389-017-0861-9
 © 2020 The Author(s). This work is published and licensed by Dove Medical Press Limited. The full terms of this license are available at https://www.dovepress.com/terms.php and incorporate the Creative Commons Attribution - Non Commercial (unported, v3.0) License.
By accessing the work you hereby accept the Terms. Non-commercial uses of the work are permitted without any further permission from Dove Medical Press Limited, provided the work is properly attributed. For permission for commercial use of this work, please see paragraphs 4.2 and 5 of our Terms.
© 2020 The Author(s). This work is published and licensed by Dove Medical Press Limited. The full terms of this license are available at https://www.dovepress.com/terms.php and incorporate the Creative Commons Attribution - Non Commercial (unported, v3.0) License.
By accessing the work you hereby accept the Terms. Non-commercial uses of the work are permitted without any further permission from Dove Medical Press Limited, provided the work is properly attributed. For permission for commercial use of this work, please see paragraphs 4.2 and 5 of our Terms.