")
Back to Journals » International Journal of Nanomedicine » Volume 12
Do nanoparticles provide a new opportunity for diagnosis of distal airspace disease?
Authors Löndahl J , Jakobsson JKF , Broday DM, Aaltonen HL , Wollmer P
Received 2 September 2016
Accepted for publication 8 October 2016
Published 19 December 2016 Volume 2017:12 Pages 41—51
DOI https://doi.org/10.2147/IJN.S121369
Checked for plagiarism Yes
Review by Single anonymous peer review
Peer reviewer comments 2
Editor who approved publication: Dr Thomas Webster
Video abstract presented by Jakob Löndahl.
Views: 780
Jakob Löndahl,1,2 Jonas KF Jakobsson,1,2 David M Broday,3 H Laura Aaltonen,4 Per Wollmer4
1Division of Ergonomics and Aerosol Technology (EAT), Department of Design Sciences, 2NanoLund, Lund University, Lund, Sweden; 3Faculty of Civil and Environmental Engineering, Technion, Haifa, Israel; 4Department of Translational Medicine, Lund University, Malmö, Sweden
Abstract: There is a need for efficient techniques to assess abnormalities in the peripheral regions of the lungs, for example, for diagnosis of pulmonary emphysema. Considerable scientific efforts have been directed toward measuring lung morphology by studying recovery of inhaled micron-sized aerosol particles (0.4–1.5 µm). In contrast, it is suggested that the recovery of inhaled airborne nanoparticles may be more useful for diagnosis. The objective of this work is to provide a theoretical background for the use of nanoparticles in measuring lung morphology and to assess their applicability based on a review of the literature. Using nanoparticles for studying distal airspace dimensions is shown to have several advantages over other aerosol-based methods. 1) Nanoparticles deposit almost exclusively by diffusion, which allows a simpler breathing maneuver with minor artifacts from particle losses in the oropharyngeal and upper airways. 2) A higher breathing flow rate can be utilized, making it possible to rapidly inhale from residual volume to total lung capacity (TLC), thereby eliminating the need to determine the TLC before measurement. 3) Recent studies indicate better penetration of nanoparticles than micron-sized particles into poorly ventilated and diseased regions of the lungs; thus, a stronger signal from the abnormal parts is expected. 4) Changes in airspace dimensions have a larger impact on the recovery of nanoparticles. Compared to current diagnostic techniques with high specificity for morphometric changes of the lungs, computed tomography and magnetic resonance imaging with hyperpolarized gases, an aerosol-based method is likely to be less time consuming, considerably cheaper, simpler to use, and easier to interpret (providing a single value rather than an image that has to be analyzed). Compared to diagnosis by carbon monoxide (DL,CO), the uptake of nanoparticles in the lung is not affected by blood flow, hemoglobin concentration or alterations of the alveolar membranes, but relies only on lung morphology.
Keywords: nanoaerosols, lung particle interaction, emphysema, respiratory diagnosis, AiDA, COPD
Introduction
More than 200 million people suffer from chronic obstructive pulmonary disease (COPD) worldwide, and three million of them die each year.1 Thereby, COPD is the fourth most common cause of death globally. COPD consists of both bronchial disease and emphysema, with the latter leading to enlargement of the airspaces distal to the terminal bronchioles. Clinical evaluation of peripheral airspaces is difficult, since this region is not readily accessible for analysis.2 The current standard diagnostic test for COPD is spirometry, which can detect airflow obstruction but has limited sensitivity to changes in the small airways.3 Thus, early-stage emphysema may be present without being diagnosed if only spirometry is used.4,5
A noninvasive technique with the ability to detect morphological changes in the small airways, including changes due to emphysema, is aerosol-derived airway morphometry (ADAM).6–11 ADAM provides information on the airway dimensions by comparing inhaled and exhaled concentrations of monodisperse aerosol particles, usually in the range of 0.8–1.0 μm. In still air, particles of this size deposit primarily by gravitational settling, with the deposition efficiency depending on the vertical distance to the airway surfaces.12 Based on this notion, the effective airway diameters (EADs) are derived with a simple deposition model.7,13,14 ADAM has been shown to provide detailed information on airway diameters, especially in healthy subjects.6,7,15–20 The method has also been validated with excised lungs of humans,21 donkeys,22 and dogs,23 as well as with a bed of packed glass beads.24 Furthermore, ADAM was found to be sufficiently sensitive to detect the increase in airspace dimensions with age.17,18,25 For patients or animal models with respiratory disease, ADAM generally provides more ambiguous data, with the most promising findings related to enlarged airspaces in emphysema.6,26–39
Although ADAM has several advantages in comparison to other diagnostic techniques, it has not become a common clinical practice for diagnosing COPD or other airway diseases. In fact, research of ADAM and its application as a diagnostic tool has ceased during the last decade. Two difficulties with ADAM are its requirement of a repeatable (and low) breathing flow rate and uncertainties concerning particle penetration into the diseased lungs.6,7,39 The need for a highly controlled breathing maneuver at a low flow rate makes it difficult to measure the peripheral airspace dimensions at larger volumetric lung depths and at maximum inflation of the lungs.17 Hence, ADAM has often been used to measure recovery at a fraction of the total lung capacity (TLC), which requires a preceding determination of lung volumes.
It is hypothesized that these difficulties can be reduced by using nanoparticles <0.1 μm instead of micrometer-sized particles. As further detailed in this study, particles in this size range have a higher ability to penetrate into the peripheral airways, and they are less sensitive to obstructions and disturbances to the airflow in the tracheobronchial tree than micron-sized particles. Nanoparticles with neutral electrical charge deposit almost exclusively by Brownian diffusion.40 Deposition by diffusion depends on the residence time and on the distance to the airway wall, but not on the airway orientation. Similar to particle deposition by gravitational settling in ADAM, particle loss due to diffusion in the alveolar region during breath-hold is related to the size of the airspaces.41
The objective of this work is to provide a basic theoretical background to the method of airspace dimension assessment by nanoparticles (hereafter named AiDA). In the following, previous findings on nanoparticle deposition in subjects with respiratory disease are summarized. Suitable breathing maneuvers are discussed for AiDA, an optimal particle size for the method is estimated, and the assumptions about AiDA are compared with the results obtained for ADAM. The relationship between the airspace dimensions and the recovery of exhaled nanoparticles is approximated and finally the potential use of AiDA for COPD diagnosis is briefly elaborated.
Deposition of nanoparticles in diseased lungs
Experimental data on deposition probabilities of inhaled nanoparticles in patients with COPD are scarce and inconsistent (Figure 1). Apart from a few studies on asthmatics, the deposition of nanoparticles has only been investigated in 40 subjects with respiratory disease: 32 with COPD, five with obstructive lung disease, and three with restrictive lung disease.42–46 Different diagnostic methods were used, with only one study separating the COPD patients into those with predominantly airways disease (n=7) and those with predominantly emphysema (n=3).43 The exposure procedures varied, with three studies using spontaneous breathing,43,44,46 one using bolus inhalation,45 and one a predetermined breathing cycle.42 The particle types also differed: monodisperse technetium-99 m-labeled ultrafine carbon aerosol,43,45 polydisperse di-ethyl-hexyl-sebacate,42 emissions from biomass combustion,46 and diesel exhaust particles.44 Hence, it is difficult to draw any solid conclusions from the available data.
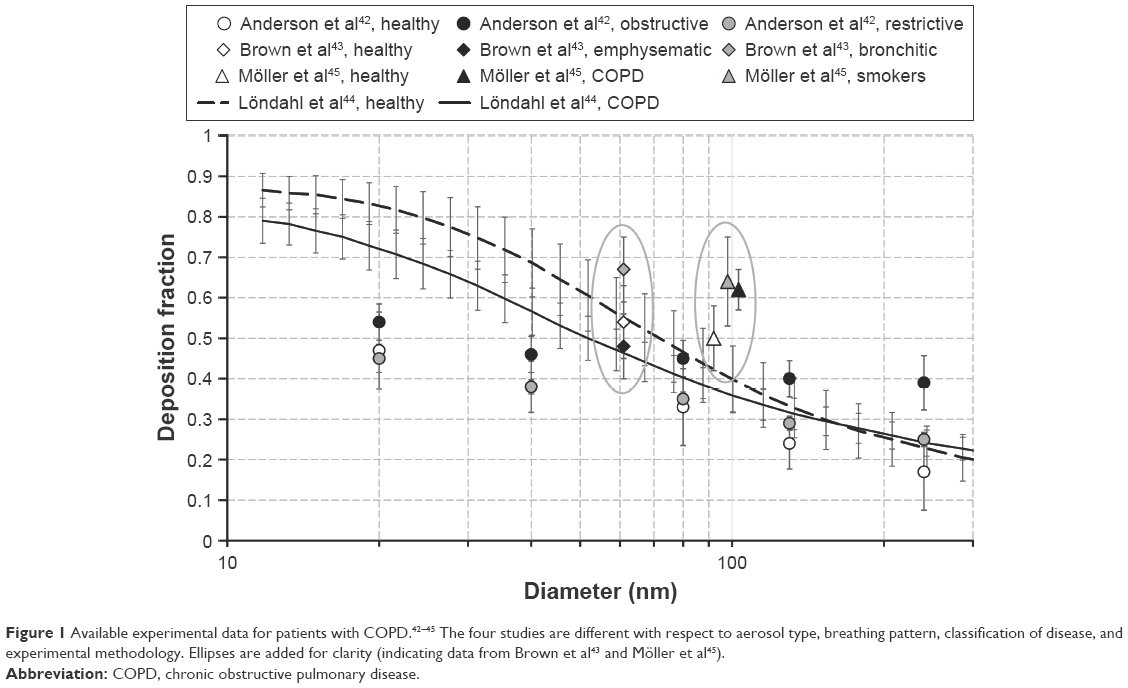 | Figure 1 Available experimental data for patients with COPD.42–45 The four studies are different with respect to aerosol type, breathing pattern, classification of disease, and experimental methodology. Ellipses are added for clarity (indicating data from Brown et al43 and Möller et al45). |
All the experimental studies found deviations in deposition of nanoparticles between diseased subjects and healthy controls, although differences were both positive and negative (Figure 1). However, group differences are uncertain, since the number of subjects with respiratory disease was limited to 3–10 in each study. Since only one of the studies reported a similar breathing pattern for all subjects, it is also difficult to assess if differences were due to varying breathing flows or due to lung morphology. A comparison of experimental data and the ICRP model (International Commission on Radiological Protection) for a group of 17 subjects (10 with COPD) who were exposed to diesel exhaust particles reveals that breathing pattern changes cannot explain the decrease in deposition of particles <40 nm in the COPD patients, nor the increase in deposition of particles >400 nm.44,47 Similar results were obtained for biomass combustion particles.46
Experimental data with imaging techniques also show that nanoparticles, unlike larger-sized particles, do not have a decreased peripheral deposition in patients with airway obstructions.43,45,48–53 Möller et al45 measured the central/peripheral deposition ratio during bolus inhalation that targeted the peripheral lung region or the central airways. For the peripheral lung, no differences were found between COPD patients or smokers and the nonsmoking controls. For boluses targeted to the central airways, the fraction of nanoparticles reaching further into the peripheral lung was significantly higher in COPD (P<0.01, 100 nm particles, central/peripheral ratio 2.01 and 1.22 for healthy and COPD subjects, respectively). In contrast, Brown et al43 found a small increase in central deposition for patients with COPD (P<0.05, 61 nm particles, central/peripheral ratio 1.01 and 1.11 for healthy and COPD subjects, respectively). For particles >450 nm, measurements consistently showed an increase in the central deposition in COPD or asthma patients even at moderate flow rates.48–54
There are few model calculations on deposition of nanoparticles in diseased lungs, and often these are limited to confined regions of the respiratory tract. In general, modeling of particle deposition in diseased lungs is difficult and requires numerous assumptions and simplifications of both the lung morphology and the airflow patterns, since the morphology of diseased lungs is more complex and heterogeneous compared to normal lungs. Computational lung deposition models can be divided into two classes: local deposition models that are normally based on computational fluid dynamics (CFD) and whole-lung deposition models.55,56 CFD models are computationally demanding and usually restricted to the upper airways or specific regions of the tracheobronchial tree. These models calculate flow rates and deposition patterns of aerosol particles at high spatial resolution. However, simplifications are often made to the structure of respiratory tree, for example, regarding cartilaginous rings, carinal ridges, and the complex alveolar region and its dynamic change in dimensions during the breathing cycle.55,57 In addition, isolating local regions of the respiratory tract entails uncertainties due to the unknown flow fields at the entrance to the computational domain.58 The calculations are also difficult to validate with experimental data, especially for the narrow airspaces. Whole-lung models on the other hand are semiempirical and do not provide detailed information on changes in deposition due to local abnormalities in the airways. Typically, the deposition is modeled as the sum of particle losses in a series of filters or pipes with simple characteristics.
Few CFD models investigate diseased lungs, and almost all of these models are restricted to calculating flow fields or the deposition of micrometer-sized particles. One study reported that particle deposition in the central airways was significantly altered by sidewall or carinal tumors and airway constrictions or blockage with higher deposition of large particles (>1 μm) when tumors were present.59 The opposite, that is, decreased deposition, was estimated for nanoparticles. It is noteworthy that CFD models for normal lungs show a nonuniform deposition of micron-sized particles, with increased particle deposition at specific sites, such as the carinal ridges, while nanoparticles tend to coat the surfaces more uniformly.58,60–62 The deposition enhancement factor (DEF), which is high at deposition “hot spots”, is often more than two orders of magnitude larger for micron-sized particles compared to nanoparticles.61–63 For instance, Zhang et al62 calculated that DEF in generation 0–3 of the bronchial tree was up to 400–2,400 for particles in the range of 1–10 μm, while only 2–10 for nanoparticles in the range of 10–100 nm.62 Based on the computational model results for micron-sized particles, DEF and local deposition are expected to be increased in patients with respiratory airway disease.
Whole-lung models estimated increased deposition of nanoparticles in bronchitic patients and decreased deposition in emphysematic patients.64,65 Deposition was also predicted to vary depending on the emphysema type – centriacinar, paraseptal, panacinar, and bullous. The lowest deposition was predicted for bullous emphysema, since particles need to pass larger distances before depositing on the alveoli walls. Yet, this result awaits experimental verification, since it is known that the bullae, that is, large air pockets in the lungs, are poorly ventilated, and it is thus unclear to what extent the inhaled aerosol actually enters these airspaces. Interestingly, particles in the range of 30–50 nm were suggested to have a substantially decreased deposition in emphysema patients, and thus be most suitable for reaching the outermost region of the lung.65
In contrast to the few inconclusive studies on nanoparticle deposition patterns in diseased lungs, micron-sized particles repeatedly demonstrate an increased deposition during tidal breathing for patients with COPD.66–70 This is an effect of the altered flow field in the obstructed and constricted airways, as the micron-sized particles are mainly affected by inertial and gravitational losses. In contrast, deposition by diffusion, as is the case for nanoparticles, is less affected by disturbances of the airflows. The only exception to the increase in deposition of large particles in COPD is the measurements made with ADAM, where deposition is studied in still air from the respiratory zone.
Breathing maneuver in ADAM and AiDA
There are three versions of ADAM: single-breath recovery, bolus recovery, and the particle concentration technique.9,13 The single-breath technique provides a volume-weighted EAD for the whole lung by determining the particle half-life from different breath-holding periods.6,7 The bolus recovery technique probes different volumetric lung depths with small (30–100 mL) boluses to obtain information of EAD as a function of volumetric lung depth, but at the expense of an extensive measurement protocol with several breath-holding periods for each studied lung depth.15,16 The particle recovery technique combines the more detailed information from the bolus recovery technique with the simple execution of the single-breath technique through a continuous measurement of the recovery in the exhaled air. The recovery data is then divided into consecutive bins that correspond to EADs at different volumetric lung depths.17,18
The fundamental difference between the proposed new method – AiDA – and aerosol-derived airway morphometry (ADAM) is the particle deposition mode. The three main particle deposition mechanisms in the respiratory tract are diffusion, gravitational settling, and inertial impaction. Figure 2 shows the displacement velocity due to Brownian motion, and the settling velocity due to gravity for unit density particles.71 As seen, the diffusion displacement speed of 0.1 μm particles is approximately similar to the settling velocity of 1 μm particles. Deposition by impaction occurs foremost in the proximal airways and has important contribution to the total deposition only when particle inertia is substantial. Hence, significant contribution by inertial deposition to the total lung deposition in healthy people during normal breathing conditions is expected only for particles >2 μm. However, inertial deposition can be substantially altered in patients with airflow obstruction, due to the velocity field in partially blocked airways, and affect the deposition of particles >200 nm.49,72
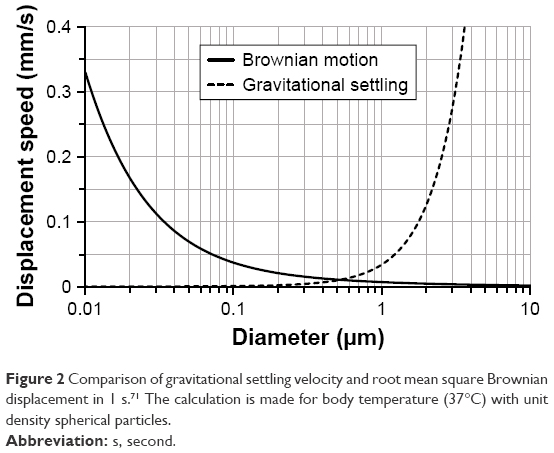 | Figure 2 Comparison of gravitational settling velocity and root mean square Brownian displacement in 1 s.71 The calculation is made for body temperature (37°C) with unit density spherical particles. |
Apart from the distinct particle size, the breathing pattern of ADAM and AiDA is also different. The breathing procedure used in AiDA is similar to the well-established maneuver performed during measurement of the diffusion capacity for carbon monoxide, DL,CO.73 A measurement of DL,CO begins with a period of spontaneous tidal breathing at a mouthpiece to adjust to the equipment. Thereafter follows an exhalation to the residual volume (RV), a fast inhalation to TLC, a 10±5 seconds breath-hold and finally exhalation. In ADAM, a comparable breathing pattern is used, but the flow rate during inhalation and exhalation is held constant, usually at 250 mL/s, by the subjects following a signal on a screen. Because of the low airflow, inhalation normally begins at the functional residual capacity (FRC), or between the RV and FRC, and ends at around 70%–85% of the TLC. Next follows a breath-hold of 2–10 seconds, and finally expiration at a similar flow rate as during inspiration.
The low and controlled airflow in ADAM is required for achieving constant particle losses during the inspiration and expiration phases for all the breath-holding periods. Thereby, the recovery can be obtained only from the breath-hold periods, when particles settle in presumably still air. The fast and deep inhalation, as used in DL,CO, could result in substantial uncertainties if it was applied in ADAM, with the high airflow rates leading to increased micron-sized particle losses due to inertial impaction which are harder to measure with high precision, especially in COPD patients.6 In addition, deposition during inhalation and exhalation may be enhanced if a patient has an unsteady flow rate.74 It is also notable that particle losses differ between inspiration and expiration.75,76 The breathing procedure in ADAM, with controlled breathing flow rate, is possible to achieve by most subjects after some training, but has been reported to be challenging for some groups of patients and for children.8,39 In clinical practice, difficulties may be larger as time is more limited and as volunteers in research studies may be more approving and adaptive than patients in general.
For AiDA, high flows during inspiration and expiration are not expected to cause difficulties, as they will increase rather than decrease the fraction of the nanoparticles that deposit in the pulmonary region (Figures 3 and 4). Figure 3 illustrates the particle deposition fraction in the pulmonary region for a breathing cycle with 2,000 mL inhalation, 10-second breath-hold and exhalation at a constant flow rate. Figure 4 shows the deposition fraction in each generation along the respiratory tree during inhalation and exhalation (without breath-hold) for a healthy adult breathing through the mouth in an upright position (based on the Multiple Path Particle Dosimetry model version 2.1177). As seen, deposition of nanoparticles (50–100 nm) in the pulmonary region is relatively insensitive to the breathing rate (Figure 3), whereas increased deposition of larger particles in the extra-thoracic and tracheobronchial regions is evident at higher flows.
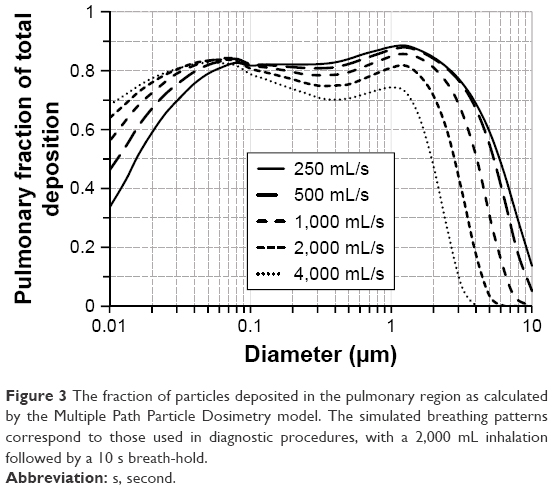 | Figure 3 The fraction of particles deposited in the pulmonary region as calculated by the Multiple Path Particle Dosimetry model. The simulated breathing patterns correspond to those used in diagnostic procedures, with a 2,000 mL inhalation followed by a 10 s breath-hold. |
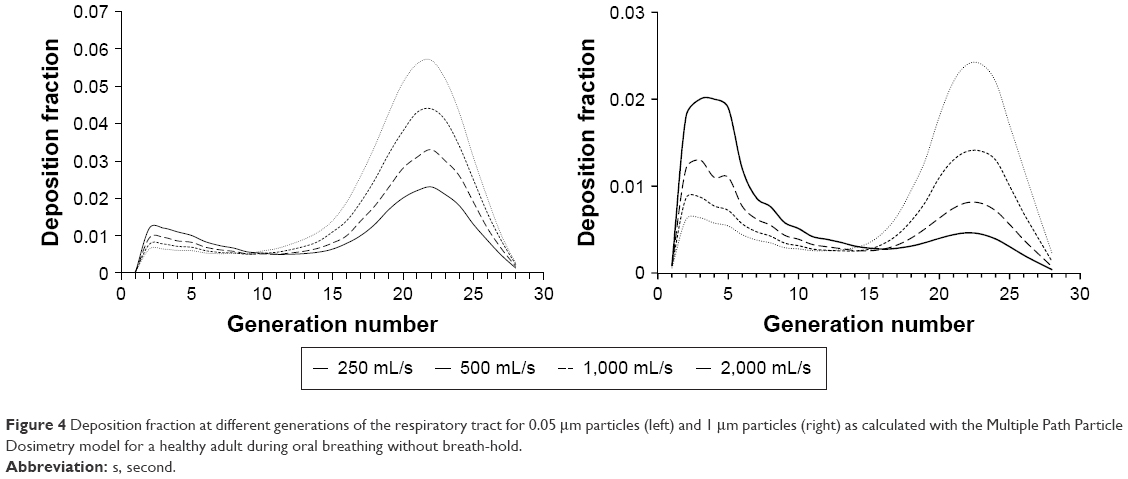 | Figure 4 Deposition fraction at different generations of the respiratory tract for 0.05 μm particles (left) and 1 μm particles (right) as calculated with the Multiple Path Particle Dosimetry model for a healthy adult during oral breathing without breath-hold. |
The advantage of being able to use higher flow rates in AiDA is that a breathing pattern similar to that used in DL,CO measurements can be used. This means an easier breathing protocol for the patient and that the airspace dimensions can be measured at TLC, when the alveoli are maximally inflated. Thus, clinical procedures can be simplified substantially. In ADAM, airspace dimensions are almost exclusively determined at a fixed percentage of TLC, which entails additional time to measure TLC and preferably also FRC – a process that requires a body plethysmograph or instruments for gas dilution measurements, and may give rise to uncertainties.
Assessment of airspace dimensions from particle recovery
A number of studies develop the theoretical framework for the relationship between pulmonary airway dimensions and recovery of monodisperse particles that deposit predominantly by gravitational settling.7,10,11,14,41,78–81 Two approaches were presented: the tube model, which can be used for both the airways and the acini, and the chord-length model, which is specific for the acini. In the tube model, the airspace dimensions are approximated assuming that particles deposit in a system of identical, yet randomly oriented, cylindrical tubes. The airway radius, r, is related to the recovery, R(t), of particles after a breath-hold as
|
|

where vs is the particle terminal settling velocity.7,78 Thus, the tube radius can be calculated from the particle half-life time, t½:
|
|

This model, however, does not account for diffusion. For unit density spheres, the root mean square (r.m.s.) Brownian displacement and the terminal settling velocity are approximately equal for 0.5 μm particles (Figure 2). Hence, particles with this diameter are considered to be the smallest particles suitable for ADAM.82
For a 100 nm particle, the r.m.s. Brownian displacement is 45 times larger than the terminal settling velocity of unit density spheres, and on timescales smaller than a few minutes, nanoparticles can be considered to deposit exclusively by diffusion. For longer times, gravitational settling may become significant, because it is directly proportional to the time, whereas deposition by diffusion scales with the square root of time. The theory behind the estimation of airway radii from diffusion losses is based on solution of the diffusion equation in circular tubes,79,83,84
|
|
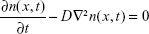
where n(x, t) is the number concentration of particles at location x and time t, and D is the diffusion coefficient given by the Stokes–Einstein relation
|
|

Here, k is the Boltzmann coefficient, T is the temperature, Cc is the Cunningham slip correction factor, μ is the air viscosity and dp is the particle diameter (all in SI units). The diffusion equation (eq. 3) for a cylindrical tube with axisymmetric boundary conditions can be solved easily by separation of variables. Assuming homogenous initial concentration, the fraction of recovered particles is given by
|
|
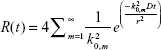
where k0,m is the mth root of the Bessel function of the first kind, J0(x) =0 (ie, k0,1 =2.41, k0,2 =5.52, k0,3 =8.65, k0,4 =11.79, etc). As long as the initial concentration profile is axisymmetric, the solutions to R(t) will be a sum of a series of exponential functions.83 After a certain time, a single exponential function will dominate the summation (normally for m=1). The time needed to reach the single exponential phase depends on the initial concentration profile, the particle size (via its diffusion coefficient, eq. 4) and the tube radius. For nanoparticles (<0.1 μm), the typical time for this to occur in the peripheral airspaces is expected to be <5 seconds. Hence, the measured half-life time, t½, of the particles is assumed to correspond to only the first term in the infinite exponential series. Thus, the representative radius is estimated from
|
|

which leads to
|
|

Since ADAM reports the EADs, sticking to the same terminology, EAD = 2r.
The recovery without breath-hold is denoted by R0. In general, it depends on the initial concentration profile and on the particle losses during inhalation and exhalation. When taking only the first exponential term into account, R0 can be determined from the measured R(t) values as
|
|
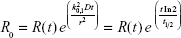
Eq. 2 reveals that when the airway radius is assessed by recovery of diffusive nanoparticles, it is proportional to the square root of the half-life of the diffusional deposition process and not to the half-life itself, as when the assessment is based on deposition of gravitationally settling particles (eq. 7). Hence, a change in the airway radii has a larger effect on the half-life of nanoparticles than of micron-sized particles. This is a notable advantage of AiDA, since based on this model, changes in the lung morphology will lead to more sizeable variations, which can be measured more easily. In other words, airways radius estimated using eq. 7 is expected to be less sensitive to (indirect) measurement errors of t½ (which is estimated by regressing the exponential function against time series of measured data). The use of eq. 7 is clearly more supported when diffusional deposition is predominant, which according to Goldberg and Smith,83 corresponds to
|
|

Figure 5 illustrates estimated half-life times for different tube radii and particle sizes. As can be seen, t½ ranges between about 1 and 60 seconds for particles with size between 40 and 150 nm. This roughly sets the limits for an applicable particle size range. Being in the lower end of this size range has the advantages of less interference by gravitational settling and a shorter time to reach the single-exponential behavior.
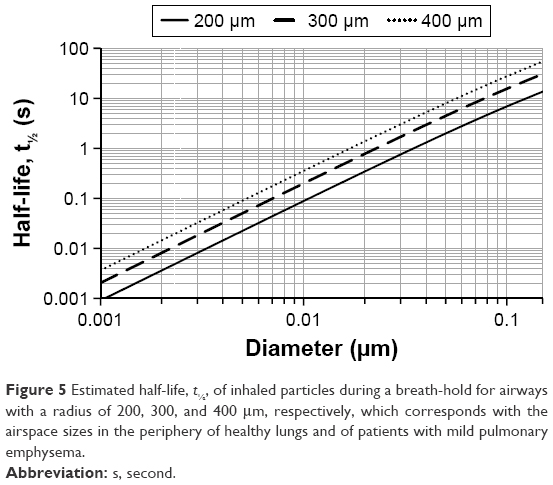 | Figure 5 Estimated half-life, t½, of inhaled particles during a breath-hold for airways with a radius of 200, 300, and 400 μm, respectively, which corresponds with the airspace sizes in the periphery of healthy lungs and of patients with mild pulmonary emphysema. |
A consequence of the nonlinear relationship between the airspace radius and the half-life for AiDA (eq. 7) is that the derived radius, rmean, of a collection of airspaces of different dimensions, ri, will be weighted toward the larger dimensions. Assuming equal volumes of all airspaces,
|
|
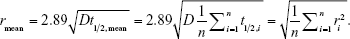
Thus, for AiDA, the rmean is the r.m.s. of all the measured radii, whereas for ADAM, it is the arithmetic mean. From a diagnostic perspective, it is an advantage that a small number of enlarged airspaces have a disproportional effect on rmean. Hence, this is a significant benefit of AiDA over other techniques.
Uncertainties in the analysis of airflow and particle deposition data in recovery experiments of both nanoparticles and micrometer-sized particles stem from the numerous assumptions used, including that the airways are tubular and uniform. In reality, the airways geometry is much more complex, and the physical meaning of the estimated airway radius is unclear.85 It is also well known that many lung diseases, such as pulmonary emphysema and asthma, are heterogeneously distributed in the lungs. The effects of this morphological heterogeneity on the measured recovery cannot be easily addressed theoretically, especially for late stages of emphysema where the diseased parts of the lungs may be poorly ventilated.
Possibly, the most important difference between AiDA and ADAM is the potential for higher penetration of nanoparticles into the peripheral regions of diseased lungs. The optimal particle size for reaching the most distal parts of the acinus is a compromise between particle with minimal deposition characteristics, which can be carried to the deep lungs (convective transport) during inhalation, and a large displacement velocity during the subsequent breath-hold to reach remote areas. The former is achieved by large nanoparticles, while the latter increases for small nanoparticles.47,86–88 Based on the analysis explained, the optimal particle size range for AiDA is 40–100 nm, but experiments and detailed model calculations, especially for diseased lungs, are necessary to confirm these theoretical predictions.
Relationships between particle loss and the morphology of terminal bronchioles and gas-exchange region
In addition to the information on the airway radii obtained from t½, the recovery without breath-hold as derived from the single exponential function, R0, also reflects the lung morphology. The factor R0 depends on the initial concentration profile in the airway tubes, the time for the inhalation and exhalation and particle losses during transport of the aerosol. Assuming that all the lungs have similar initial concentration profiles, variations in R0 reflect particle loss during the inhalation and exhalation phases of the breathing maneuver. For nanoparticles in the range of 40–100 nm, most of these losses occur distal to generation 15 in the respiratory tree, corresponding to the terminal bronchioles and the gas-exchange region (Figure 4). Thus, R0 is likely to reveal either changes in the deeper parts of the lungs or abnormal particle concentration profiles, for instance, due to local turbulence or distorted airways. Variations in R0, therefore, may provide additional clinical information about possible abnormalities in these regions.
AiDA as a diagnostic tool
There is a need for techniques to assess abnormalities in the peripheral lung, not least in diagnosis of COPD. The diagnosis of COPD is based on long-standing cough and/or dyspnea on exertion in combination with airflow limitation after bronchodilatation, usually demonstrated by spirometry and a history of exposure to noxious inhalants.3 But as spirometry has poor sensitivity to changes in small airways, emphysema may remain unidentified if no other techniques are used.4,5 Emphysema is an indicator of poor prognosis, and since the most effective treatment is to reduce harmful exposure, primarily by smoking cessation, an early diagnosis is crucial to motivate patients to stop smoking.89,90 Current techniques with high sensitivity for emphysema are X-ray computed tomography (CT) and magnetic resonance imaging (MRI), where hyperpolarized and poorly soluble gases, normally Helium-3 or Xenon-129, are used as contrast agents.73,91–94 CT is expensive compared to spirometry and DL,CO, and also entails a radiation dose. MRI with hyperpolarized gases is inaccessible and generally too costly to be used other than for research purposes. DL,CO, although a sensitive indicator of abnormal lung function, is affected by blood flow, hemoglobin concentration or alterations of the alveolar membranes and is therefore not specific for emphysema.73 In the absence of airflow limitation, reduced DL,CO can therefore not be taken to indicate emphysema. Thus, there is a need for simple, sensitive and reliable method for diagnosing emphysema.
Compared to CT and MRI with hyperpolarized gases, lung diagnosis with an aerosol-based method, such as AiDA, is likely to be less time consuming, considerably cheaper, simpler to use, and easier to interpret (a single value rather than an image that has to be analyzed). Corresponding to carbon monoxide molecules in DL,CO, nanoparticles move by diffusion, and thus, a breathing maneuver similar to that of DL,CO could be utilized. In contrast to carbon monoxide in DL,CO, the uptake of nanoparticles in the lung is not affected by other variables than morphology.
The major challenge of AiDA, in comparison to ADAM, is the need for a more advanced experimental technique. Particles larger than about 0.2 μm can be detected by light scattering directly at the mouthpiece. For smaller particles, more sophisticated methods, such as condensation particle counters or instruments based on electrometers, are needed – these instruments are on the other hand more accurate than optical particle counters, which are sensitive to scattering properties (for instance, caused by changes in humidity), particle shape and mal-detection from multiple particles in the measurement zone. However, over the last decade, such techniques have improved rapidly due to an increased interest in nanotechnology and health aspects of nanoparticles. For instance, Kim and Jaques95 performed fast sampling of nanoparticles directly at the mouthpiece through bypassing of the averaging circuit in an ultrafine condensation particle counter. Another option is to use fast valves for sampling of specific volumes of the exhaled air before analysis.96
The use of inhaled particles for diagnosis has implications for approval and regulation of AiDA as a medical device. Insoluble nanoparticles can be more toxic than larger particles at equal mass concentrations due to a higher total surface area.97 On the other hand, the mass concentration of nanoparticles in AiDA is expected to be very low. An optimal inhaled number concentration is below 100,000 particles/cm3 to avoid coincidence in the detection instruments and particle losses by coagulation.98,99 This concentration is comparable to normal urban background of nanoparticles, and over a single breath procedure, the deposited amount of particulate material will be insignificant compared to real-world particle exposures. In addition, the particle substance used in AiDA can be of a material with low toxicity which ideally is biodegradable. Due to the small particle size, the total inhaled particle mass in AiDA will be orders of magnitude less than for ADAM.
Summary and conclusion
The usage of nanoparticles for assessment of distal airspace morphology and detection of emphysema may have several advantages in comparison to previous aerosol-based methods with larger particles: 1) High breathing flow rates do not increase deposition and a breathing maneuver similar to the clinically well-established DL,CO could most likely be used, which considerably would facilitate the procedure for the patient and reduces overall examination time as no training is needed prior to measurement. 2) A higher breathing flow rate makes it possible to inhale from the RV to TLC, and consequently, the peripheral airspace dimensions can be measured at maximum inflation which eliminates the need for determination of lung volumes for interpretation of data. 3) A change in airway radius has a larger effect on the measured parameter, the particle half-life timet½, for nanoparticles than for micrometer-sized particles, and thus, the sensitivity is expected to increase. 4) Interpretation of clinical data is expected to be simpler as the deposition of nanoparticles is almost exclusively determined by diffusion, while the deposition of micron-sized particles is a complex combination of settling and diffusion. 5) The mass concentration of the inhaled particles is likely to be reduced by two to three orders of magnitude, which may be of importance for acceptance by patients or regulatory authorities. 6) Finally, but perhaps most importantly, the penetration of inhaled particles into diseased or poorly ventilated regions of the lung is probably superior for nanoparticles of certain sizes to micron-sized particles.
In summary, AiDA has several potential benefits which are still unexplored, and the technique could be a way forward to simplify diagnosis of pulmonary diseases, such as emphysema. Based on the available experimental data and model calculations, the preferable particle size range is likely to be within 40–100 nm. Development of new instruments for rapid and cheap detection of nanoparticles has opened a new window for such studies.
Acknowledgments
This work was financially supported by the Swedish Research Council (VR, grant 621-2011-3560), the ERA-NET project EuroNanoMed2, the Swedish Heart and Lung Foundation, Region Skåne, and the Crafoord Foundation. DMB was funded by the Israel Ministry of Health Chief Scientist Research Fund as part of ERA-NET.
Disclosure
Jakob Löndahl and Per Wollmer have a patent pending named “Device and method for pulmonary function measurement”. The other authors report no conflicts of interest in this work.
References
WHO. Global Surveillance, Prevention and Control of Chronic Respiratory Diseases: A Comprehensive Approach. Geneva: World Health Organization; 2007. | ||
van den Berge M, ten Hacken NH, Cohen J, Douma WR, Postma DS. Small airway disease in asthma and COPD: clinical implications. Chest. 2011;139(2):412–423. | ||
Vestbo J, Hurd SS, Agusti AG, et al. Global strategy for the diagnosis, management, and prevention of chronic obstructive pulmonary disease: GOLD executive summary. Am J Respir Crit Care Med. 2013;187(4):347–365. | ||
Fain SB, Panth SR, Evans MD, et al. Early emphysematous changes in asymptomatic smokers: detection with 3He MR imaging. Radiology. 2006;239(3):875–883. | ||
Shaker SB, Stavngaard T, Hestad M, Bach KS, Tonnesen P, Dirksen A. The extent of emphysema in patients with COPD. Clin Respir J. 2009;3(1):15–21. | ||
Bennett WD, Smaldone GC. Use of aerosols to estimate mean air-space size in chronic obstructive pulmonary disease. J Appl Physiol (1985). 1988;64(4):1554–1560. | ||
Gebhart J, Heyder J, Stahlhofen W. Use of aerosols to estimate pulmonary air-space dimensions. J Appl Physiol Respir Environ Exerc Physiol. 1981;51(2):465–476. | ||
Blanchard JD. Aerosol bolus dispersion and aerosol-derived airway morphometry: assessment of lung pathology and response to therapy, Part 1. J Aerosol Med. 1996;9(2):183–205. | ||
Blanchard JD. Aerosol bolus dispersion and aerosol-derived airway morphometry: assessment of lung pathology and response to therapy, Part 2. J Aerosol Med. 1996;9(4):453–476. | ||
Palmes ED. Use of aerosols to measure pulmonary dimensions. J Air Pollut Control Assoc. 1968;18(10):671. | ||
Palmes ED. Measurement of pulmonary air spaces using aerosols. Arch Intern Med. 1973;131(1):76–79. | ||
Broday DM, Georgopoulos P. Growth and deposition of hygroscopic particulate matter in the human lungs. Aerosol Sci Technol. 2001;34(1):144–159. | ||
Heyder J. Assessment of airway geometry with inert aerosols. J Aerosol Med. 1989;2(2):89–97. | ||
Rosenthal FS. Aerosol recovery following breathholding derived from the distribution of chordlengths in pulmonary tissue. J Aerosol Sci. 1989;20(2):267–277. | ||
Brand P, Beinert T, Fruhmann G, Hillebrecht A, Heyder J. Aerosol derived airway morphometry at different levels of lung inflation. J Aerosol Med. 1993;6(3):165–176. | ||
Blanchard JD, Heyder J, O’Donnell CR, Brain JD. Aerosol-derived lung morphometry: comparisons with a lung model and lung function indexes. J Appl Physiol (1985). 1991;71(4):1216–1224. | ||
Zeman KL, Bennett WD. Measuring alveolar dimensions at total lung capacity by aerosol-derived airway morphometry. J Aerosol Med. 1995;8(2):135–147. | ||
Brand P, Rieger C, Beinert T, Heyder J. Aerosol derived airway morphometry in healthy subjects. Eur Respir J. 1995;8(10):1639–1646. | ||
Hankinson JL, Palmes ED, Lapp NL. Pulmonary air space size in coal miners. Am Rev Respir Dis. 1979;119(3):391–397. | ||
Bennett WD, Smaldone GC. Human variation in the peripheral air-space deposition of inhaled particles. J Appl Physiol (1985). 1987;62(4):1603–1610. | ||
Nikiforov AI, Lippmann M, Palmes ED. Validation of an in vivo aerosol probe technique by measurements of deposition and morphometry in excised human lungs. Ann Occup Hyg. 1988;32(inhaled particles VI):33–39. | ||
Spektor DM, Hunt PR, Rosenthal F, Lippmann M. Influence of airway and airspace sizes on particle deposition in excised donkey lungs. Exp Lung Res. 1985;9(3–4):363–387. | ||
Rahmel A, Schwalen A, Calzia E, Huber A, Schulz H, Meyer M. Aerosol-derived airway dimensions of dog lungs: comparison of bolus and single-breath techniques. Mohr U, Bates DV, Fabel H, Utell MJ, editors. In: Advances in Controlled Clinical Inhalation Studies. Ilsi Monographs. Springer-Verlag, Berlin: 1993:377–386. | ||
Brand P, Selzer T, Tuch T, Schulz A, Heyder J. Accuracy and resolution power of aerosol-derived airway morphometry in a simple lung model. Exp Lung Res. 1994;20(3):185–205. | ||
Zeman KL, Bennett WD. Growth of the small airways and alveoli from childhood to the adult lung measured by aerosol-derived airway morphometry. J Appl Physiol (1985). 2006;100(3):965–971. | ||
Beinert T, Brand P, Behr J, Vogelmeier C, Heyder J. Peripheral airspace dimensions in patients with COPD. Chest. 1995;108(4):998–1003. | ||
Brand P, Kohlhäufl N, Meyer T, Selzer T, Heyder J, Häussinger K. Aerosol-derived airway morphometry and aerosol bolus dispersion in patients with lung fibrosis and lung emphysema. Chest. 1999;116(2):543–548. | ||
Kohlhäufl M, Brand P, Rock C, et al. Noninvasive diagnosis of emphysema. Aerosol morphometry and aerosol bolus dispersion in comparison to HRCT. Am J Respir Crit Care Med. 1999;160(3):913–918. | ||
Lehnigk B, Schleiss M, Brand P, Heyder J, Magnussen H, Jörres RA. Aerosol-derived airway morphometry (ADAM) in patients with lung emphysema diagnosed by computed tomography – reproducibility, diagnostic information and modelling. Eur J Med Res. 2007;12(2):74–83. | ||
Shaker SB, Maltbaek N, Brand P, Haeussermann S, Dirksen A. Quantitative computed tomography and aerosol morphometry in COPD and alpha1-antitrypsin deficiency. Eur Respir J. 2005;25(1):23–30. | ||
Brand P, Letzel S, Buchta M, et al. Can aerosol-derived airway morphometry detect early, asymptomatical lung emphysema? J Aerosol Med. 2003;16(2):143–151. | ||
Lehnigk B, Schleiss M, Bluhme P, et al. Aerosol-derived effective air space diameter (EAD) in different types of emphysema as characterized by computer tomography compared to healthy subjects. J Aerosol Med. 1995;8:126. | ||
Lehnigk B, Schleiss M, Bluhme P, et al. Aerosol derived airway morphometry in emphysema and fibrosis. Am J Respir Crit Care Med. 1995;151:118. | ||
Anderson PJ, Gann LP, Tennal K, Hiller FC. Airway caliber and function in restrictive lung disease. Am Rev Respir Dis. 1993;147(4):A451. | ||
Meyer M, Rahmel AO. Aerosol-derived airway dimensions of dog lungs in histamine-induced bronchoconstriction. J Aerosol Sci. 1993;24(5):671–681. | ||
Rahmel A, Meyer M. Airway dimensions during histamine-induced airway constriction in dogs. Ann Occup Hyg. 1994;38(inhaled particles VII):181–187. | ||
Schiller-Scotland CF, Gebhart J, Lintl H, Siekmeier R, Kronenberger H. Human airway diameters derived from aerosol inhalation studies: reactions of non-smokers and smokers to bronchodilators. J Aerosol Sci. 1989;20(8):1305–1308. | ||
Rosenthal FS. Aerosol deposition and dispersion characterize lung injury in a canine model of emphysema. J Appl Physiol (1985). 1995;78(4):1585–1595. | ||
Schulz H, Schulz A, Brand P, et al. Aerosol bolus dispersion and effective airway diameters in mildly asthmatic children. Eur Respir J. 1995;8(4):566–573. | ||
Broday D. Deposition of ultrafine particles at carinal ridges of the upper bronchial airways. Aerosol Sci Technol. 2004;38(10):991–1000. | ||
Landahl HD. On the removal of air-borne droplets by the human respiratory tract: I. The lung. Bull Math Biophys. 1950;12(1):43–56. | ||
Anderson PJ, Wilson JD, Hiller FC. Respiratory tract deposition of ultrafine particles in subjects with obstructive or restrictive lung disease. Chest. 1990;97(5):1115–1120. | ||
Brown JS, Zeman KL, Bennett WD. Ultrafine particle deposition and clearance in the healthy and obstructed lung. Am J Respir Crit Care Med. 2002;166(9):1240–1247. | ||
Löndahl J, Swietlicki E, Rissler J, et al. Experimental determination of the respiratory tract deposition of diesel combustion particles in patients with chronic obstructive pulmonary disease. Part Fibre Toxicol. 2012;9:30. | ||
Möller W, Felten K, Sommerer K, et al. Deposition, retention, and translocation of ultrafine particles from the central airways and lung periphery. Am J Respir Crit Care Med. 2008;177(4):426–432. | ||
Muala A. Diesel Exhaust and Wood Smoke Exposure: Mechanisms, inflammation and intervention. Umeå: Public Health and Clinical Medicine, Umeå University; 2014. | ||
International Commission on Radiological Protection. Human Respiratory Tract Model for Radiological Protection: A Report of a Task Group of the International Commission on Radiological Protection. Oxford, NY: Pergamon; 1994. | ||
Fazio F, Wollmer P, Lavender JP, Barr MM. Clinical ventilation imaging with In-113m aerosol: a comparison with Kr-81m. J Nucl Med. 1982;23(4):306–314. | ||
Fleming J, Conway J, Majoral C, et al. Controlled, parametric, individualized, 2-D and 3-D imaging measurements of aerosol deposition in the respiratory tract of asthmatic human subjects for model validation. J Aerosol Med Pulm Drug Deliv. 2015;28(6):432–451. | ||
Häussermann S, Acerbi D, Brand P, et al. Lung deposition of formoterol HFA (Atimos/Forair) in healthy volunteers, asthmatic and COPD patients. J Aerosol Med. 2007;20(3):331–341. | ||
Ramanna L, Tashkin DP, Taplin GV, et al. Radioaerosol lung imaging in chronic obstructive pulmonary disease: comparison with pulmonary function tests and roentgenography. Chest. 1975;68(5):634–640. | ||
Sweeney TD, Skornik WA, Brain JD, Hatch V, Godleski JJ. Chronic bronchitis alters the pattern of aerosol deposition in the lung. Am J Respir Crit Care Med. 1995;151(2 Pt 1):482–488. | ||
Taplin GV, Tashkin DP, Chopra SK, et al. Early detection of chronic obstructive pulmonary disease using radionuclide lung-imaging procedures. Chest. 1977;71(5):567–575. | ||
Macey DJ, Marshall R. Absolute quantitation of radiotracer uptake in the lungs using a gamma camera. J Nucl Med. 1982;23(8):731–734. | ||
Kleinstreuer C, Zhang Z. Airflow and particle transport in the human respiratory system. Annu Rev Fluid Mech. 2010;42:301–334. | ||
Rostami AA. Computational modeling of aerosol deposition in respiratory tract: a review. Inhal Toxicol. 2009;21(4):262–290. | ||
Martonen T. Commentary ‘Effects of asymmetric branch flow rates on aerosol deposition in bifurcating airways’, by Z. Zhang, C. Kleinstreuer and C. S. Kim. J Med Eng Technol. 2001;25(3):124–127. | ||
Xi J, Longest PW, Martonen TB. Effects of the laryngeal jet on nano- and microparticle transport and deposition in an approximate model of the upper tracheobronchial airways. J Appl Physiol (1985). 2008;104(6):1761–1777. | ||
Farkas A, Balásházy I. Simulation of the effect of local obstructions and blockage on airflow and aerosol deposition in central human airways. J Aerosol Sci. 2007;38(8):865–884. | ||
Xi J, Longest PW. Effects of oral airway geometry characteristics on the diffusional deposition of inhaled nanoparticles. J Biomech Eng. 2008;130(1):011008. | ||
Zhang Z, Kleinstreuer C, Kim CS. Airflow and nanoparticle deposition in a 16-generation tracheobronchial airway model. Ann Biomed Eng. 2008;36(12):2095–2110. | ||
Zhang Z, Kleinstreuer C, Donohue JF, Kim CS. Comparison of micro- and nano-size particle depositions in a human upper airway model. J Aerosol Sci. 2005;36(2):211–233. | ||
Zhang Z, Kleinstreuer C, Kim CS. Comparison of analytical and CFD models with regard to micron particle deposition in a human 16-generation tracheobronchial airway model. J Aerosol Sci. 2009;40(1):16–28. | ||
Sturm R. Theoretical models for the simulation of particle deposition and tracheobronchial clearance in lungs of patients with chronic bronchitis. Ann Transl Med. 2013;1(1):3. | ||
Sturm R, Hofmann W. Stochastic simulation of alveolar particle deposition in lungs affected by different types of emphysema. J Aerosol Med. 2004;17(4):357–372. | ||
Bennett WD, Zeman KL, Kim C, Mascarella J. Enhanced deposition of fine particles in COPD patients spontaneously breathing at rest. Inhal Toxicol. 1997;9(1):1–14. | ||
Kim CS, Kang TC. Comparative measurement of lung deposition of inhaled fine particles in normal subjects and patients with obstructive airway disease. Am J Respir Crit Care Med. 1997;155(3):899–905. | ||
Kim CS, Lewars GA, Sackner MA. Measurement of total lung aerosol deposition as an index of lung abnormality. J Appl Physiol (1985). 1988;64(4):1527–1536. | ||
Love RG, Muir DC. Aerosol deposition and airway obstruction. Am Rev Respir Dis. 1976;114(5):891–897. | ||
Schiller-Scotland CF, Gebhart J, Hochrainer D, Siekmeier R. Deposition of inspired aerosol particles within the respiratory tract of patients with obstructive lung disease. Toxicol Lett. 1996;88(1–3):255–261. | ||
Hinds WC. Aerosol Technology: Properties, Behavior, and Measurement of Airborne Particles. 2nd ed. John Wiley & Sons, Inc; 1999. | ||
Longest PW, Xi JX. Computational investigation of particle inertia effects on submicron aerosol deposition in the respiratory tract. J Aerosol Sci. 2007;38(1):111–130. | ||
Macintyre N, Crapo RO, Viegi G, et al. Standardisation of the single-breath determination of carbon monoxide uptake in the lung. Eur Respir J. 2005;26(4):720–735. | ||
Grgic B, Martin AR, Finlay WH. The effect of unsteady flow rate increase on in vitro mouth-throat deposition of inhaled boluses. J Aerosol Sci. 2006;37(10):1222–1233. | ||
Smaldone GC. Physiological and pathological considerations for aerosol deposition: expiration and models of deposition. J Aerosol Med. 2000;13(4):387–391. | ||
Bennett WD, Smaldone GC. Inspiratory vs expiratory aerosol deposition in excised dog lungs. J Aerosol Sci. 1987;18(1):49–57. | ||
Price OT, Asgharian B, Miller FJ, Cassee FR, de Winter-Sorkina R. Multiple Path Particle Dosimetry model (MPPD v1.0): a model for human and rat airway particle dosimetry. RIVM rapport 650010030. 2002. | ||
Heyder J. Charting human thoracic airways by aerosols. Clin Phys Physiol Meas. 1983;4(1):29–37. | ||
Palmes ED, Altshuler B, Nelson N. Deposition of aerosols in the human respiratory tract during breath holding. In: Davies CN; British Occupational Hygiene Society. Inhaled Particles and Vapours. 2nd ed. New York, NY: Symposium Publications Division, Pergamon Press; 1967:339–347. | ||
Rosenthal FS. A model for determining alveolar and small airway dimensions from aerosol recovery data. J Appl Physiol (1985). 1985;58(2):582–591. | ||
Heyder J. Gravitational deposition of aerosol particles within a system of randomly oriented tubes. J Aerosol Sci. 1975;6(2):133–137. | ||
Gebhart J, Heyder J. Removal of aerosol particles from stationary air within porous media. J Aerosol Sci. 1985;16(2):175–187. | ||
Goldberg IS, Smith RB. Settling and diffusion of aerosol particles in small airways during breath holding. Ann Biomed Eng. 1981;9(5–6):557–575. | ||
Yu CP, Liu CS, Taulbee DB. Simultaneous diffusion and sedimentation of aerosols in a horizontal cylinder. J Aerosol Sci. 1977;8(5):309–316. | ||
Tsuda A, Henry FS, Butler JP. Particle transport and deposition: basic physics of particle kinetics. Compr Physiol. 2013;3(4):1437–1471. | ||
Hofemeier P, Sznitman J. Revisiting pulmonary acinar particle transport: convection, sedimentation, diffusion, and their interplay. J Appl Physiol (1985). 2015;118(11):1375–1385. | ||
Fishler R, Hofemeier P, Etzion Y, Dubowski Y, Sznitman J. Particle dynamics and deposition in true-scale pulmonary acinar models. Sci Rep. 2015;5:14071. | ||
Sznitman J. Respiratory microflows in the pulmonary acinus. J Biomech. 2013;46(2):284–298. | ||
Johannessen A, Skorge TD, Bottai M, et al. Mortality by level of emphysema and airway wall thickness. Am J Respir Crit Care Med. 2013;187(6):602–608. | ||
Stratelis G, Mölstad S, Jakobsson P, Zetterström O. The impact of repeated spirometry and smoking cessation advice on smokers with mild COPD. Scand J Prim Health Care. 2006;24(3):133–139. | ||
Efferth T, Verdorfer I, Miyachi H, et al. Genomic imbalances in drug-resistant T-cell acute lymphoblastic CEM leukemia cell lines. Blood Cells Mol Dis. 2002;29(1):1–13. | ||
de Lange EE, Mugler JP 3rd, Brookeman JR, et al. Lung air spaces: MR imaging evaluation with hyperpolarized 3He gas. Radiology. 1999;210(3):851–857. | ||
Salerno M, Altes TA, Mugler JP 3rd, Nakatsu M, Hatabu H, de Lange EE. Hyperpolarized noble gas MR imaging of the lung: potential clinical applications. Eur J Radiol. 2001;40(1):33–44. | ||
Mugler JP 3rd, Altes TA. Hyperpolarized 129Xe MRI of the human lung. J Magn Reson Imaging. 2013;37(2):313–331. | ||
Kim CS, Jaques PA. Respiratory dose of inhaled ultrafine particles in healthy adults. Philos Trans A Math Phys Eng Sci. 2000;358(1775):2693–2705. | ||
Landahl HD, Tracewell TN, Lassen WH. On the retention of airborne particulates in the human lung: II. AMA Arch Ind Hyg Occup Med. 1951;3(4):359–366. | ||
Stoeger T, Reinhard C, Takenaka S, et al. Instillation of six different ultrafine carbon particles indicates a surface area threshold dose for acute lung inflammation in mice. Environ Health Perspect. 2006;114(3):328–333. | ||
Jakobsson JKF, Hedlund J, Kumlin J, Wollmer P, Löndahl J. A new method for measuring lung deposition efficiency of airborne nanoparticles in a single breath. Scientific Reports. 2016;6:36147. | ||
Löndahl J, Möller W, Pagels JH, Kreyling WG, Swietlicki E, Schmid O. Measurement techniques for respiratory tract deposition of airborne nanoparticles: a critical review. J Aerosol Med Pulm Drug Deliv. 2014;27(4):229–254. |
 © 2016 The Author(s). This work is published and licensed by Dove Medical Press Limited. The full terms of this license are available at https://www.dovepress.com/terms.php and incorporate the Creative Commons Attribution - Non Commercial (unported, v3.0) License.
By accessing the work you hereby accept the Terms. Non-commercial uses of the work are permitted without any further permission from Dove Medical Press Limited, provided the work is properly attributed. For permission for commercial use of this work, please see paragraphs 4.2 and 5 of our Terms.
© 2016 The Author(s). This work is published and licensed by Dove Medical Press Limited. The full terms of this license are available at https://www.dovepress.com/terms.php and incorporate the Creative Commons Attribution - Non Commercial (unported, v3.0) License.
By accessing the work you hereby accept the Terms. Non-commercial uses of the work are permitted without any further permission from Dove Medical Press Limited, provided the work is properly attributed. For permission for commercial use of this work, please see paragraphs 4.2 and 5 of our Terms.