")
Back to Journals » Pharmacogenomics and Personalized Medicine » Volume 14
DNA Methylation of Fluoxetine Response in Child and Adolescence: Preliminary Results
Authors Martinez-Pinteño A, Rodriguez N, Blázquez A , Plana MT, Varela E, Gassó P, Lafuente A, Lazaro L, Mas S
Received 29 October 2020
Accepted for publication 29 December 2020
Published 19 April 2021 Volume 2021:14 Pages 459—467
DOI https://doi.org/10.2147/PGPM.S289480
Checked for plagiarism Yes
Review by Single anonymous peer review
Peer reviewer comments 2
Editor who approved publication: Dr Martin H Bluth
Albert Martinez-Pinteño,1,* Natalia Rodriguez,1,* Ana Blázquez,2 Maria Teresa Plana,2 Eva Varela,2 Patricia Gassó,1,3 Amalia Lafuente,1,3,4 Luisa Lazaro,2– 5 Sergi Mas1,3,4
1Department of Basic Clinal Practice, Pharmacology Unit, University of Barcelona, Barcelona, Spain; 2Department of Child and Adolescent Psychiatry and Psychology, Institute of Neurosciences, Hospital Clinic de Barcelona, Barcelona, Spain; 3Clinical and Experimental Neuroscience Area, The August Pi i Sunyer Biomedical Research Institute (IDIBAPS), Barcelona, Spain; 4G04 Group, Centro de Investigación Biomédica en Red de Salud Mental (CIBERSAM), Carlos III Health Institute, Madrid, Spain; 5Department of Medicine, University of Barcelona, Barcelona, Spain
*These authors contributed equally to this work
Correspondence: Sergi Mas
Department of Basic Clinal Practice, Pharmacology Unit, University of Barcelona, Casanova 143, Barcelona, E-08036, Spain
Tel +34 934024526
Fax +34 934035881
Email [email protected]
Purpose: The search for predictors of antidepressant response is gaining increasing attention, with epigenetic markers attracting a great deal of interest. We performed a genome-wide study assessing baseline differences in DNA methylation between Responders and Non-Responders.
Patients and Methods: Twenty-two children and adolescents, receiving fluoxetine treatment for the first time, were classified as Responders or Non-Responders according to CGI-I score after 8 weeks of fluoxetine treatment. Genome-wide DNA methylation was profiled using the Illumina Infinium MethylationEPIC BeadChip Kit and analyzed using the Chip Analysis Methylation Pipeline (ChAMP).
Results: We identified 21 CpG sites significantly (FDR< 0.05) associated with fluoxetine response that showed meaningful differences (Δβ> ± 0.2) in methylation level between Responders and Non-Responders. Two genes, RHOJ (Ras Homolog Family Member J) and OR2L13 (Olfactory Receptor family 2 subfamily L member 13), presented more than one significant CpG sites.
Conclusion: Our findings provide new insights into the molecular mechanisms underlying the complex phenotype of antidepressant response, indicating that methylation at specific genes could be a promising biomarker that needs further replication in large cohorts.
Keywords: epigenomics, epigenetics, DNA methylation, pharmacogenetics, antidepressants
Introduction
Antidepressants are a first-line treatment for major depressive disorder (MDD) and are widely prescribed for other conditions, such as obsessive-compulsive disorder (OCD). However, between 40% and 50% of patients on antidepressants do not respond to treatment or relapse.1,2 This individual variability could be due to the complexity of antidepressant response that involves the interplay of both environmental and genetic factors.3 There are currently no specific sociodemographic or clinical markers to predict the response to antidepressants.4
Pharmacogenetic studies have shown that genetic variation influences antidepressant response, but have not fully explained individual variability.5 Recent reports have indicated that the estimates of heritability due to common genetic variants are lower than expected and that significant associations are poorly replicated.6,7 Thus, the search for biomarkers other than genetic factors that predict antidepressant response is gaining increasing attention,3 with epigenetic markers, especially DNA methylation, attracting a lot of interest.8
DNA methylation involves the addition of a methyl group at position 5 of the cytosine pyrimidine ring, a reaction catalyzed by members of the DNA methyltransferase (DNMT) family that usually occurs in cytosine bases that are immediately followed by a guanine (CpG). Large clusters of CpGs, known as CpG islands, occur in promoter regions. With some exceptions, active promoters are generally unmethylated, while inactive promoters tend to be methylated.
Several studies strongly indicate that antidepressants can induce the epigenetic modification of DNMTs, thus altering methylation levels and, subsequently, gene expression. This could explain how antidepressants modulate several molecular mechanisms and significantly affect synaptic plasticity.3,5.
A number of studies have identified epigenetic biomarkers of antidepressant response, with the majority of these studies using a targeted approach to examine a limited number of CpG sites within a specific gene locus. These gene loci include: the brain–derived neurotrophic factor (BDNF);9,10 the sodium-dependent serotonin transporter (SLC6A4);11–13 the serotonin receptor 1B (HTR1B);14,15 and the interleukin 11 gene (IL11).16 Recently, a genome-wide methylation study identified a set of CpG sites in specific genes such as PPFIA4 and HS3ST1 that accurately predicted paroxetine response.17
In the present study, we performed a genome-wide study assessing differences in DNA methylation that were characterized at baseline after 8 weeks of fluoxetine treatment in a homogenous sample of child and adolescent patients receiving fluoxetine for the first time.
Patients and Methods
Subjects
Twenty-two children and adolescents aged between 13 and 17 years, receiving fluoxetine treatment for the first time participated in the present study. None of the participants had been treated previously with antidepressants or other psychotropic drugs. Patients were diagnosed using the Diagnostic and Statistical Manual of Mental Disorders-V (DSM-V).18 The study was carried out at the Child and Adolescent Psychiatry and Psychology Service of the Institute of Neuroscience in Barcelona. Exclusion criteria were comorbidity with other psychiatric disorders, Tourette’s syndrome, autism, somatic or neurological diseases, an intelligence quotient <70, and a non-Caucasian ethnicity. All procedures were approved by the Hospital Clínic ethics committee. Written informed consent was obtained from all the parents and verbal informed consent was given by all the participants following explanation of the procedures involved. All experiments were performed in accordance with relevant guidelines and regulations. This study was conducted in accordance with the Declaration of Helsinki.
Information on illness severity was obtained during the initial phase of the study using the following questionnaires: the Children’s Depression Inventory (CDI) for MDD patients (Kovacs, 1992) and the Children’s Yale-Brown Obsessive Compulsive Scale (CYBOCS) for OCD patients.19,20 The same scales, as well as the CGI-Improvement scale (CGI-I), were administered after 8 weeks of fluoxetine treatment. The clinical response after 8 weeks of fluoxetine treatment was evaluated using the percentage of improvement: ((CDI8weeks-CDIbasal)/CDIbasal)*100 or ((CYBOCS8weeks- CYBOCSbasal)/CYBOCS basal)*100. Patients were classified as Responders or Non-Responders according to CGI-I score after 8 weeks of fluoxetine treatment. The CGI-I scale assesses the adequacy of clinical response since the start of treatment and is rated on a 7-point scale, as follows: 1=very much improved, 2=much improved, 3=minimally improved, 4=no change from baseline, 5=minimally worse, 6=much worse and 7=very much worse. According to this rating, and according to the literature: Responders were patients with CGI-I<2 (Very much improved or much improved) and Non-Responders were patients with CGI-I>3 (from minimally improved to very much worse).
DNA Isolation
A blood sample from each participant was collected in EDTA (BD Vacutainer K2EDTA tubes; Becton Dickinson, Franklin Lakes, New Jersey, USA) before the start of fluoxetine treatment. Genomic DNA was extracted using the MagNA Pure LC DNA Isolation Kit III and a MagNA Pure LC system (Roche Diagnostics GmbH, Mannheim, Germany). DNA concentration and quality were measured using a NanoDrop 2000 spectrophotometer (Thermo Fisher Scientific, Surrey, UK).
Preprocessing DNA Methylation
Genome-wide DNA methylation was profiled using the Illumina Infinium MethylationEPIC BeadChip Kit carried out at CEGEN-PRB3-ISCIII. Raw.IDAT files were received and bioinformatics processes were conducted in house using the Chip Analysis Methylation Pipeline (ChAMP) Bioconductor package.21 Raw intensity data files were used to load the data into the R environment with the champ.load function, which also allows for probe QC and removal steps to occur simultaneously. Probes with low detected signals (p<0.01) (n=3302), cross reactive probes (n= 11), non-CpG probes (n=2954), probes with <3 beads in at least 5% of samples per probe (n=6891), probes that bound to SNP sites (n=96,621), and sex chromosome probes (n=61,734) are all considered problematic for accurate downstream methylation detection. After removing these probes, 739,405 probes remained for downstream analysis. Beta values were then normalized using the champ.norm function, specifically with the beta mixture quartile method (BMIQ function). Cell counts were measured using the champ.refbase function. The following cells were counted: CD8+ T cells, CD4+ T cells, natural killer (NK) cells, B cells, monocytes, and granulocytes. Next, the singular value decomposition (SVD) method was performed by champ.SVD in order to assess the amount and significance of technical batch components, along with any potential confounding variables (sex, age, diagnosis, cell count, fluoxetine dosage), in our dataset. Using the champ.runCombat function, Combat algorithms were applied in order to correct for slide and array as significant components detected by SVD. No effect of sex, age, diagnosis, cell count, or fluoxetine dosage was detected.
Differentially Methylated Positions (DMPs)
After filtering, normalization, and detection of batches and covariates, differentially methylated positions (DMPs) were identified using the function champ.DMP, which implements the limma package to calculate the p-value for differential methylation using a linear model. The absolute value of the difference between β-value medians (Δβ) of Responders and Non-Responders higher than 0.2 was set as a cut-off value to decrease the number of significant CpGs and identify sites with more biologically relevant methylation differences. Hierarchical cluster analysis of significant DMP was plotted as a heatmap and a dendrogram using the gplot and d3heatmap R packages.
Results
Table 1 shows the sociodemographic and clinical data of the 22 participants of this study classified as Responders or Non-Responders according to the CGI-I scale after 8 weeks of fluoxetine treatment. No significant differences in age, sex, BMI, fluoxetine dose or basal clinical scores were observed between the two groups.
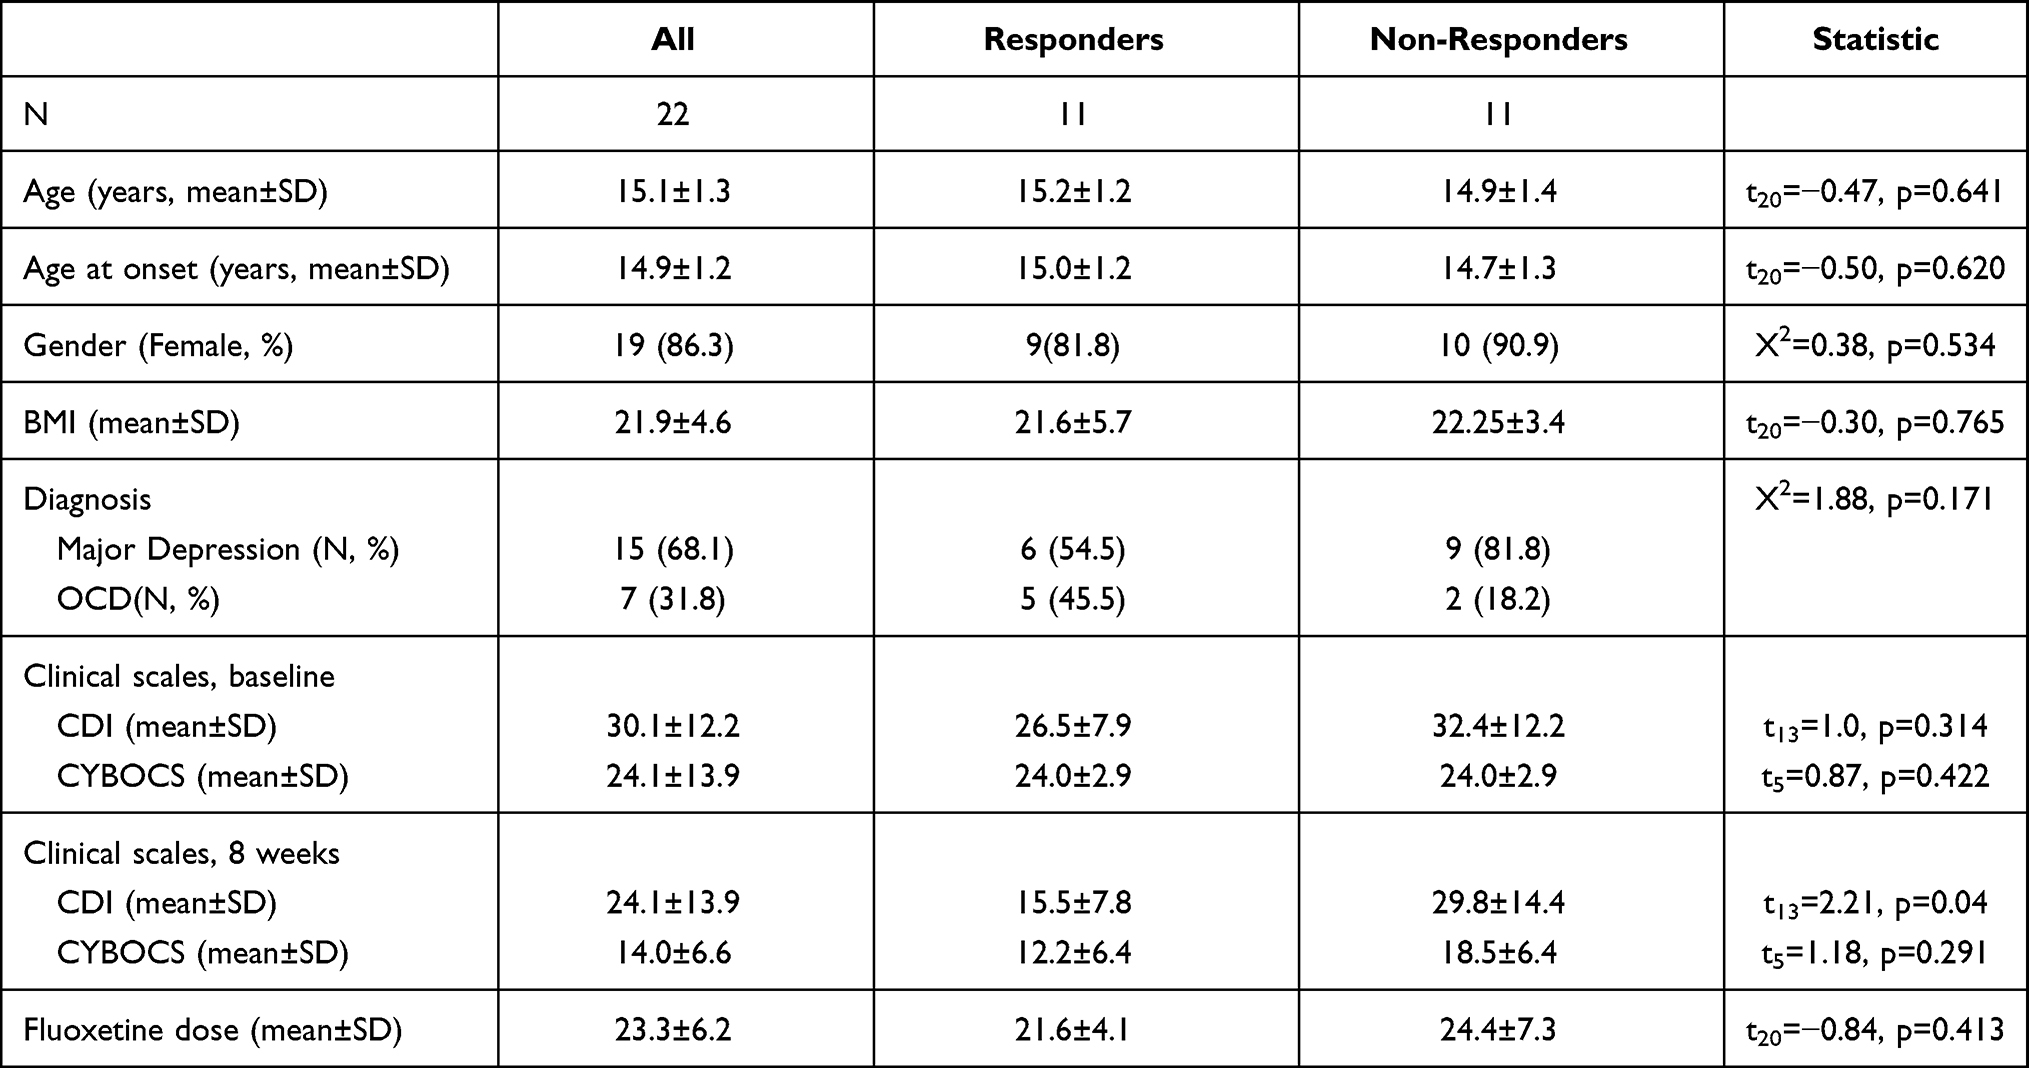 |
Table 1 Sociodemographic, Clinical and Pharmacological Data of the 22 Study Participants |
We classified 47,690 probes as significant DMPs (adjusted p-values FDR<0.05): however, this included DMPs with very small differences in methylation between Responders and Non-Responders. Therefore, a Δβ> ±0.2 cutoff was applied to identify 21 DMPs with methylation changes that are more likely to be biologically relevant (Table 2).
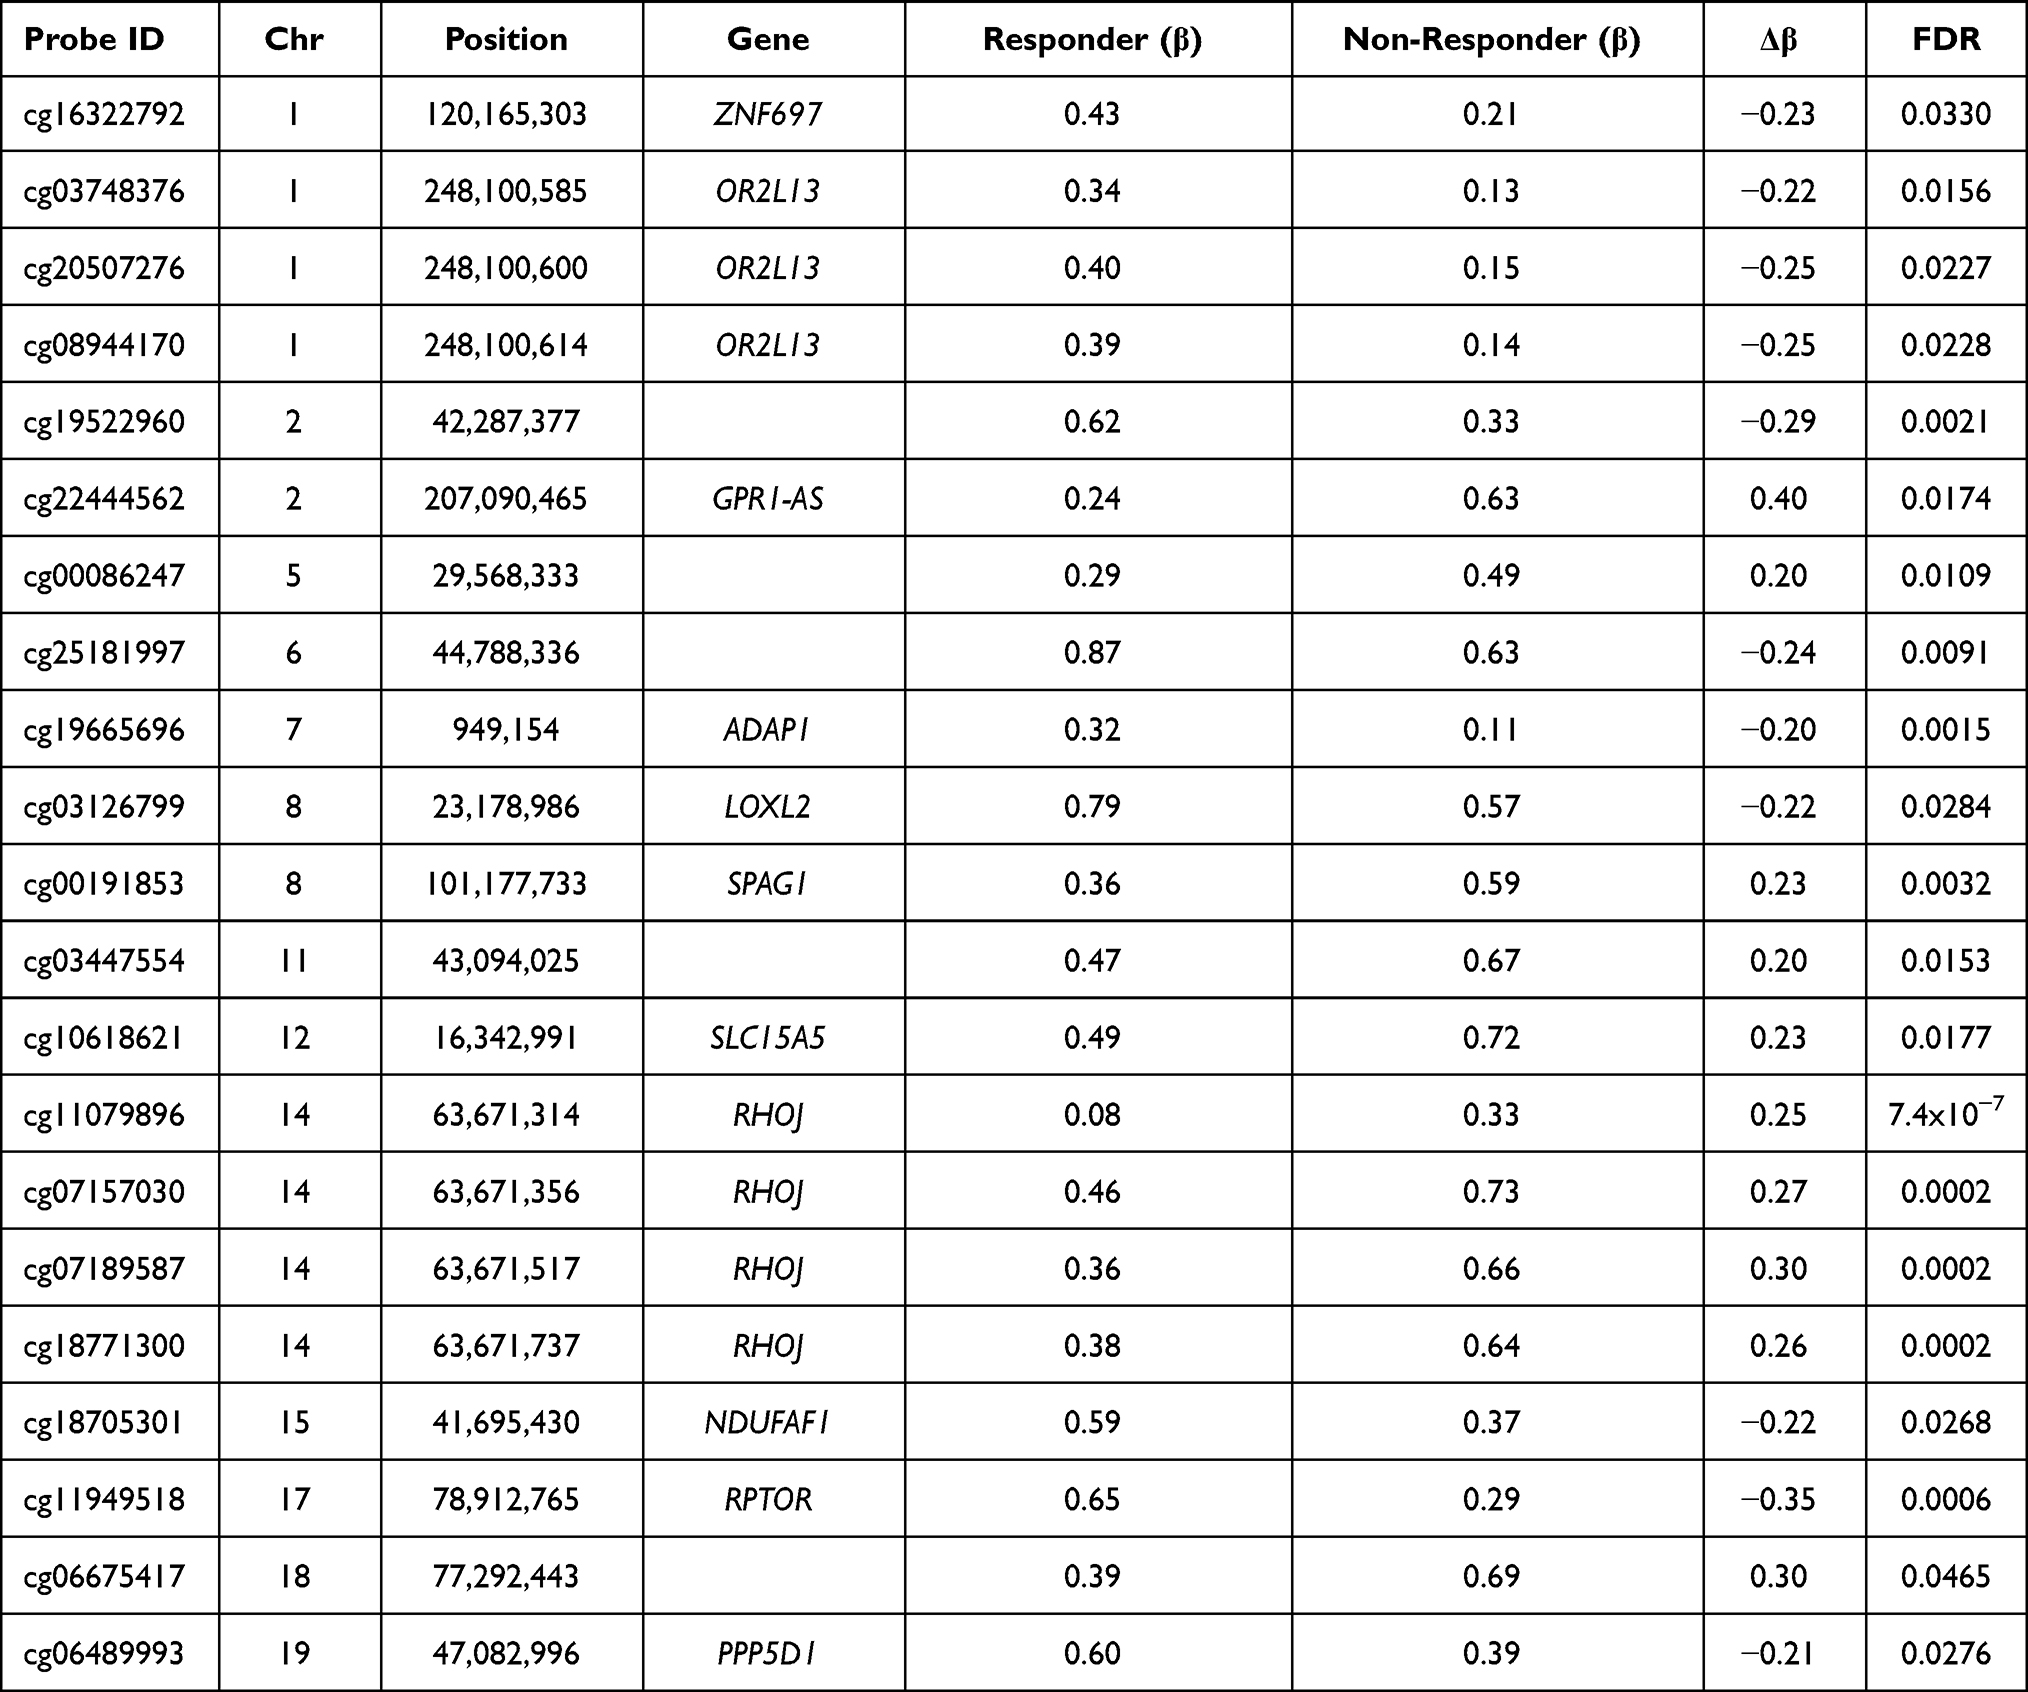 |
Table 2 21 Significant (FDR<0.05, Δβ> ±0.2) Differentially Methylated Probes (DMPs) Between Responders and Non-Responders |
We assessed the distribution of these 21 DMPs and the other probes in the array in relation to genomic regulatory elements and CpG islands. The genomic regulatory elements considered were the first exon, 3ʹUTR, 5ʹUTR, the gene body, and promoter-proximal regions (TSS1500 and TSS200). Hypermethylated probes in Responders were enriched in the first exon (27% vs 0.025% of all probes) and hypomethylated probes were enriched in the 5ʹUTR (30% vs 0.08% of all probes) (Figure 1A). Regarding the CpG islands, we differentiated between CpG islands, shores (2 kbp from a CpG site), shelves (2 to 4 kbp from a CpG site) and open sea CpGs (isolated CpG in the genome). Hypermethylated probes in Responders were enriched in CpG islands (45% vs 18%) and hypomethylated probes were enriched in open sea CPGs (90% vs 58%) (Figure 1B).
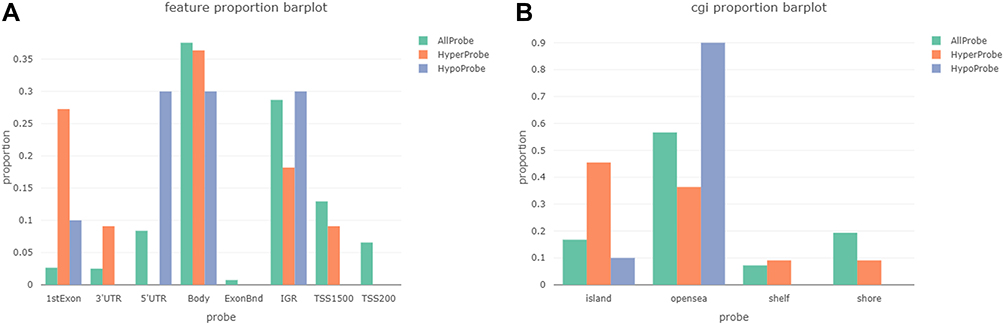 |
Figure 1 (A) Distribution of 21 significant (FDR<0.05, Δβ> ±0.2) DMPs and the rest of the probes of the array relative to regulatory elements including transcription start sites (TSS1500, and TSS200), gene body, untranscribed regions (3ʹUTR and 5ʹUTR) and first exon. (B) Distribution of DMPs and the rest of the probes of the array relative to CpG islands, shores, shelves, and sea. |
The 21 significant CpGs mapped to 11 genes (RHOJ, RPTOR, ADAP1, SPAG1, GPR1-AS, SLC15A5, OR2L13, NDUFAF1, PPP5D1, LOX2 and ZNF697) and five intergenic regions. Two genes showed more than two significant DMPs (FDR<0.05, Δβ> ±0.2) (Figure 2A). RHOJ (Ras Homolog Family Member J) presented four CpGs that were significantly hypermethylated in Non-Responders. These CpGs were in the 5ʹ-UTR and first exon of the gene, a region that, according to the UCSF browser, includes a promoter region enriched with H3K27AC marks in all cell lines considered by ENCODE (Figure 2B). Two of these CpGs (cg18771300 and cg07157030) were included in The Blood-Brain Epigenetic Concordance database (BECon; https://redgar598.shinyapps.io/BECon/)22 and showed significant correlation between methylation levels in blood and Brodmann Area 10 (BA10) and Brodmann Area 20 (BA20) (r>0.66). Both CpGs were highly variable in the blood (reference range>0.1) and fitted with the definition of a blood–brain informative CpG in the BECon.
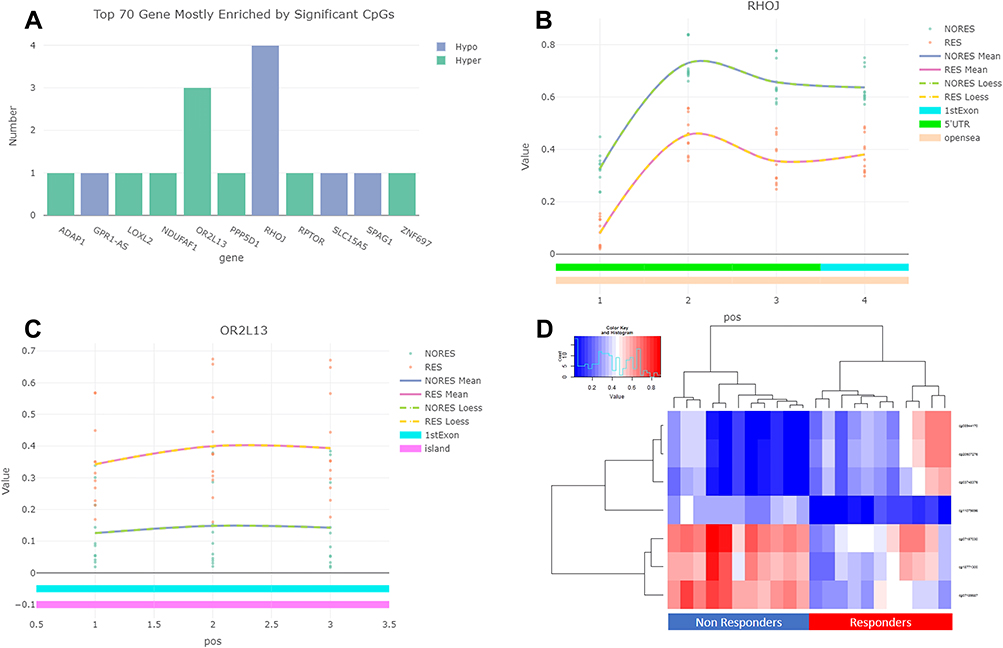 |
Figure 2 (A) Genes most enriched by the 21 significant DMPs (FDR<0.05, Δβ> ±0.2). (B) Distribution of significant DMPs (FDR<0.05, Δβ> ±0.2) in the RHOJ (Ras Homolog Family Member J) gene, and methylation β values in Responders (RES) and Non-Responders (NORES). (C) Distribution of significant DMPs (FDR<0.05, Δβ> ±0.2) in the OR2L13 (Olfactory Receptor family 2 subfamily L member 13) gene and methylation β values in Responders and Non-Responders. (D) Hierarchical cluster analysis of the seven CpG sites in the RHOJ (Ras Homolog Family Member J) and OR2L13 (Olfactory Receptor family 2 subfamily L member 13) genes. |
OR2L13 (Olfactory Receptor family 2 subfamily L member 13) presented three CpGs that were significantly hypomethylated in Non-Responders, located on a large CpG island in the first exon of the gene (Figure 2C). According to the BECon database, the three CpGs showed significant correlations between methylation levels in blood and the BA10, BA20 and BA7 areas (r>0.5) and were also highly variable in blood and could be considered blood–brain informative CpGs.
As a sensitivity analysis, we tested the correlations between the methylation level of the seven CpG sites in the RHOJ (Ras Homolog Family Member J) and OR2L13 (Olfactory Receptor family 2 subfamily L member 13) genes and the percentage of improvement scored using the CDI or the CYBOCS. Significant correlations were obtained in all cases: cg03748376 (r=0.55, p=0.008), cg20507276 (r=0.54, p=0.010), cg08944170 (r=0.54, p=0.010), cg11079896 (r=−0.44, p=0.038), cg07157030 (r=−0.49, p=0.021), cg07189587 (r=−0.48, p=0.024) and cg18771300 (r=−0.43, p=0.045).
We conducted a hierarchical cluster analysis of the seven sites in these two genes RHOJ (Ras Homolog Family Member J) and OR2L13 (Olfactory Receptor family 2 subfamily L member 13). The results were expressed as a heat map indicating the methylation level at each CpG, and as a dendrogram (Figure 2D). The dendrogram clearly indicated that Responders and Non-Responders differed from each other.
Discussion
To our knowledge, the present study is the first to analyze differences in DNA methylation in association with response to fluoxetine in the peripheral blood of children and adolescents using a genome-wide approach. We identified 21 CpG sites significantly (FDR<0.05) associated with fluoxetine response that showed meaningful differences (Δβ> ±0.2) in methylation level between Responders and Non-Responders. Two genes, RHOJ and OR2L13, were enriched in significant CpG sites that showed a strong correlation in DNA methylation between the blood and brain (The Blood-Brain Epigenetic Concordance database BECon; https://redgar598.shinyapps.io/BECon/).
RHOJ (Ras Homolog Family Member J) is a member of the Cdc42 subfamily of the Rho family of GTPases, a group of small signaling molecules that are major regulators of cytoskeleton properties.23 Rho GTPases are involved in various cellular processes, including adhesion, cell polarization, motility and transformation, gene activation and vesicular trafficking, and have been associated with cytoskeletal organization and the regulation of axon outgrowth.24 Early studies suggested that RhoJ plays a role in modulating the formation of distinct cytoskeletal structures and lamellipodia as well as in actin filaments.25 Also, RhoJ has been shown to regulate the early endocytic pathway, being necessary for the transport of endocytosed receptors.26 Recently, the crp–1 gene in Caenorhabditis elegans that encodes a protein that resembles human RhoJ has been linked to axon guidance and neuronal migration.27
OR2L13 (Olfactory Receptor family 2 subfamily L member 13) is responsible for the initialization of the neuronal response to odorants.28 Differential DNA methylation in a CpG site of this gene has been identified in multiple independent studies examining epigenetic modification in neurodevelopmental disorders.29 The CpG of interest in these studies (cg20507276) was also identified in the current study.
Our hierarchical cluster analysis indicated that methylation sites in RHOJ (Ras Homolog Family Member J) and OR2L13 (Olfactory Receptor family 2 subfamily L member 13) could be important for explaining interindividual differences in fluoxetine response. However, experimental research is needed to confirm that the methylation of these genes plays an important role in the pharmacological effect of fluoxetine and to elucidate their involvement in the mechanism of action of antidepressant drugs.
The significant CpGs identified in relation to fluoxetine in our analysis also mapped to other genes. There is some connection with neuronal physiology or pathological mechanisms of neuropsychiatric disorders for some of these genes, including ADAP1 (Stricker and Reiser, 2014), SPAG1, SLC15A5 and RPTOR.30–33 For the other genes (GPR1-AS, NDUFAF1, PPP5D1, LOX2 and ZNF697) or intergenic regions identified we have little or no information about their physiological connection with the pharmacological effect of fluoxetine or their role in the pathophysiology of neuropsychiatric disorders.
To our knowledge, this study is the first genome-wide DNA methylation study of fluoxetine response in children and adolescents. The major strength of our study was that several potential confounders were controlled for, such as age, smoking status, pharmacological treatment and the course of the disease. Our sample contained children and adolescents of similar ages who had not previously been treated with antidepressants or other psychotropic drugs and who were at the initial stages of the illness. We also controlled for blood cell composition, as DNA methylation is cell-type specific and different cell compositions between samples could affect the methylation data obtained.
However, the findings of this study should be interpreted by bearing in mind several important limitations. The sample size limited the statistical power of the study and made it difficult to detect small or modest effects on DNA methylation. Given that the study was hypothesis-driven and due to the small sample size, our results should be seen as preliminary and should be considered as exploratory findings that require further confirmation. Our study had several limitations. We used peripheral blood even though DNA methylation is known to be tissue-specific. However, blood is considered to be a useful proxy for detecting changes across tissues and is the most appropriate tissue in which to look for biomarkers. Moreover, there is a moderate correlation between blood and the brain for non-specific regulatory regions across the methylome.22 Third, the observation period was eight weeks, which could not be enough to detect long-term epigenetic changes. Finally, our study included patients with different diagnoses, MDD and OCD. For this reason, in the primary analysis, Responders and Non-Responders were defined according to the CGI-I scale. However, the sensitivity analysis, replacing the dichotomous classification of patients according to the CGI by the symptom’s improvement scored using the CDI and the CYBOCS, confirms our significant findings.
In conclusion, our findings provide new insights into the molecular mechanisms underlying the complex phenotype of antidepressant response and suggest that methylation at specific genes, such as (RHOJ and OR2L13) could become potential biomarkers for predicting antidepressant response. However, the replication of our results in large samples is necessary in order to include the methylation level of these specific genes as biomarkers to develop predictors for clinical applications.
Acknowledgments
The authors thank the Language Advisory Service at the University of Barcelona for manuscript revision. The authors also thank all subjects and their families for the time and effort spent on this study.
Author Contributions
Rodriguez N and Martínez-Pinteño A participated carrying out the experimental procedures, performing the bioinformatic analyses and the interpretation of results and wrote the first draft of the manuscript.
Gassó P helped in performing the statistical analyses and the interpretation of results and helped in drafting the manuscript.
Blázquez A, Varela E and Plana MT participated in the recruitment and assessment of the sample and helped in drafting the manuscript.
Lazaro L participated in the coordination of the recruitment and assessment of the sample, the maintenance of the database, acquisition of funding, and helped in drafting the manuscript.
Lafuente A participated in helping in conceiving, designing and coordinating the whole study, interpreting the results and drafting the manuscript.
Mas S conceived and designed the whole study and participated in performing the statistical analysis, interpretation of results and wrote the first draft of the manuscript.
All authors made substantial contributions to conception and design, acquisition of data, or analysis and interpretation of data; took part in drafting the article or revising it critically for important intellectual content; agreed to submit to the current journal; gave final approval for the version to be published; and agree to be accountable for all aspects of the work.
Funding
This work was supported by the Alicia Koplowitz Foundation; Ministerio de Economía y Competitividad-Instituto de Salud Carlos III-Fondo Europeo de Desarrollo Regional (FEDER)-Unión Europea (PI16/01086). Support was also given by the CERCA Programme/the Government of Catalonia, Secretaria d’Universitats i Recerca del Departament d’Economia i Coneixement to the “Child Psychiatry and Psychology Group” (2017SGR881) and to the “Clinical Pharmacology and Pharmacogenetics Group” (2017SGR1562). Funding sources had no further role in study design; in the collection, analysis and interpretation of data; in the writing of the report; and in the decision to submit the paper for publication.
Disclosure
Dr Natalia Rodriguez reports grants from Alicia Koplowitz Foundation, Ministerio de Economía y Competitividad-Instituto de Salud Carlos III-Fondo Europeo de Desarrollo Regional (FEDER)- Unión Europea, and non-financial support from CERCA Programme/the Government of Catalonia, Secretaria d’Universitats i Recerca del Departament d’Economia i Coneixement, during the conduct of the study. The authors reported no other potential conflicts of interest for this work.
References
1. Rush AJ, Trivedi MH, Wisniewski SR, et al. Acute and longer-term outcomes in depressed outpatients requiring one or several treatment steps: a STAR*D report. Am J Psychiatry. 2006;163:1905–1917. doi:10.1176/ajp.2006.163.11.1905
2. Mrazek DA, Biernacka JM, McAlpine DE, et al. Treatment outcomes of depression: the pharmacogenomic research network antidepressant medication pharmacogenomic study. J Clin Psychopharmacol. 2014;34:313–317. doi:10.1097/JCP.0000000000000099
3. Belzeaux R, Lin R, Ju C, et al. Transcriptomic and epigenomic biomarkers of antidepressant response. J Affect Disord. 2018;233:36–44. doi:10.1016/j.jad.2017.08.087
4. Gadad BS, Jha MK, Czysz A, et al. Peripheral biomarkers of major depression and antidepressant treatment response: current knowledge and future outlooks. J Affect Disord. 2018;233:3–14. doi:10.1016/j.jad.2017.07.001
5. Fabbri C, Serretti A. Clinical application of antidepressant pharmacogenetics: considerations for the design of future studies. Neurosci Lett. 2018;726. doi:10.1016/j.neulet.2018.06.020.
6. Fabbri C, Tansey KE, Perlis RH, et al. New insights into the pharmacogenomics of antidepressant response from the GENDEP and STAR*D studies: rare variant analysis and high-density imputation. Pharmacogenomics J. 2018;18:413–421. doi:10.1038/tpj.2017.44
7. Uher R, Tansey KE, Henigsberg N; GENDEP Investigators, MARS Investigators, STAR*D Investigators. Common genetic variation and antidepressant efficacy in major depressive disorder: a meta-analysis of three genome-wide pharmacogenetic studies. Am J Psychiatry. 2013;170:207–217. doi:10.1176/appi.ajp.2012.12020237
8. Lisoway AJ, Zai CC, Tiwari AK, Kennedy JL. DNA methylation and clinical response to antidepressant medication in major depressive disorder: a review and recommendations. Neurosci Lett. 2018;669:14–23. doi:10.1016/j.neulet.2016.12.071
9. Tadić A, Müller-Engling L, Schlicht KF, et al. Methylation of the promoter of brain-derived neurotrophic factor exon IV and antidepressant response in major depression. Mol Psychiatry. 2014;19:281–283. doi:10.1038/mp.2013.58
10. Wang P, Zhang C, Lv Q, et al. Association of DNA methylation in BDNF with escitalopram treatment response in depressed Chinese Han patients. Eur J Clin Pharmacol. 2018;74:1011–1020. doi:10.1007/s00228-018-2463-z
11. Domschke K, Tidow N, Schwarte K, et al. Serotonin transporter gene hypomethylation predicts impaired antidepressant treatment response. Int J Neuropsychopharmacol. 2014;17:1167–1176. doi:10.1017/S146114571400039X
12. Kang HJ, Kim JM, Stewart R, et al. Association of SLC6A4 methylation with early adversity, characteristics and outcomes in depression. Prog Neuropsychopharmacol Biol Psychiatry. 2013;44:23–28. doi:10.1016/j.pnpbp.2013.01.006
13. Okada S, Morinobu S, Fuchikami M, et al. The potential of SLC6A4 gene methylation analysis for the diagnosis and treatment of major depression. J Psychiatr Res. 2014;53:47–53. doi:10.1016/j.jpsychires.2014.02.002
14. Wang P, Lv Q, Mao Y, et al. HTR1A/1B DNA methylation may predict escitalopram treatment response in depressed Chinese Han patients. J Affect Disord. 2018;228:222–228. doi:10.1016/j.jad.2017.12.010
15. Gassó P, Rodríguez N, Blázquez A, et al. Epigenetic and genetic variants in the HTR1B gene and clinical improvement in children and adolescents treated with fluoxetine. Prog Neuropsychopharmacol Biol Psychiatry. 2017;75:28–34. doi:10.1016/j.pnpbp.2016.12.003
16. Powell TR, Smith RG, Hackinger S. Hackinger Set al. DNA methylation in interleukin-11 predicts clinical response to antidepressants in GENDEP. Transl Psychiatry. 2013;3:e300. doi:10.1038/tp.2013.73
17. Takeuchi N, Nonen S, Kato M, et al. Therapeutic response to paroxetine in major depressive disorder predicted by DNA methylation. Neuropsychobiology. 2017;75:81–88. doi:10.1159/000480512
18. American Psychiatric Association. Diagnostic and Statistical Manual of Mental Disorders.
19. Kovacs M. Children’s Depression Inventory Manual. New York, NY: Multi Health Systems; 1992.
20. Scahill L, Riddle MA, McSwiggin-Hardin M, et al. Children’s yale-brown obsessive compulsive scale: reliability and validity. J Am Acad Child Adolesc Psychiatry. 1997;36:844–852. doi:10.1097/00004583-199706000-00023
21. Tian Y, Morris TJ, Webster AP, et al. ChAMP: updated methylation analysis pipeline for Illumina BeadChips. Bioinformatics. 2017;33:3982–3984. doi:10.1093/bioinformatics/btx513
22. Edgar RD, Jones MJ, Meaney MJ, Turecki G, Kobor MS. BECon: a tool for interpreting DNA methylation findings from blood in the context of brain. Transl Psychiatry. 2017;7:e1187. doi:10.1038/tp.2017.171
23. Etienne-Manneville S, Hall A. Rho GTPases in cell biology. Nature. 2002;420:629–635. doi:10.1038/nature01148
24. Azzarelli R, Kerloch T, Pacary E. Regulation of cerebral cortex development by Rho GTPases: insights from in vivo studies. Front Cell Neurosci. 2015;8:445. doi:10.3389/fncel.2014.00445
25. Shi TT, Li G, Xiao HT. The role of RhoJ in endothelial cell biology and tumor pathology. Biomed Res Int. 2016;6386412. doi:10.1155/2016/6386412
26. de Toledo M, Senic-Matuglia F, Salamero J, et al. The GTP/GDP cycling of rho GTPase TCL is an essential regulator of the early endocytic pathway. Mol Biol Cell. 2003;14:4846–4856. doi:10.1091/mbc.e03-04-0254
27. Alan JK, Robinson SK, Magsig KL, Demarco RS, Lundquist EA. The atypical Rho GTPase CHW-1 works with SAX-3/robo to mediate axon guidance in Caenorhabditis elegans. G3 (Bethesda). 2018;8:1885–1895. doi:10.1534/g3.118.200148
28. Berko ER, Suzuki M, Beren F, et al. Mosaic epigenetic dysregulation of ectodermal cells in autism spectrum disorder. PLoS Genet. 2014;10:e1004402. doi:10.1371/journal.pgen.1004402
29. Dall’Aglio L, Muka T, Cecil CAM, et al. The role of epigenetic modifications in neurodevelopmental disorders: a systematic review. Neurosci Biobehav Rev. 2018;94:17–30. doi:10.1016/j.neubiorev.2018.07.011
30. Stricker R, Reiser G. Functions of the neuron-specific protein ADAP1 (centaurin-α1) in neuronal differentiation and neurodegenerative diseases, with an overview of structural and biochemical properties of ADAP1. Biol Chem. 2014;395:1321–1340. doi:10.1515/hsz-2014-0107
31. Chatterton Z, Hartley BJ, Seok MH, et al. In utero exposure to maternal smoking is associated with DNA methylation alterations and reduced neuronal content in the developing fetal brain. Epigenetics Chromatin. 2017;10:4. doi:10.1186/s13072-017-0111-y
32. Maul S, Giegling I, Fabbri C, Corponi F, Serretti A, Rujescu D. Genetics of resilience: implications from genome-wide association studies and candidate genes of the stress response system in posttraumatic stress disorder and depression. Am J Med Genet B Neuropsychiatr Genet. 2020;183:77–94. doi:10.1002/ajmg.b.32763
33. Kosillo P, Doig NM, Ahmed KM, et al. Tsc1-mTORC1 signaling controls striatal dopamine release and cognitive flexibility. Nat Commun. 2019;10:5426. doi:10.1038/s41467-019-13396-8
 © 2021 The Author(s). This work is published and licensed by Dove Medical Press Limited. The full terms of this license are available at https://www.dovepress.com/terms.php and incorporate the Creative Commons Attribution - Non Commercial (unported, v3.0) License.
By accessing the work you hereby accept the Terms. Non-commercial uses of the work are permitted without any further permission from Dove Medical Press Limited, provided the work is properly attributed. For permission for commercial use of this work, please see paragraphs 4.2 and 5 of our Terms.
© 2021 The Author(s). This work is published and licensed by Dove Medical Press Limited. The full terms of this license are available at https://www.dovepress.com/terms.php and incorporate the Creative Commons Attribution - Non Commercial (unported, v3.0) License.
By accessing the work you hereby accept the Terms. Non-commercial uses of the work are permitted without any further permission from Dove Medical Press Limited, provided the work is properly attributed. For permission for commercial use of this work, please see paragraphs 4.2 and 5 of our Terms.