")
Back to Journals » Clinical Ophthalmology » Volume 13
Diurnal Stability Of Peripapillary Vessel Density And Nerve Fiber Layer Thickness On Optical Coherence Tomography Angiography In Healthy, Ocular Hypertension And Glaucoma Eyes
Authors Bochicchio S, Milani P , Urbini LE, Bulone E, Carmassi L, Fratantonio E, Castegna G, Scotti L, Zambon A, Bergamini F
Received 8 May 2019
Accepted for publication 31 July 2019
Published 20 September 2019 Volume 2019:13 Pages 1823—1832
DOI https://doi.org/10.2147/OPTH.S214877
Checked for plagiarism Yes
Review by Single anonymous peer review
Peer reviewer comments 2
Editor who approved publication: Dr Scott Fraser
Sara Bochicchio,1 Paolo Milani,1 Lara Enrica Urbini,1 Ennio Bulone,1 Luciana Carmassi,1 Elena Fratantonio,1 Giacomo Castegna,1 Lorenza Scotti,2 Antonella Zambon,2 Fulvio Bergamini1
1Ophthalmology Department, Istituto Auxologico Italiano, Milan, Italy; 2Statistics and Quantitative Methods Department, University of Milano-Bicocca, Milan, Italy
Correspondence: Paolo Milani
Istituto Auxologico Italiano, Via Mercalli 30, Milan, Italy
Tel +39 2 3385840232
Fax +39 2 20422262
Email [email protected]
Purpose: By using optical coherence tomography angiography (OCTA), to evaluate diurnal changes of the following parameters: vessel density in the peripapillary area (PP-VD) and in the optic nerve head (ONH-VD); thickness of retinal nerve fibre layer (RNFL) and ganglion cell complex (GCC).
Methods: All prospectively enrolled participants were imaged on the same day at 8 am and 7 pm by means of the XR Avanti device with AngioVue and AngioAnalytics software (Optovue Inc., Fremont, CA, USA). Only eyes with correct automatic segmentation and good-quality images (scan quality > 7/10) were included.
Results: Forty-six eyes from 28 patients with glaucoma, 53 from 31 patients with ocular hypertension, and 62 from 38 controls were assessed. The mean measurements of all parameters investigated were significantly different in the morning and in the evening values in all three groups, with lower values in glaucomatous eyes (p<0.014). In control eyes, as well as in eyes of patients with ocular hypertension and glaucoma the daily changes were minimal and not statistically significant with means of +0.17%, −0.31% and −0.54% for ONH-VD (p=0.83) and means of +0.2%, +0.1% and +0.29% for PP-VD (p=0.83), respectively. Likewise, daily fluctuations in GCC and RNFL thickness were not significant in any of the three groups, with means of +0.16 μm, +0.66 μm and −0.15 μm for GCC (p=0.58) and means of +0.24 μm, +0.58 μm and −0.24 μm for ONH-RNFL (p=0.90), respectively. Systemic hypertension, age, axial length, daily changes in intraocular pressure or scan quality did not correlate with daily fluctuations of any of the parameters investigated (p>0.1).
Conclusion: Vessel density, GCC and RNFL were stable during daytime thus corroborating the clinical relevance of OCTA regardless the time of acquisition.
Keywords: glaucoma, optical coherence tomography angiography, vessel density, daily fluctuations, retinal fiber layer
Introduction
Glaucoma is a complex and multifactorial disease that involves loss of neural tissue, activation of glial cells, tissue remodeling and changes in blood flow. There is mounting evidence that vascular factors are involved, and ocular blood flow reduction probably plays a role in the pathogenesis of the optic nerve neuropathy associated with glaucoma.1,2
In recent years the use of optical coherence tomography angiography (OCTA) has become common in clinical practice, and it has exhibited good sensitivity and reproducibility in studies of retinal and papillary microcirculation without the intravenous injection of dye. Commercially available OCTA devices use different types of algorithms and technology and can yield elaborate quantitative maps of vascular density (VD) and thickness of the retinal area under investigation.3 It has been suggested that tissue microvascular perfusion may be related to VD as measured by OCTA. Some evidence of reduced perfusion in the superficial optic nerve head (ONH) and peripapillary retina of individuals with primary open-angle glaucoma has been reported.4–8 However, quantitative diurnal fluctuations have not been thoroughly investigated. As with the blood perfusion of other vascular regions such as the limbs, brain and digestive system9 it is likely that ocular vascularization is affected by a circadian rhythm or is variably influenced by several factors. Although these effects may be temporary, understanding the alterations in optic nerve perfusion and in thickness of retinal nerve fibre layers (RNFL) or ganglionar cell complex (GCC) warrants further investigation, and may help clarify the aspects of glaucoma onset or progression.
The current study aimed to evaluate quantitative diurnal fluctuations in peripapillary and ONH vessel density, and in RNFL and GCC thickness in three groups: a group of patients with glaucoma; a group of patients with ocular hypertension; a control group. Relationships of these fluctuations with intraocular pressure (IOP) changes, axial length, systemic hypertension, and age were also investigated.
Methods
Study Population
Twenty-eight patients with glaucoma, 31 with ocular hypertension without visual field deterioration, and 38 healthy controls were recruited prospectively from January 2018 to November 2018 by the Department of Ophthalmology of the IRCCS Auxologico Institute, Milan, Italy. The study was approved by the relevant institutional review board of the IRCSS Auxologico Institute and it was conducted in accordance with the Declaration of Helsinki. Informed written consent was acquired from each patient.
The following additional inclusion criteria were applied in the glaucoma group: IOP ≥ 21 mmHg on three consecutive visits prior to IOP-lowering topical treatment, Repeatable glaucomatous visual field damage defined as a glaucoma hemi field test (GHT) outside normal limits and a pattern standard deviation outside 95% normal limits; glaucomatous visual field abnormalities defined by a cluster of +3 adjacent points in the pattern deviation plot with a probability of < 5% including at least 1 point with a probability < 1% in at least two repeatable and consecutive standard automated perimetry tests.
The following additional inclusion criteria were applied in the ocular hypertension group: IOP ≥ 21 mmHg on three consecutive visits prior to IOP-lowering topical treatment, normal-appearing optic disc and intact neuroretinal rim on clinical examination defined as a vertical cup-to-disc ratio < 0.5 and a vertical cup disc ratio asymmetry ≤ 0.2 with a minor vertical cup disc ratio ≤ 0.4, at least two normal visual fields defined as a pattern standard deviation within 95% confidence limits and a GHT result within normal limits, and average and quadrant RNFL thicknesses within respective confidence limits of 95% and 99%.
The control group consisted of individuals without ocular hypertension, presenting the following characteristics:: IOP < 21 mmHg without therapy, no history of elevated IOP, normal-appearing optic disc and intact neuroretinal rim on clinical examination defined as a vertical cup-to-disc ratio < 0.5 and a vertical cup disc ratio asymmetry ≤ 0.2 with a minor vertical cup disc ratio ≤ 0.4, normal visual fields defined as a pattern standard deviation within 95% confidence limits and a GHT result within normal limits, and average and quadrant RNFL thicknesses within respective confidence limits of 95% and 99%.
The presence of systemic hypertension, cardiovascular diseases, and other diseases was recorded but not considered as exclusion criteria in any group. On the contrary, patients with diabetes were excluded.
Study Design And Imaging Acquisition
All study participants underwent a complete ophthalmologic examination including best-corrected visual acuity measurement, slit-lamp biomicroscopy, IOP measurement with Goldmann applanation tonometry at the same day at 8 a.m. and 7 p.m., ultrasound pachymetry, gonioscopy, and dilated fundus examination. The axial length was measured in every eye using an IOL master 500 system (Carl Zeiss Jena, Germany). Participants also underwent standard automated perimetry tests (24-2 Swedish Interactive Threshold Algorithm; Humphrey Field Analyser II; Carl Zeiss Meditec, Inc., Dublin, CA, USA) and OCTA. The OCTA system used was the XR Avanti device with AngioVue and AngioAnalytics (software version 2017.1.0.150, Optovue Inc., Fremont, CA, USA), which enables visualization of the retinal and papillary circulation by means of a split-spectrum amplitude decorrelation angiography algorithm. The instrument has an A-scan rate of 70,000 per second, using a light source centred on 840 nm.
The following three scan acquisition protocols were used at 8 a.m. and 7 p.m.:
- The HD Angio Disc 4.5 x 4.5 micrometers acquisition consists of two orthogonal OCTA volumes centered on the ONH and containing 400x400 scans to perform motion correction and minimize motion artifacts arising from microsaccades and fixation changes. Vascularity data are automatically converted to a VD map, where VD is calculated as the percentage area occupied by blood vessels. The percentage is provided and calculated automatically for the whole enface image (W-VD), for the optic disc only (ONH-VD) and for the peripapillary region defined as a 750-μm-wide elliptical annulus extending from the optic disc boundary (PP-VD) and divided in the hemi-superior (PPHalfSup-VD) and hemi-inferior (PPHalfInf-VD) sectors. Eight sub-sectors of the peripapillary area are also calculated; the nasal-superior (PPNS-VD), nasal-inferior (PPNI-VD), inferior-nasal (PPIN-VD), inferior-temporal (PPIT-VD), temporal-inferior (PPTI-VD), temporal-superior (PPTS-VD), superior-temporal (PPST-VD) and superior-nasal (PPSN-VD) sub-sectors. The map obtained refers to the superficial capillary plexus of the ONH, which is also known as radial peripapillary capillary segmentation. It extends from the ILM to the outer limit of the RNFL and is composed of the vasculature of the RNFL and GCC layer.
- The macula scanning protocol was used to measure the GCC (i.e. the combined thickness of the RNFL, ganglion cell layer, and IPL) thickness. The centre of the GCC scan is automatically shifted 0.75 mm temporally to improve sampling of the temporal periphery. The resulting map shows the averaged thickness in micrometres of the whole W-GCC and of the hemi-superior (HalfSup-GCC) and hemi-inferior sector (HalfInf-GCC).
- To measure the RNFL thickness the standard glaucoma protocol was used with ONH map acquisition. The map is centred on the ONH along a circle of 3.45 mm in diameter and provides measurements in micrometres of RNFL for the whole, averaged ONH (ONH-RNFL) and for each of the 8 corresponding sub-sectors; the nasal-superior (NU-RNFL), nasal-lower (NL-RNFL), inferior-nasal (IN-RNFL), inferior-temporal (IT-RNFL), temporal-lower (TL-RNFL), temporal-upper (TU-RNFL), superior-temporal (ST-RNFL) and superior-nasal (SN-RNFL) sub-sectors. The hemi-superior (HalfSup-RNFL) and hemi-inferior (HalfInf-RNFL) RNFL thicknesses are also calculated automatically.
Only eyes with correct automatic segmentation and disc margin location as controlled by the authors were included in the study. Only good-quality images—defined by scans with scan quality > 7/10 (and without artefacts)—were included.
Statistical Analysis
Continuous variables are reported as means and standard deviations (SDs) or median and interquartile range (IQR) if variables are not normally distribute; categorical variables are reported as frequencies and percentages. The chi squared test was used to evaluate associations between patient-level categorical variables (systemic hypertension and sex) and group (healthy, ocular hypertension and glaucoma); age effects were assessed via analysis of variance (ANOVA); the change in intraocular pressure were assessed using a repeated measure ANOVA and the scan quality using the Kruskall-Wallis test
Three multivariate repeated measures ANOVA with an unstructured covariance matrix were applied to evaluate the differences in VD, GCC and RNFL thickness parameters means between groups accounting for the correlation between measure on eyes within the same patients. The response variables were the measurement of the ocular parameters in the morning, in the evening and the daily change whereas the independent variables were the group, systemic hypertension, age, axial length, daily changes in intraocular pressure and the scan quality. Tukey’s post-hoc test was applied to pairwise comparisons between groups only for ocular parameter where a statistical difference between groups was found. Given the large number of tests performed, false discovery rate (FDR) adjustment was applied to the ANOVA test to account for the inflation of type I error due to multiple tests.
The analyses were performed using SAS (SAS Institute, Cary, NC USA), all tests were two tailed, and a p-value ≤0.05 was considered statistically significant.
Results
Forty-six eyes from 28 patients with glaucoma (mean age 59.54 ± 7 years), 53 eyes from 31 patients with ocular hypertension (mean age 60 ± 7 years) and 62 eyes from 38 controls (mean age 57 ± 6 years) were included in this study. Nineteen patients were excluded because of the poor quality of the images. There were no significant differences in age, gender, axial length, best-corrected visual acuity, refractive status or presence of systemic hypertension among the three groups (Table 1, p>0.14). There was a significant difference pertaining to IOP (p<0.0001), which did not change significantly throughout the day (p=0.59). Forty-three eyes (26 patients) were taken topical prostaglandins, 34 eyes (21 patients) topical betablockers, 17 eyes (10 patients) carbonic anhydrase inhibitors and 4 eyes (two patients) brimonidine.
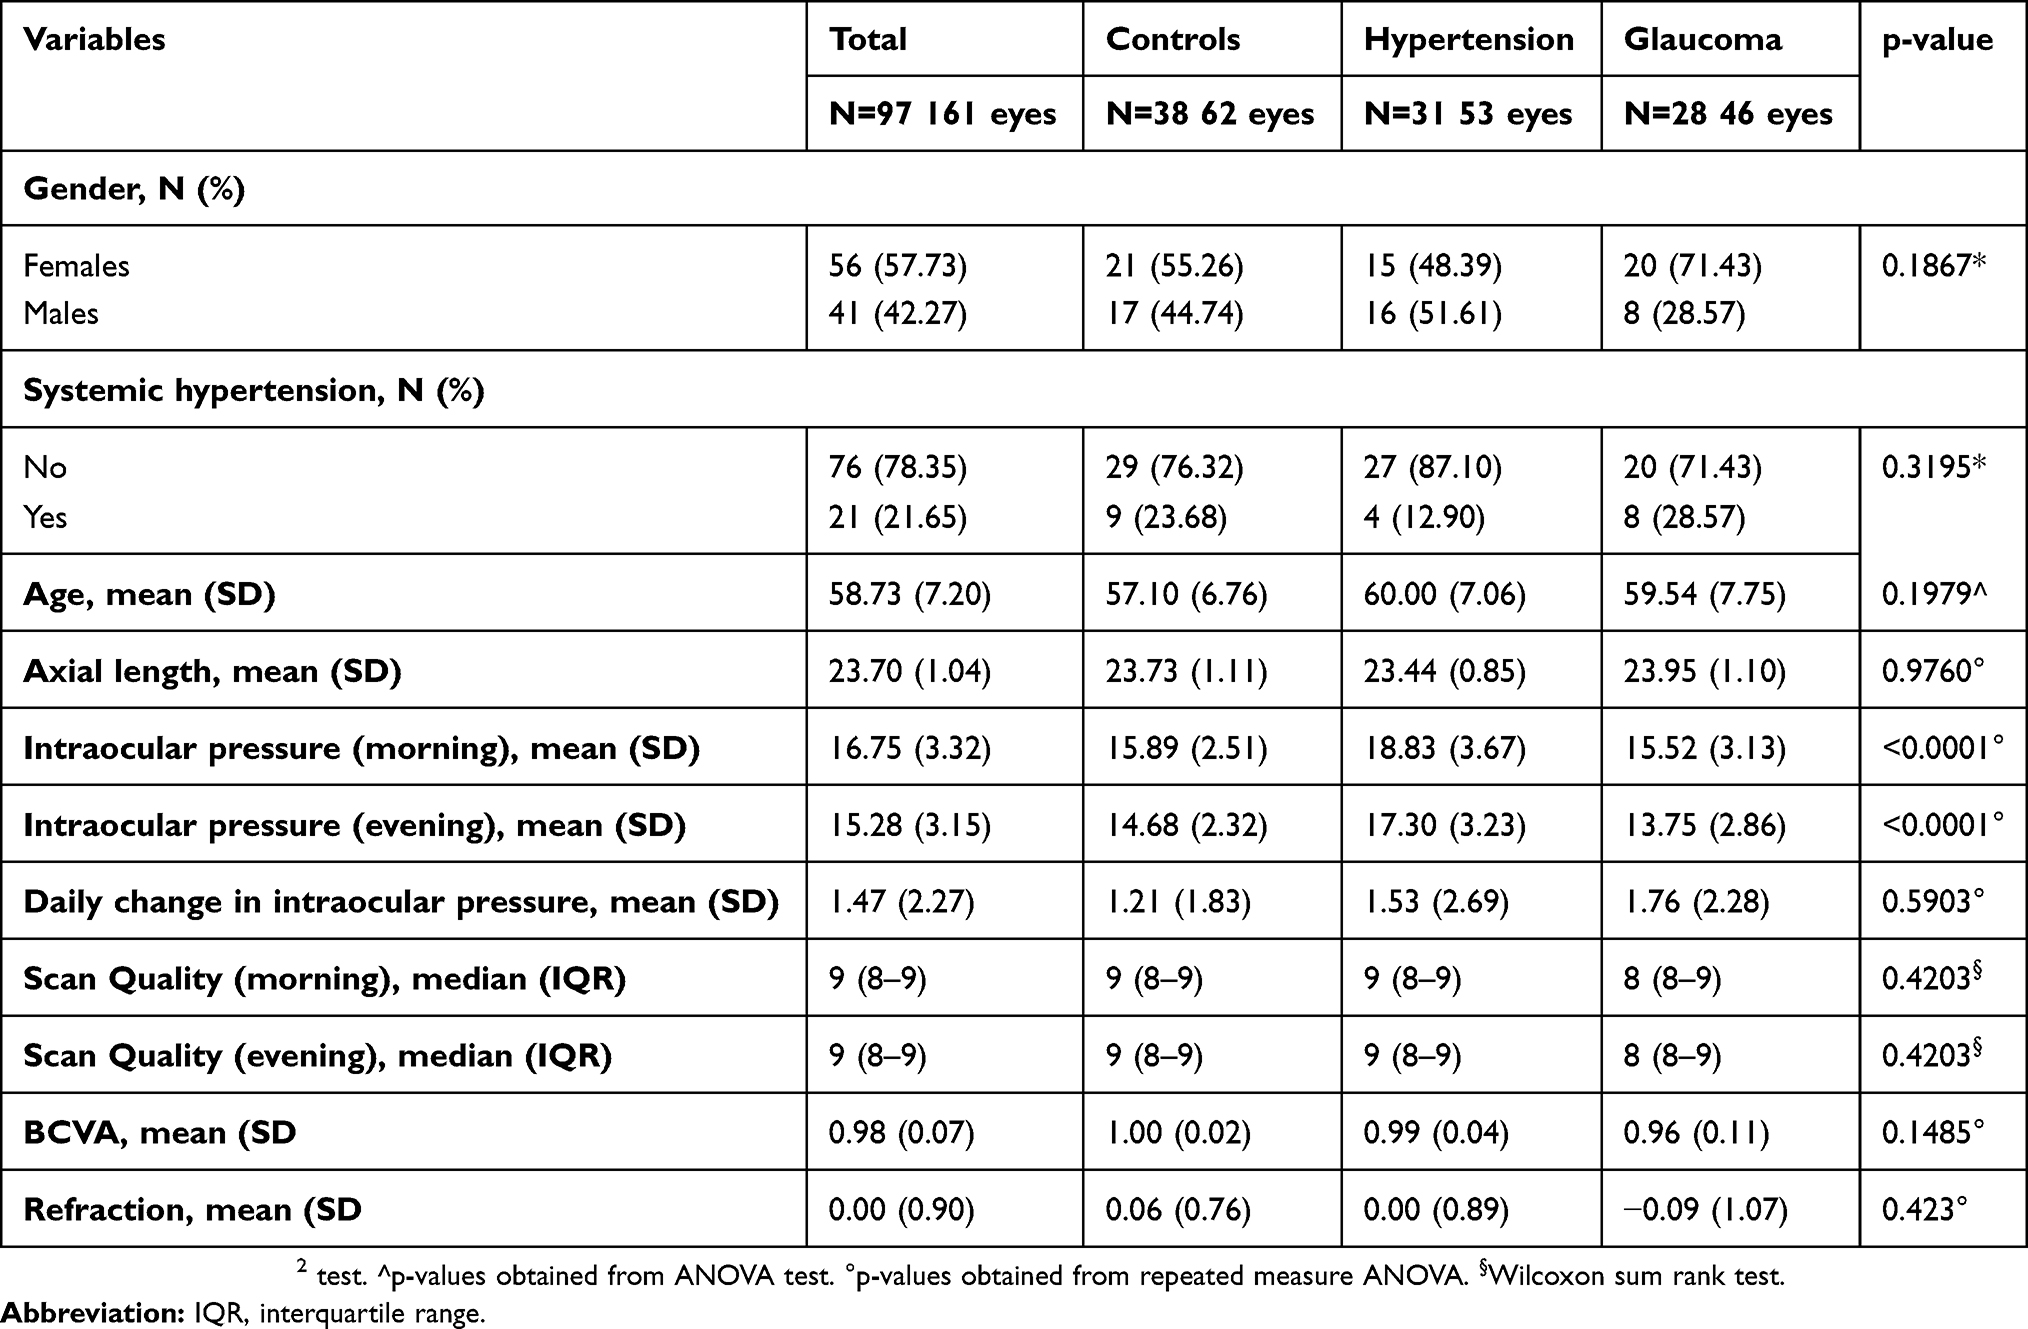 |
Table 1 Demographic and Clinical Characteristics of the Patients Included in the Study |
The mean measurements of all the parameters investigated were statistically different in the three groups in the morning and in the evening (p<0.014, Table 2).
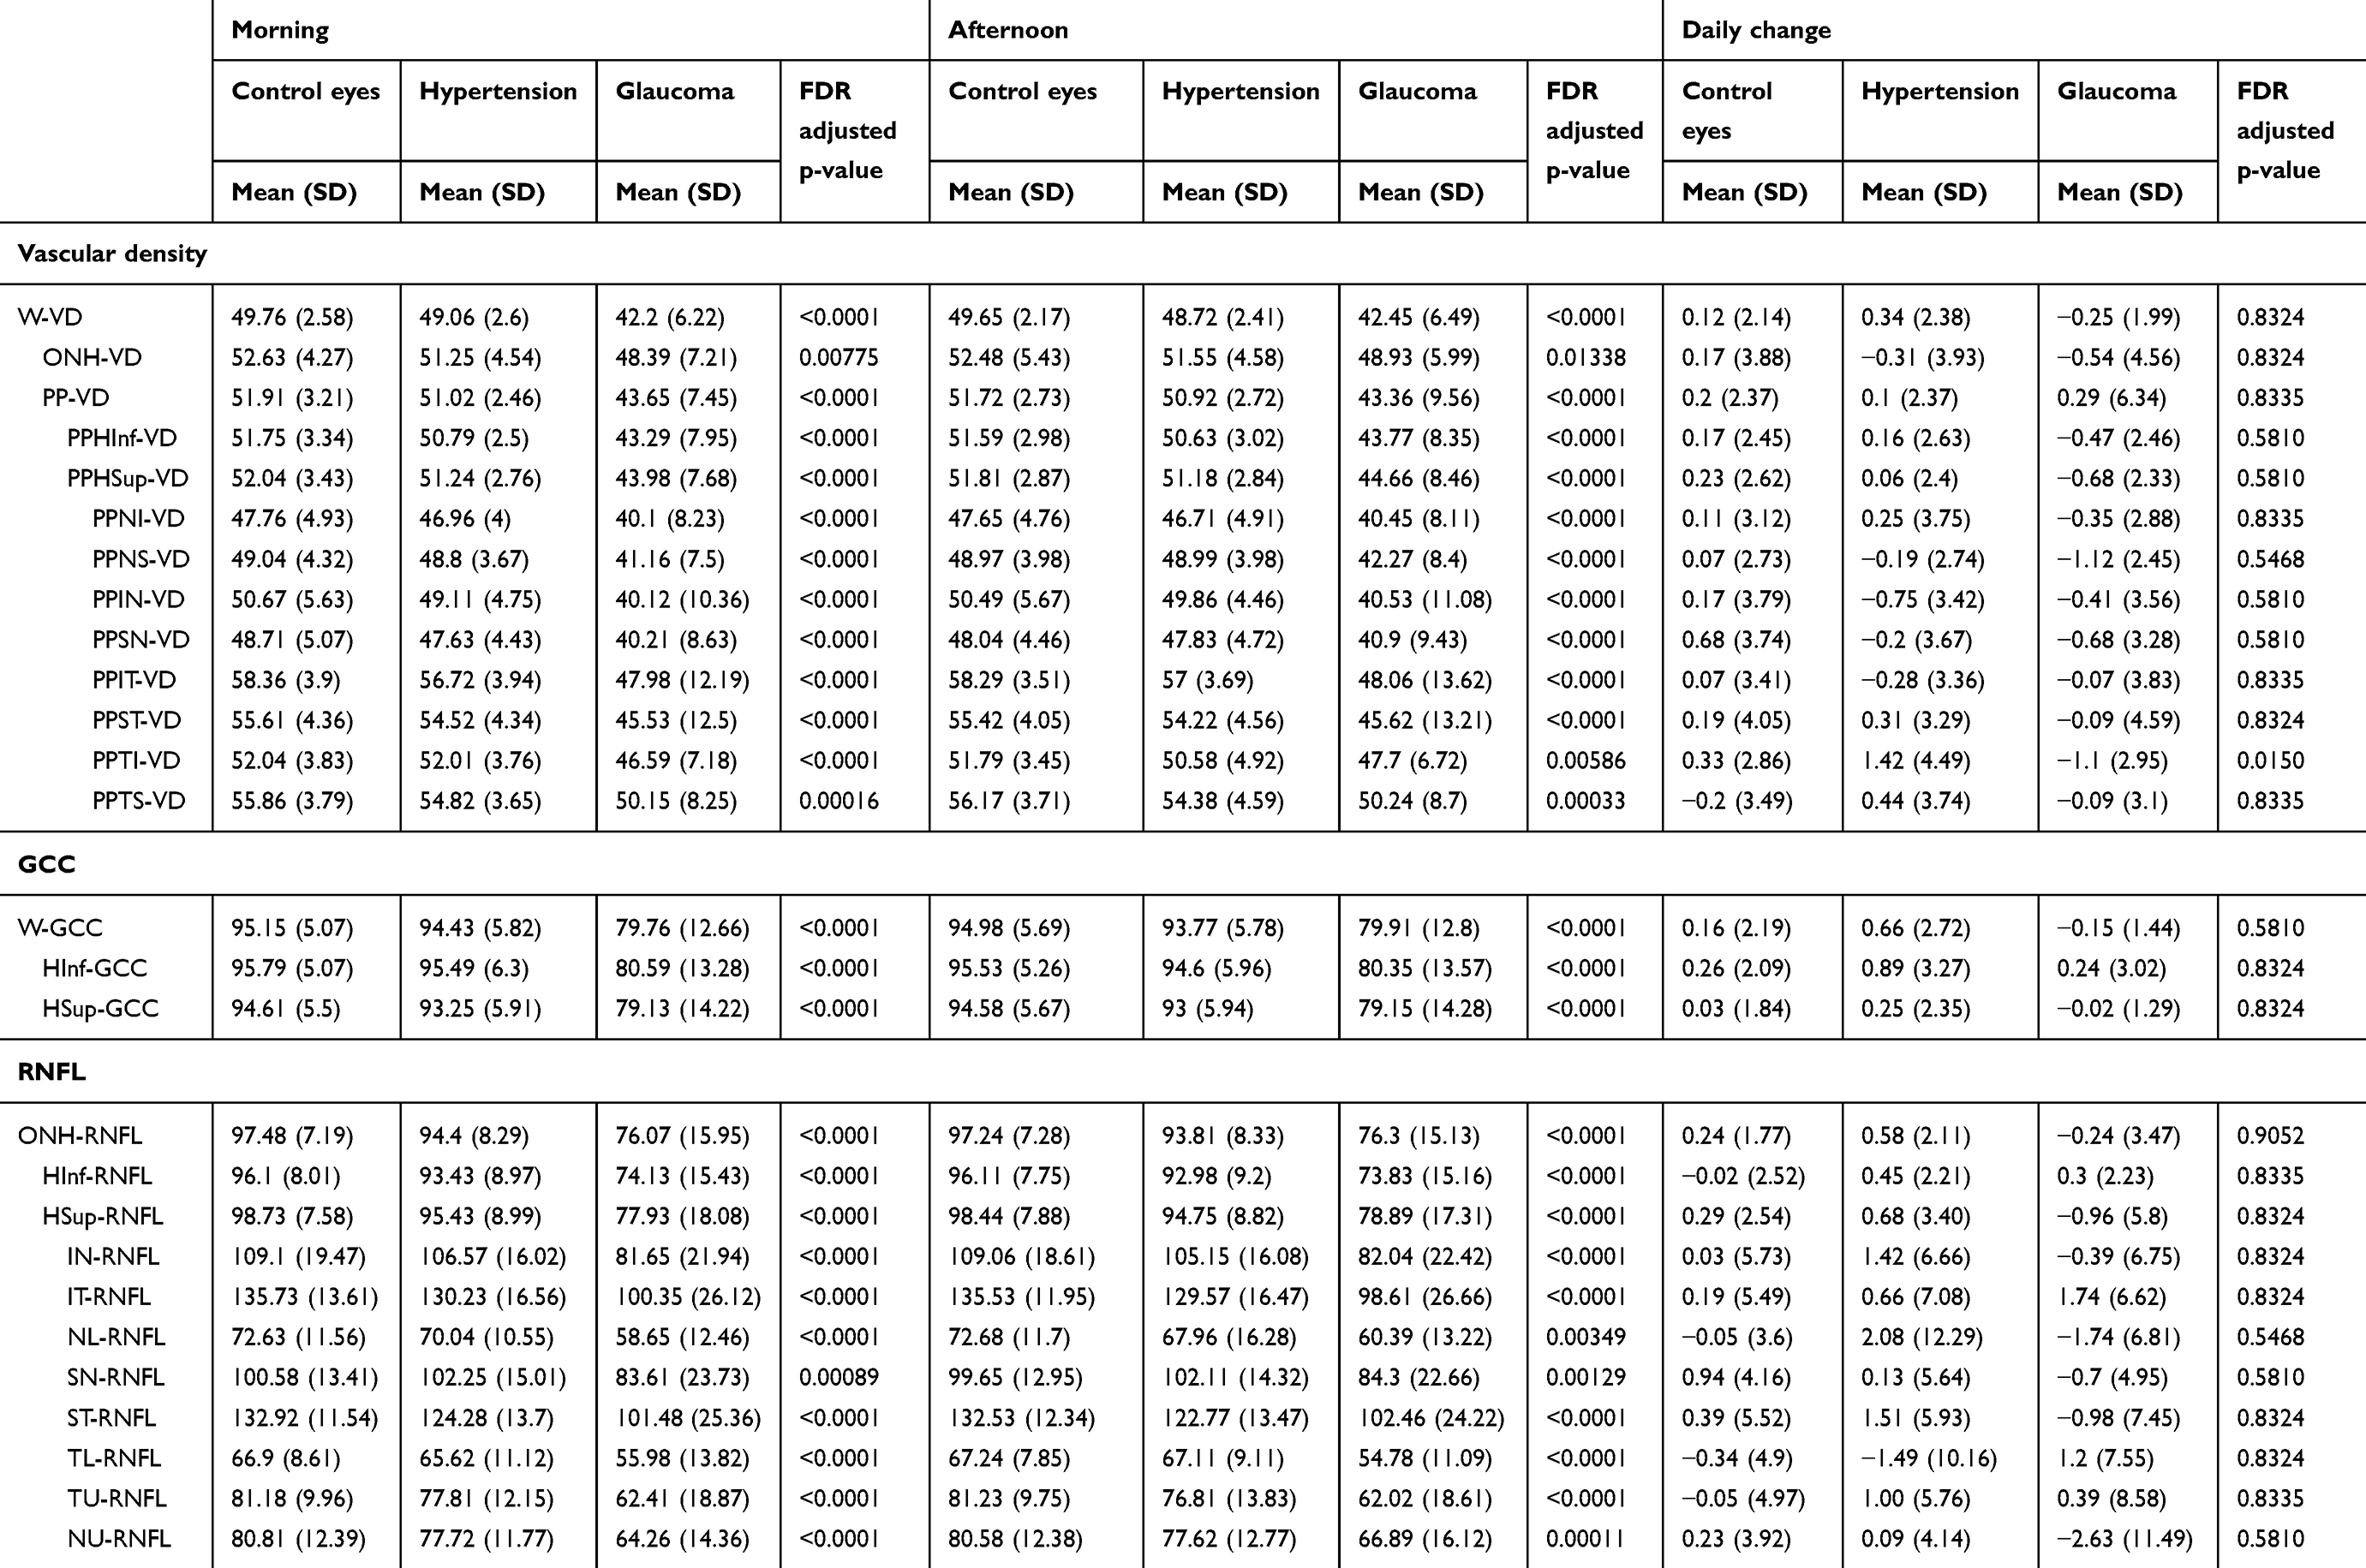 |
Table 2 Means and Corresponding Standard Deviations (SD) of All Ocular Parameters Measured in the Morining and in the Evening with Respective Meand Daily Changes in the Three Groups of Patients. False Discovery Rate (FDR) Adjusted P-value Ot the ANOVA Test are Shown. The Mean Measurements of All the Parameters Investigated Were Statistically Different in the Three Groups in the Morning and in the Evening. Mean Daily Changes Were Minimal and Not Statistically Significant |
In control eyes, eyes with ocular hypertension and eyes with glaucoma the percentages of daily changes were minimal and not statistically significant, with respective means of +0.12%, +0.34% and −0.25% for W-VD (Table 2, FDR-adjusted p = 0.83); +0.17%, −0.31% and −0.54% for ONH-VD (FDR-adjusted p = 0.83); +0.2%, +0.1% and +0.29% for PP-VD (FDR-adjusted p = 0.83). Daily fluctuations in GCC and RNFL thickness were not significant too in any of the three groups, with respective means of +0.16 µm, +0.66 µm and −0.15 µm for GCC (Table 2, FDR-adjusted p = 0.58) and +0.24 µm, +0.58 µm and −0.24 µm for ONH-RNFL (FDR-adjusted p = 0.91).
None of the parameter investigated changed significantly in the group by group analysis or when the total sample was considered (Table 3, p > 0.15).
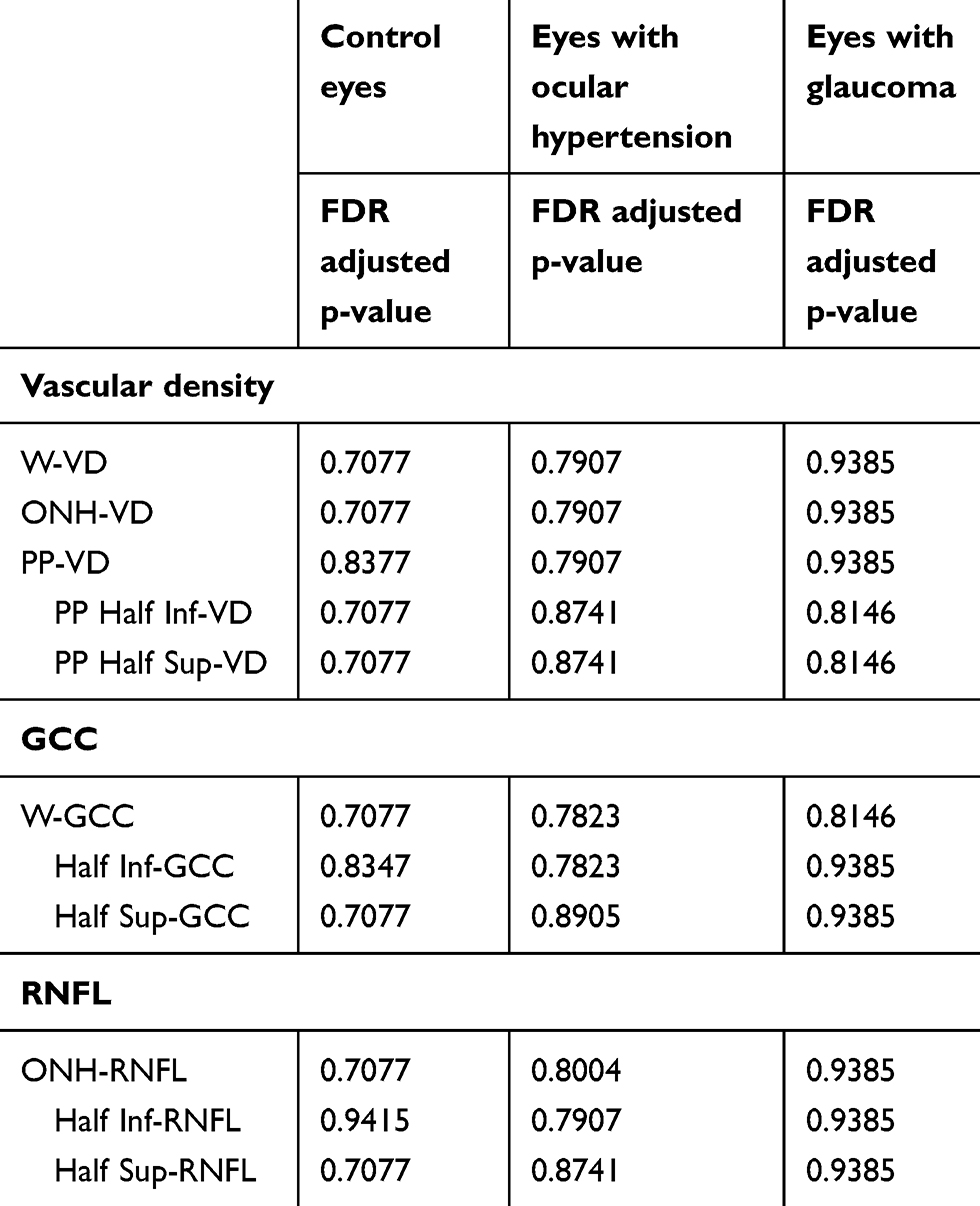 |
Table 3 The T-test Derived P-value Adjusted for Multiplicity Using the False Discovery Rate (FDR) Method. Daily Fluctuations Were Not Statistically Different in Any of the Parameters Investigated within the Groups and in the Total Sample. Only main parameters are indicated. |
In the group to group comparison, the post-hoc Tukey’s tests showed a statistically significant difference for every parameter investigated between eyes with glaucoma and control eyes or eyes with ocular hypertension (Table 4, p<0.008), except for ONH-VD and NL-RNFL in the evening (p>0.08). Comparisons between eyes with ocular hypertension and control eyes were not statistically significant (p>0.17).
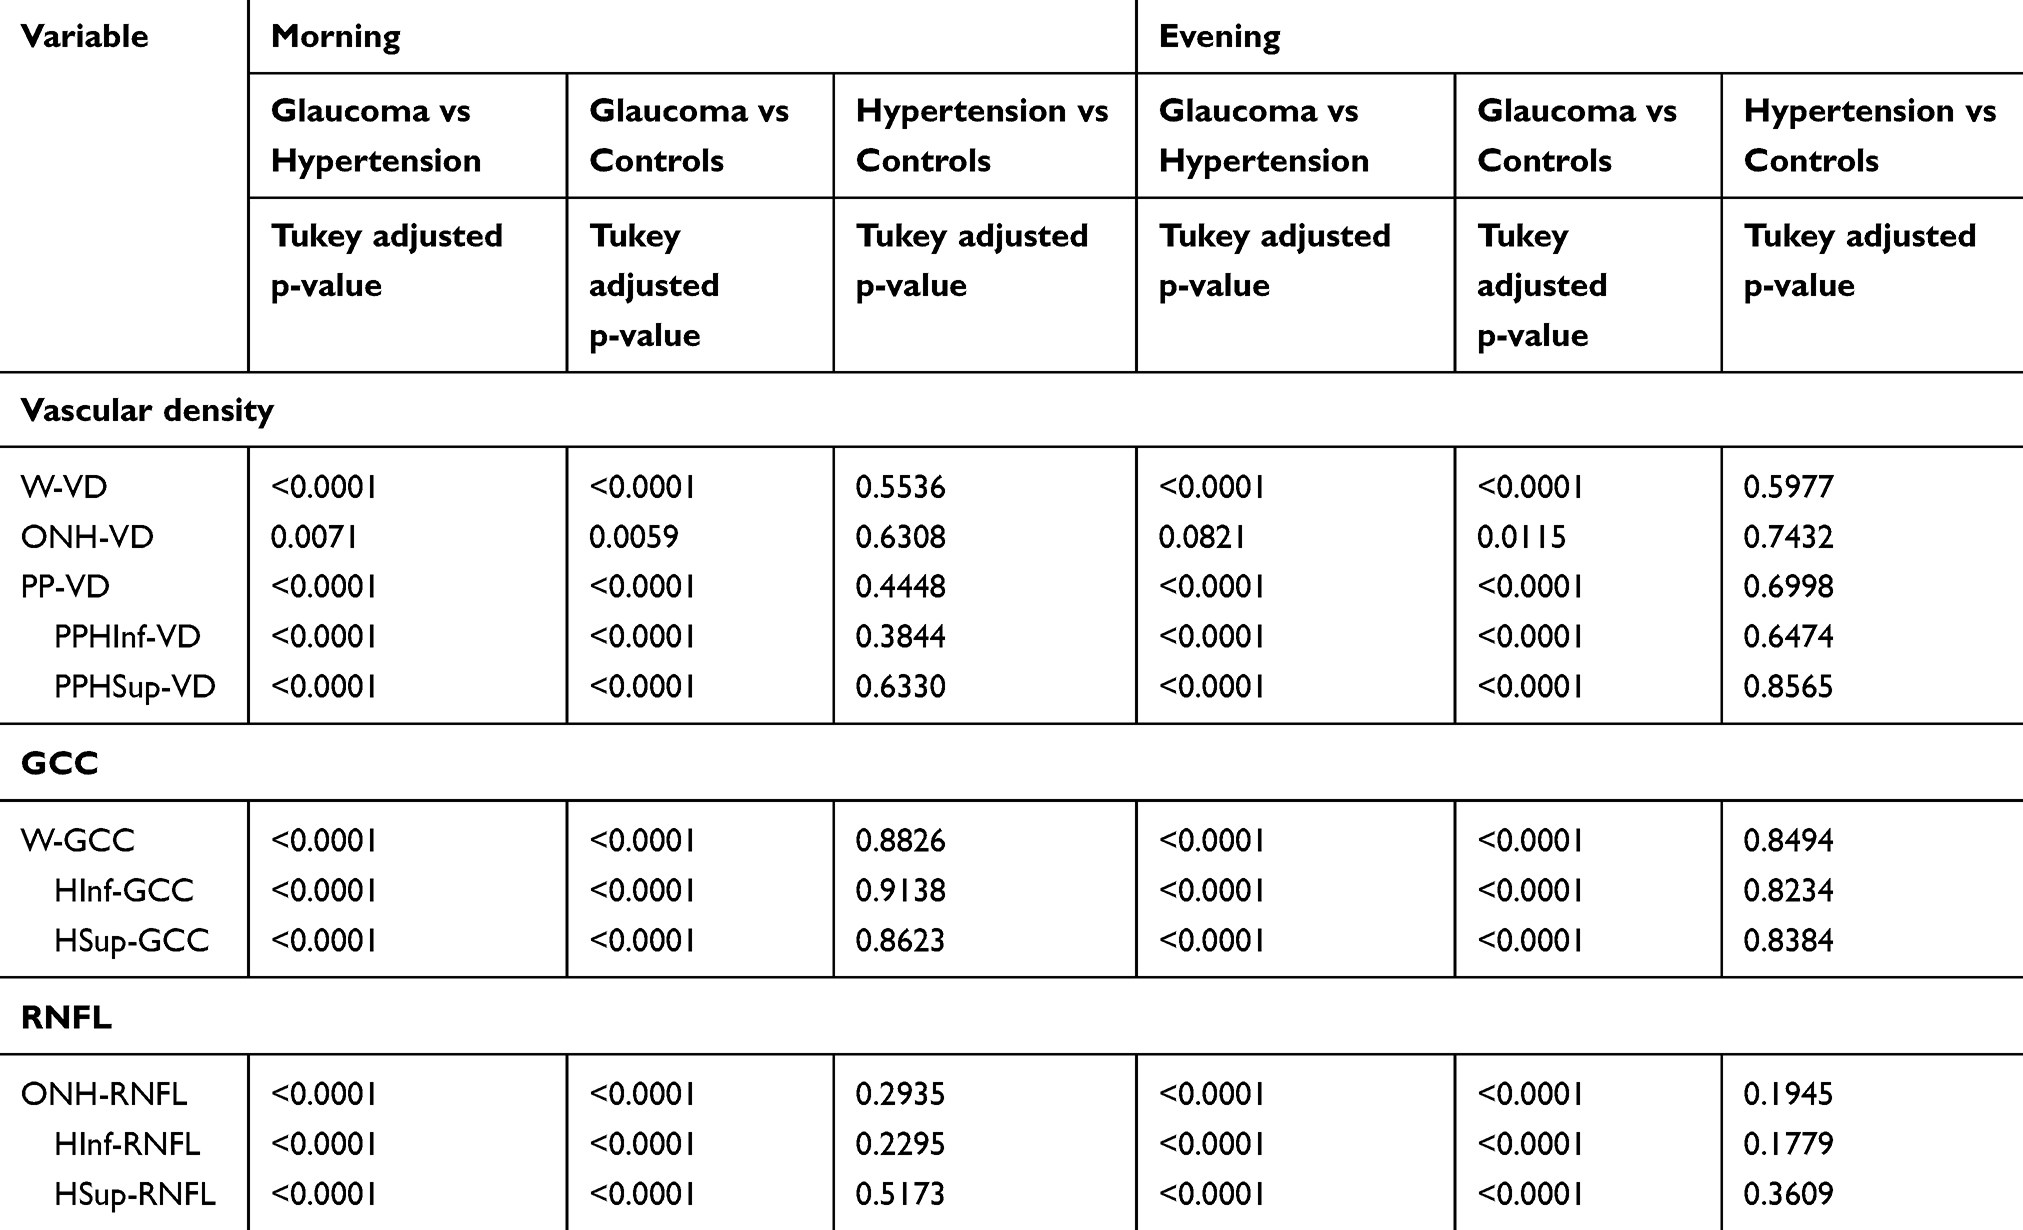 |
Table 4 Post-hoc tukey’s tests of the Group to Group Comparison. There Is a Statistically Significant Difference for Every Parameter Investigated between Eyes with Glaucoma and Control Eyes or with Ocular Hypertension, except for ONH-VD in the Evening. Comparisons between Eyes with Ocular Hypertension and Control Eyes Were Not Statistically Significant. Only main parameters are indicated. |
Table 5 lists the regression coefficients and corresponding standard errors with FDR-adjusted p values derived from the multivariate model. Systemic hypertension, age, axial length, daily changes in IOP and scan quality were not significantly associated with daily fluctuations in VD, RNFL or GCC (p>0.1).
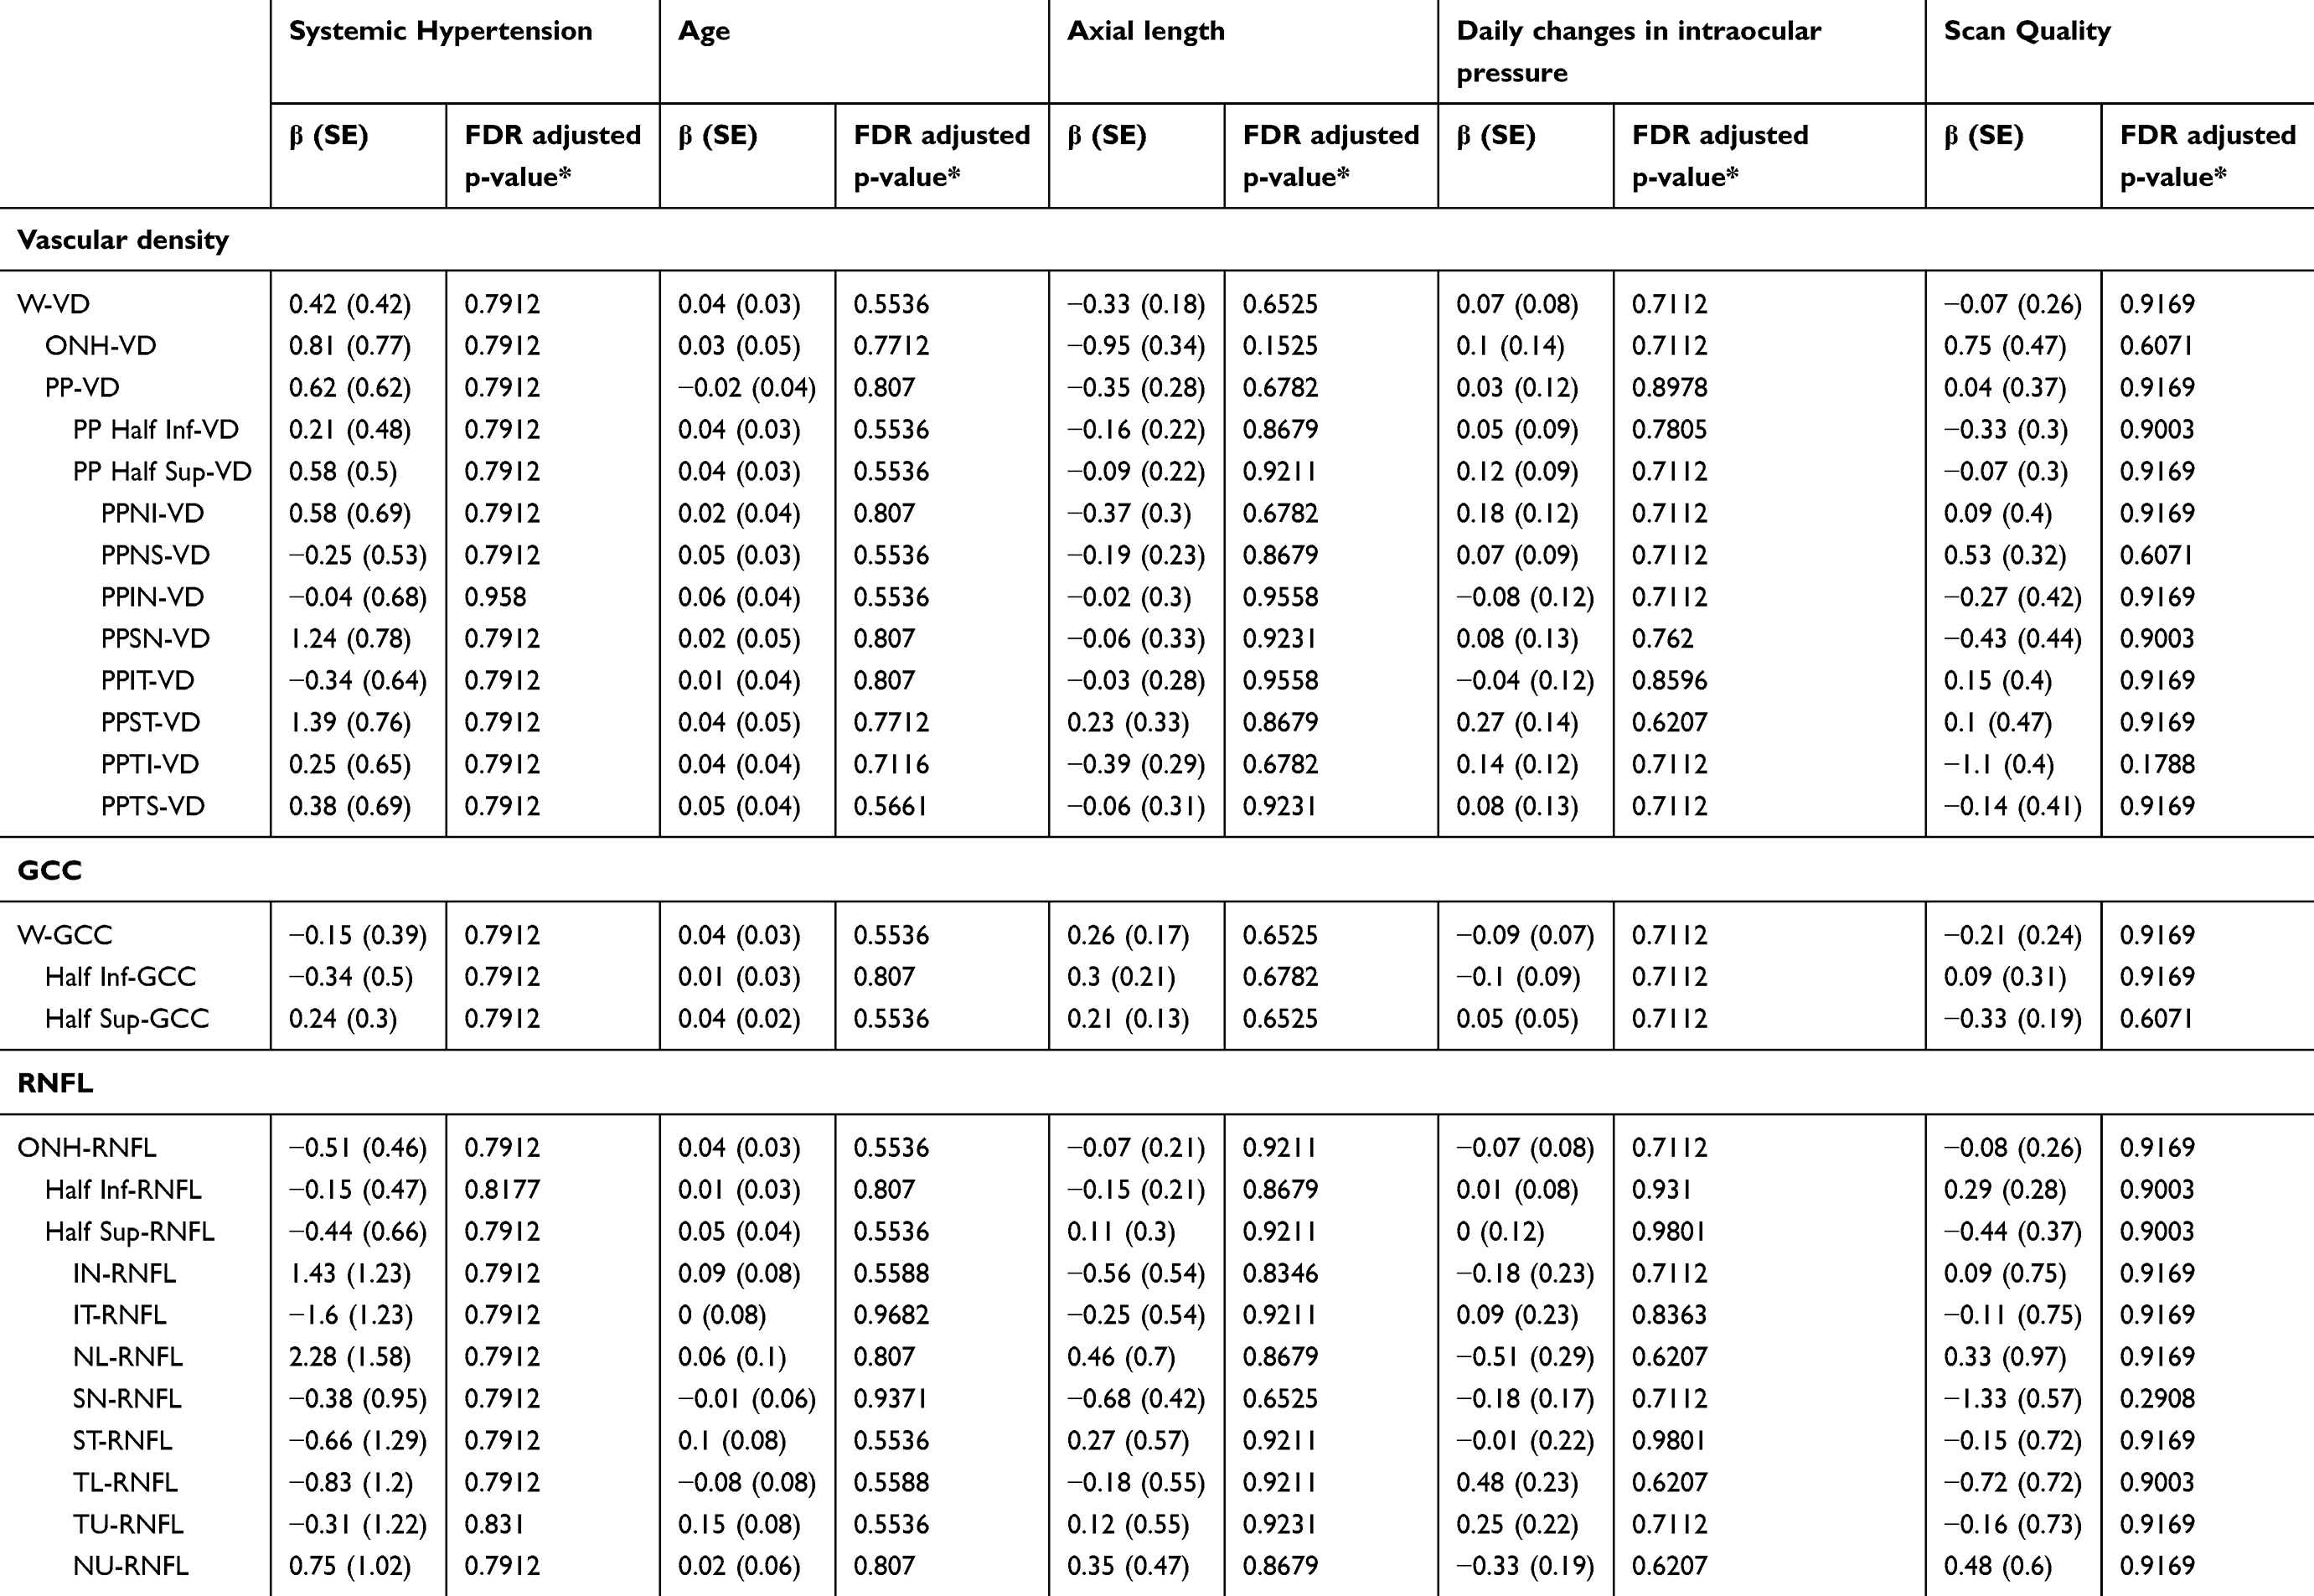 |
Table 5 Regression Coefficients (β) and Corresponding Standard Error (SE) with FDR Adjusted P-value Derived from Multivariate Model. Systemic Hypertension, Age, Axial Length and Daily Changes in IOP and Scan Quality Were Not Significantly Associated with Daily Changes in Any of the Parameter Investigated |
Discussion
This study provides insight into quantitative morphological and vascular-derived characteristics determined by means of OCTA imaging technology in a cohort of individuals homogeneous for age, gender, refractive status, visual acuity, systemic hypertension. Vessel density, GCC and RNFL proved to stay during the daytime, thus corroborating the clinical reliability of this technology in routine clinical practice.
Since eyes with glaucoma and with ocular hypertension were treated with topical medications, it is not surprising there were significant differences among groups in IOP measurements taken in the morning and in the evening (Table 1, P<0.0001), though there were no significant daily changes (Table 1, P=0.59).
Consistently with previous reports,10–15 we found that eyes with glaucoma exhibited RNFL, GCC and VD reduction in every sector of the peripapillary area investigated. This reduction was statistically significant in the morning and the evening in all three groups including every single characteristic (Table 2, P<0.02). Similarly, when comparing group to group, the means of all the parameters measured in the morning and in the evening differed significantly between eyes with glaucoma and eyes with ocular hypertension and controls except ONH-VD and NL-RNFL in the evening (Table 4, p<0.008). On the contrary, no significant differences were registered between control eyes and eyes affected by ocular hypertension (P>0.17, Table 4). In fact, in the ocular hypertension group RNFL, GCC and VD were slightly reduced, but not statistically significantly. This finding is not concordant with several previous studies in which significant reductions in RNFL, GCC and VD were considered to precede glaucoma development.7,15–18 Notably, we included eyes with ocular hypertension that had not alteration of the ONH and this may explain the discrepancy.
Vessel density is thought to be a reliable indicator of microcirculation status, and it has been postulated that vascular problems involving chronic impairment of ocular blood flow can lead to RNFL/GCC damage.19–21 The increasing use of OCTA in clinical practice may clarify the role of ocular blood flow in the pathogenesis of several retinal diseases. Although several potential artefacts constitute a limitation of OCTA technology, its reproducibility is considered good and intra-session and inter-session coefficients ranging from 1.8% to 7.0% have been reported.22–24 However, diurnal VD variations have not been thoroughly investigated to date, in eyes with or without glaucoma. Mansouri et al recently concluded that diurnal differences were relatively small and not statistically significant, although VD measurements of the whole peripapillary area, including the ONH and the peripapillary area were higher in the afternoon than in the morning in a sample of 86 eyes from 43 glaucoma patients.19 Overall, these findings are consistent with the current study in which not only 46 eyes from 28 individuals with glaucoma, but also the 53 eyes from 31 patients affected by ocular hypertension, and the 62 eyes from 38 controls were analysed too. The diurnal changes detected were minimal in every area and in every group, and there were no statistically significant differences in this respect (Tables 2 and 3).
High-quality OCTA imaging is essential for interpreting and monitoring VD. Mansouri et al found that changes in scan quality and VD were significantly associated.19 On the contrary, it is relevant that no statistical correlations were detected in our series, probably because of the high quality of scan acquisition (median 8–9, Table 1).
The main interesting finding of the study is that all the parameters investigated were stable throughout the day in all three groups despite the fact that physiological variations in IOP, systemic pressure and choroidal blood flow were reportedly typical.25 We can observe that in eyes with glaucoma the VD in most of the sectors tend to be higher in the evening, but this finding is not statistical significant. Moreover, it is known that the choroidal thickness changes during the day26,27 and that choroid has autonomic nerve endings whereas the retina does not.28 Consistently, in the study by Yanik et al, no daily fluctuations were found in macular VD28 probably because the retinal circulation is not an end artery region like the choriocapillary, but is organized in superficial and deep vascular plexuses. In addition, given that VD is a validated value determined automatically by a device which calculates the total area investigated/the area occupied by vessels based on retina’s en face imaging, the present study yielded some additional evidence that retinal vessels are influenced by an autoregulatory system in order to maintain stable vascularity that is independent of other factors.28,29 Conversely, a number of previous studies indicated abnormal ocular blood flow autoregulation in glaucoma using different technologies such as color/laser Doppler flowmetry.30,31 However, it should be noted that OCTA can quantitively assess vessel calibre volume in the area investigated, but not the amount of blood flow. Moreover, all patients with glaucoma or ocular hypertension in the present study were on IOP-lowering topical medications, known to normalize ocular blood flow.32
To the best of our knowledge there are few reports on diurnal fluctuations in GCC and RNFL thickness determined by spectral domain optical coherence tomography (SD-OCT). Using a different device, the Spectralis SD-OCT (Heidelberg Engineering, Heidelberg, Germany) Ashraf et al evidenced that in 21 healthy individuals RNFL thickness was significantly greater in the morning in nasal, inferior and inferonasal subfields, suggesting that changes were due to real diurnal variations rather than repeatability limitations of the device.33 On the contrary, our findings suggest morphological stability of the RNFL and GCC thickness in the eyes with and without glaucoma during the day.
The regression coefficient derived from the multivariate model investigated the roles of systemic hypertension, axial length and IOP changes. Interestingly, none of these factors were shown to play a significant role (Table 5). Although not statistically significant, increased age corresponded with small increases in mean daily variation in almost all of the parameters investigated, suggesting that aging may affect the vascular autoregulatory system of the eye.
The current study had some limitations, including the intrinsic limit of OCTA technology and the lack of multiple intra-session acquisitions. However, it is unique in that it compared diurnal fluctuations in OCTA-determined parameters and in more commonly used RNFL and GCC thickness, in the same eye, with the same device in different groups of patients. None of the parameters investigated exhibited significant daily variation, which was independent of age, IOP, systemic hypertension and axial length. Overall, all the measurements were stable during the day, thus corroborating the clinical relevance of OCTA regardless the time of acquisition.
Conclusion
On optical coherence tomography angiography we did not find any diurnal fluctuations in peripapillary vessel density and thickness of ganglion cell complex and retinal fiber layer, when we compared healthy eyes with eyes of patients with ocular hypertension and glaucoma.
Acknowledgment
We would like to thank Editage for English language editing.
Disclosure
The authors report no conflicts of interest in this work.
References
1. Weinreb RN, Aung T, Medeiros FA. The pathophysiology and treatment of glaucoma: a review. JAMA. 2014;311:1901–1911. doi:10.1001/jama.2014.3192
2. Flammer J, Mozaffarieh M. What is the present pathogenetic concept of glaucomatous optic neuropathy? Surv Ophthalmol. 2007;52(Suppl 2):S162–S73. doi:10.1016/j.survophthal.2007.08.012
3. Jia Y, Tan O, Tokayer J, et al. Split-spectrum amplitude decorrelation angiography with optical coherence tomography. Opt Express. 2012;20:4710–4725. doi:10.1364/OE.20.004710
4. Jia Y, Wei E, Wang X, et al. Optical coherence tomography angiography of optic disc perfusion in glaucoma. Ophthalmology. 2014;121:1322–1332. doi:10.1016/j.ophtha.2014.01.021
5. Liu L, Jia Y, Takusagawa HL, et al. Optical coherence tomography angiography of the peripapillary retina in glaucoma. JAMA Ophthalmol. 2015;133:1045–1052. doi:10.1001/jamaophthalmol.2015.2225
6. Wang X, Jiang C, Ko T, et al. Correlation between optic disc perfusion and glaucomatous severity in patients with open angle glaucoma: an optical coherence tomography angiography study. Graefes Arch Clin Exp Ophthalmol. 2015;253:1557–1564. doi:10.1007/s00417-015-3095-y
7. Chen CL, Zhang A, Bojikian KD, et al. Peripapillary retinal nerve fiber layer vascularmicrocirculation in glaucoma using optical coherencetomography–based microangiography. Invest Ophthalmol Vis Sci. 2016;57:475–485. doi:10.1167/iovs.15-18909
8. Chung JK, Hwang YH, Wi JM, et al. Glaucoma diagnostic ability of the optical coherence tomography angiography vessel density parameters. Curr Eye Res. 2017;42:1458–1467. doi:10.1080/02713683.2017.1337157
9. Gherghel D, Hosking SL, Orgül S. Autonomic nervous system, circadian rhythms, and primary open-angle glaucoma. Surv Ophthalmol. 2004;49:491–508. doi:10.1016/j.survophthal.2004.06.003
10. Lee EJ, Lee KM, Lee SH, et al. OCT Angiography of the peripapillary retina in primary open-angle glaucoma. Invest Ophthalmol Vis Sci. 2016;57:6265–6270. doi:10.1167/iovs.16-19420
11. Mammo Z, Heisler M, Balaratnasingam C, et al. Quantitative optical coherence tomography angiography of radial peripapillary capillaries in glaucoma, glaucoma suspect, and normal eyes. Am J Ophthalmol. 2016;170:41–49. doi:10.1016/j.ajo.2016.07.015
12. Mansoori T, Sivaswamy J, Gamalapati JS, et al. Radial peripapillary capillary density measurement using optical coherence tomography angiography in early glaucoma. J Glaucoma. 2017;26:438–443. doi:10.1097/IJG.0000000000000649
13. Shin JW, Lee J, Kwon J, et al. Regional vascular density-visual field sensitivity relationship in glaucoma according to disease severity. Br J Ophthalmol. 2017;101:1666–1672. doi:10.1136/bjophthalmol-2017-310180
14. Yarmohammadi A, Zangwill LM, Diniz-Filho A, et al. Optical coherence tomography angiography vessel density in healthy, glaucoma suspect, and glaucoma eyes. Invest Ophthalmol Vis Sci. 2016;57:451–459. doi:10.1167/iovs.16-19420
15. Triolo G, Rabiolo A, Shemonski ND, et al. Optical coherence tomography angiography macular and peripapillary vessel perfusion density in healthy subjects, glaucoma suspects, and glaucoma patients. Invest Ophthalmol Vis Sci. 2017;58:5713–5722. doi:10.1167/iovs.17-22865
16. Banitt MR, Ventura LM, Feuer WJ, et al. Progressive loss of retinal ganglion cell function precedes structural loss by several years in glaucoma suspects. Invest Ophthalmol Vis Sci. 2013;54:2346–2352. doi:10.1167/iovs.12-11026
17. Lalezary M, Medeiros FA, Weinreb RN, et al. Baseline optical coherence tomography predicts the development of glaucomatous change in glaucoma suspects. Am J Ophthalmol. 2006;142:576–582. doi:10.1016/j.ajo.2006.05.004
18. Miki A, Medeiros FA, Weinreb RN, et al. Rates of retinal nerve fiber layer thinning in glaucoma suspect eyes. Ophthalmology. 2014;121:1350–1358. doi:10.1016/j.ophtha.2014.01.017
19. Mansouri K, Rao HL, Hoskens K, et al. Diurnal variations of peripapillary and macular vessel density in glaucomatous eyes using optical coherence tomography angiography. J Glaucoma. 2018;27:336–341. doi:10.1097/IJG.0000000000000914
20. Lévêque PM, Zéboulon P, Brasnu E, et al. Optic disc vascularization in glaucoma: value of spectral-domain optical coherence tomography angiography. J Ophthalmol. 2016;2016:6956717.
21. Flammer J, Orgül S, Costa VP, et al. The impact of ocular blood flow in glaucoma. Prog Ret Eye Res. 2002;21:359–393. doi:10.1016/S1350-9462(02)00008-3
22. Manalastas PIC, Zangwill LM, Saunders LJ, et al. Reproducibility of optical coherence tomography angiography macular and optic nerve head vascular density in glaucoma and healthy eyes. J Glaucoma. 2017;26:851–859. doi:10.1097/IJG.0000000000000768
23. Hollo G. Intrasession and between-visit variability of sector peripapillary angioflow vessel density values measured with the angiovue optical coherence tomograph in different retinal layers in ocular hypertension and glaucoma. PLoS One. 2016;11:e0161631. doi:10.1371/journal.pone.0161631
24. Venugopal JP, Rao HL, Weinreb RN, et al. Repeatability of vessel density measurements of optical coherence tomography angiography in normal and glaucoma eyes. Br J Ophthalmol. 2018;102:352–357. doi:10.1136/bjophthalmol-2017-310637
25. Agnifili L, Mastropasqua R, Frezzotti P, et al. Circadian intraocular pressure patterns in healthy subjects, primary open angle and normal tension glaucoma patients with a contact lens sensor. Acta Ophthalmol. 2015;93:e14–e21. doi:10.1111/aos.12408
26. Usui S, Ikuno Y, Akiba M, et al. Circadian changes in subfoveal choroidal thickness and the relationship with circulatory factors in healthy subjects. Invest Ophthalmol Vis Sci. 2012;53:2300–2307. doi:10.1167/iovs.11-8383
27. Tan CS, Ouyang Y, Ruiz H, et al. Diurnal variation of choroidal thickness in normal, healthy subjects measured by spectral domain optical coherence tomography. Invest Ophthalmol Vis Sci. 2012;53:261–266. doi:10.1167/iovs.11-8782
28. Yanik Odabaş Ö, Demirel S, Özmert E, et al. Repeatability of automated vessel density and superficial and deep foveal avascular zone area measurements using optical coherence tomography angiography: diurnal findings. Retina. 2018;38:1238–1245. doi:10.1097/IAE.0000000000001671
29. Pournaras CJ, Rungger-Brandle E, Riva CE, et al. Regulation of retinal blood flow in health and disease. Prog Retin Eye Res. 2008;27:284–330. doi:10.1016/j.preteyeres.2008.02.002
30. Garhofer G, Fuchsjager-Mayrl G, Vass C, et al. Retrobulbar blood flow velocities in open angle glaucoma and their association with mean arterial blood pressure. Invest Ophthalmol Vis Sci. 2010;51:6652–6657. doi:10.1167/iovs.10-5490
31. Bata AM, Fondi K, Witkowska KJ, et al. Optic nerve head blood flow regulation during changes in arterial blood pressure in patients with primary open-angle glaucoma. Acta Ophthalmol. 2019;97:e36–e41. doi:10.1111/aos.13850
32. Fuchsjager-Mayrl G, Georgopoulos M, Hommer A, et al. Effect of dorzolamide and timolol on ocular pressure: blood flow relationship in patients with primary open-angle glaucoma and ocular hypertension. Invest Ophthalmol Vis Sci. 2010;51:1289–1296. doi:10.1167/iovs.09-3827
33. Ashraf H, Nowroozzadeh MH. Diurnal variation of retinal thickness in healthy subjects. Optom Vis Sci. 2014;91:615–623. doi:10.1097/OPX.0000000000000269
 © 2019 The Author(s). This work is published and licensed by Dove Medical Press Limited. The full terms of this license are available at https://www.dovepress.com/terms.php and incorporate the Creative Commons Attribution - Non Commercial (unported, v3.0) License.
By accessing the work you hereby accept the Terms. Non-commercial uses of the work are permitted without any further permission from Dove Medical Press Limited, provided the work is properly attributed. For permission for commercial use of this work, please see paragraphs 4.2 and 5 of our Terms.
© 2019 The Author(s). This work is published and licensed by Dove Medical Press Limited. The full terms of this license are available at https://www.dovepress.com/terms.php and incorporate the Creative Commons Attribution - Non Commercial (unported, v3.0) License.
By accessing the work you hereby accept the Terms. Non-commercial uses of the work are permitted without any further permission from Dove Medical Press Limited, provided the work is properly attributed. For permission for commercial use of this work, please see paragraphs 4.2 and 5 of our Terms.