")
Back to Journals » Neuropsychiatric Disease and Treatment » Volume 11
Disturbed spontaneous brain-activity pattern in patients with optic neuritis using amplitude of low-frequency fluctuation: a functional magnetic resonance imaging study
Authors Huang X, Cai F, Hu P, Zhong Y, Zhang Y, Wei R, Pei C, Zhou F , Shao Y
Received 16 July 2015
Accepted for publication 22 October 2015
Published 16 December 2015 Volume 2015:11 Pages 3075—3083
DOI https://doi.org/10.2147/NDT.S92497
Checked for plagiarism Yes
Review by Single anonymous peer review
Peer reviewer comments 3
Editor who approved publication: Professor Wai Kwong Tang
Xin Huang,1,2,* Feng-Qin Cai,3,* Pei-Hong Hu,1 Yu-Lin Zhong,1 Ying Zhang,1 Rong Wei,1 Chong-Gang Pei,1 Fu-Qing Zhou,3 Yi Shao1
1Department of Ophthalmology, Jiangxi Province Clinical Ophthalmology Institute, First Affiliated Hospital of Nanchang University, Nanchang, 2Department of Ophthalmology, First People’s Hospital of Jiujiang, Jiujiang, 3Department of Radiology, First Affiliated Hospital of Nanchang University, Nanchang, People’s Republic of China
*These authors contributed equally to this work
Objective: To use the amplitude of low-frequency fluctuation (ALFF) technique to investigate the local features of spontaneous brain activity in optic neuritis (ON) and their relationship with behavioral performance.
Materials and methods: Twelve patients with ON (four male, eight female) and twelve age-, sex-, and education status-matched healthy controls (HCs) (four male, eight female) underwent resting-state functional magnetic resonance imaging (rs-fMRI) scans. The ALFF technique was used to assess local features of spontaneous brain activity. Correlation analysis was used to explore the relationship between the observed mean ALFF values of the different areas and visual evoked potentials (VEPs) in patients with ON.
Results: Compared with HCs, patients with ON had significantly decreased ALFF values in the posterior and anterior lobes of the right cerebellum, right putamen, right inferior frontal gyrus, right insula, right supramarginal gyrus, right inferior parietal lobule, left medial frontal gyrus, left superior temporal gyrus, bilateral anterior cingulate/medial frontal gyrus, and bilateral precuneus, and significantly increased ALFF values in the posterior lobes of the left and right cerebellum, right inferior temporal gyrus, right inferior temporal/fusiform gyrus, left parahippocampal gyrus, left fusiform gyrus, left calcarine fissure, left inferior parietal lobule, and left cuneus. We found negative correlations between the mean ALFF signal value of the left parahippocampal gyrus and the VEP amplitude of the right eye in ON (r=-0.584, P=0.046), and a positive correlation between the mean ALFF signal value of the bilateral precuneus and the best-corrected visual acuity of the left eye (r=0.579, P=0.048) in patients with ON.
Conclusion: ON mainly seems to involve dysfunction in the default-mode network, cerebellum, and limbic system, which may reflect the underlying pathologic mechanism of ON.
Keywords: ALFF, fMRI, optic neuritis, resting state, spontaneous activity, visual evoked potential
Introduction
Optic neuritis (ON) is an inflammation of the optic nerve, which is caused by inflammatory demyelination of the optic nerve, infection, or nonspecific inflammation. The main clinical manifestations include pain during eye movement, sudden vision loss in one or both eyes, visual field defects, relative afferent pupillary obstacle, and papilledema.1 Studies have estimated the annual incidence of ON in the USA at 5–6.4 per 100,000, with an epidemic level of 115 per 100,000.2 ON results in lesions of the optic nerve axons and apoptosis of retinal ganglion cells. Clinically, it can occur as an isolated condition or as a symptom of several systemic autoimmune diseases, such as multiple sclerosis (MS) or neuromyelitis optica.
Optical coherence tomography (OCT) is a noninvasive, high-resolution method that measures the thickness of the retinal nerve-fiber layer. Previous studies have shown that the retinal fiber side is attenuated in patients with ON, which indicates axonal and retinal ganglion-cell loss.3–5 In addition, visual evoked potential (VEP) has greater sensitivity than OCT as a diagnostic test for ON. A previous study showed that ON led to reduction in multifocal VEP amplitude.6 VEP and OCT can also detect axonal degeneration and demyelination of the optic nerve in ON. Magnetic resonance imaging (MRI) is another important clinical test for diagnosing ON, and detects inflammation of the optic nerve and optic papilla by detecting high-density shadows in the optic papilla and anatomy of the optic nerve.7 This may reveal ON demyelination and the potential existence of underlying MS.8
Functional MRI (fMRI) has been used in ON research. A previous fMRI study found decreased functional connectivity in the visual system after acute ON.9 Diffusion-tensor imaging can accurately measure fractional anisotropy (FA) and mean diffusivity of the visual pathway. Previous research has shown significantly decreased mean FA in the affected nerves of patients with idiopathic demyelinating ON.10 In the acute phase of ON, activation of the lateral geniculate nucleus during visual stimulation of the affected eye was shown to be significantly reduced.11 Other evidence has demonstrated that the optic nerve of patients with ON has reduced white-matter FA and decreased fiber structure.12 Although these findings have demonstrated that there are neuronal morphological changes in the ON, there is far less evidence for neuromechanical changes.
Resting-state fMRI (rs-fMRI) is a functional brain-imaging technique that can be used to reveal brain activity that occurs when a subject is not performing any appointed tasks.13 The rs-fMRI method is suitable for investigating the brain’s functional organization and for examining whether it is changed in neurologic or psychiatric diseases.14 Resting-state functional connectivity research has explored many networks that are consistently found in healthy subjects, in different stages of consciousness, and across species, and represent a particular mode of synchronous activity.15 Amplitude of low-frequency fluctuation (ALFF) is an rs-fMRI analysis technique used to measure spontaneous fluctuations in blood oxygen level-dependent fMRI-signal intensity for nervous activity, reflecting the intensity of regional spontaneous brain activity at rest. Whole-brain ALFF shows higher signals in the posterior cingulate, precuneus, and medial prefrontal areas of the default-mode network (DMN).16 The DMN is a “resting-state” network, which shows higher activity at rest, and tends to have a negative correlation with activity in task-positive networks. The DMN is believed to support such processes as implicit learning, autobiographical memory, prospection, and monitoring of the external environment. However, the functional connectivity of the DMN is significantly decreased in patients with Alzheimer’s disease.17 ALFF has been used as a reliable biomarker to investigate neurological conditions, such as schizophrenia,18 Parkinson’s disease,19 and glaucoma,20 and provide useful information for the understanding of these diseases. The current study is the first to our knowledge to investigate regional spontaneous brain activity in the ON and its relationship with VEP.
Materials and methods
Subjects
Twelve patients with ON (four male, eight female) were recruited from the Ophthalmology Department of the First Affiliated Hospital of Nanchang University. The diagnostic criteria of idiopathic ON21 were: 1) acute loss of vision with or without eye pain; 2) visual field abnormalities associated with damage to nerve fibers; 3) relative pupillary conduction block or abnormal VEPs; 4) no clinical or laboratory evidence of compressive, ischemic, toxic, genetic, metabolic, or invasive optic neuropathy; 5) acute vision loss due to retinal disease, sympathetic ophthalmia, or nervous system disease; 6) no treatment with any drugs before rs-fMRI scanning; 7) no obvious abnormality in brain parenchyma by brain MRI; 8) no history of congenital or acquired diseases, such as psychiatric disorder, hypertension, diabetes mellitus, or coronary artery disease, and no addictions such as heroin, smoking, or alcohol; 9) no receipt of organ transplant; and 10) moderate body shape and weight (body mass index between 18.5 and 24.9 kg/m2).
Twelve healthy controls (HCs; four male, eight female) who were age-, sex-, and education status-matched to the patients with the ON group were also recruited for this study. All HCs met the following criteria: 1) no abnormalities in visual pathways or brain parenchyma detected by brain MRI; 2) no ocular disease, naked eye or corrected visual acuity (VA) >1.0; 3) sex and age consistent with the ON group; 4) normal nervous system, with no headache and no psychiatric disorder; and 5) no contraindications for MRI. This study was authorized by the First Affiliated Hospital of Nanchang University ethics committee. All research methods followed the Declaration of Helsinki, and conformed to the principles of medical ethics. For each subject, the study protocol and procedure were fully explained, and consent was obtained, according to the Ethics Committee of the First Affiliated Hospital of Nanchang University.
MRI parameters
MRI scanning was performed on a 3 T MR scanner (Trio; Siemens AG, Berlin, Germany) as previously described.20 Functional data were acquired with a three-dimensional spoiled gradient-recalled echo sequence with the following parameters: 176 images (repetition time =1,900 ms, echo time =2.26 ms, thickness =1.0 mm, gap =0.5 mm, acquisition matrix =256×256, field of view =250×250 mm, flip angle =9°) were obtained. Also, 240 functional images (repetition time =2,000 ms, echo time =30 ms, thickness =4.0 mm, gap =1.2 mm, acquisition matrix =64×64, flip angle =90°, field of view =220×220 mm, 29 axial) were obtained.
fMRI data analysis
Functional data were classified by MRIcro software (www.mricro.com) to eliminate incomplete data. The first ten volumes were discarded due to magnetization equilibration. The rest of the data preprocessing was performed by DPARSFA (http://rfmri.org/DPARSF) software, including Digital Imaging and Communications in Medicine form transformation, slice timing, head-motion correction, spatial normalization, and smoothening with a Gaussian kernel of 6×6×6 mm3 full width at half maximum. Subjects who had more than 1.5 mm maximum shift in x, y, or z and 1.5° of angular motion were dismissed. Friston six head-motion parameters were used to regress out head-motion effects, based on recent work showing that higher-order models were more effective in removing head-motion effects.22,23 Linear regression was also applied to remove other sources of false variables, which contained the signal from ventricular and from a region centered in the brain white matter.24 After head-motion correction, the functional images were spatially normalized to the Montreal Neurological Institute space using the standard echo-planar imaging template. ALFF calculation was performed as per a previous study.16 To reduce the global effects of variability across the participants, the ALFF of each voxel was divided by the global mean ALFF value for each participant. A general linear model analysis was performed with the SPM8 toolkit to investigate the group differences in resting brain entropy between patients with ON and HCs, after controlling for the effects of age and sex. The significance level was set at P<0.05, Gaussian random-field theory-corrected, minimum z>2.3.
Brain–behavior correlation analysis
Based on the ALFF findings, the different brain regions between groups were classified as regions of interest with REST software. For each region of interest, the mean ALFF value was extracted by averaging the ALFF value over all voxels. Finally, correlation analysis was performed to investigate the relationship between the mean ALFF value in each of those different areas in the ON group and the related behavioral performances. P<0.005 was considered statistically significant.
Clinical data analysis
All patients underwent pattern-reversal VEP stimulation (RETIport electrophysiological instrument; Roland Consult Stasche & Finger GmbH, Brandenburg an der Havel, Germany) in a dark and quiet room. All the patients were in a quiet state. Three active skin electrodes were placed on the scalp along the midline (over the inion) and on lateral positions (right and left). VEP recording was performed at 100 cm distance from the screen. All patients underwent monocular recording with the untested eye covered.
Using stimulus mode with pattern-reversal VEP stimulation, the parameters were set as: stimulus frequency =1.0 and 100 Hz; interphase =500 ms; number of stimulations =100; average screen brightness =5 cd/m2; spatial frequency =50 ms/s; and contrast ratio =90%. Amplitude and latency VEP values were studied at different angular dimensions of the stimulus (120′, 60′, and 15′ for stimuli with small, medium, and large spatial frequencies of stimulation, respectively). VEPs were characterized by a series of N75, P100, and N135 peaks, each characterized by a specific amplitude and latency.
Results
Demographics and visual measurements
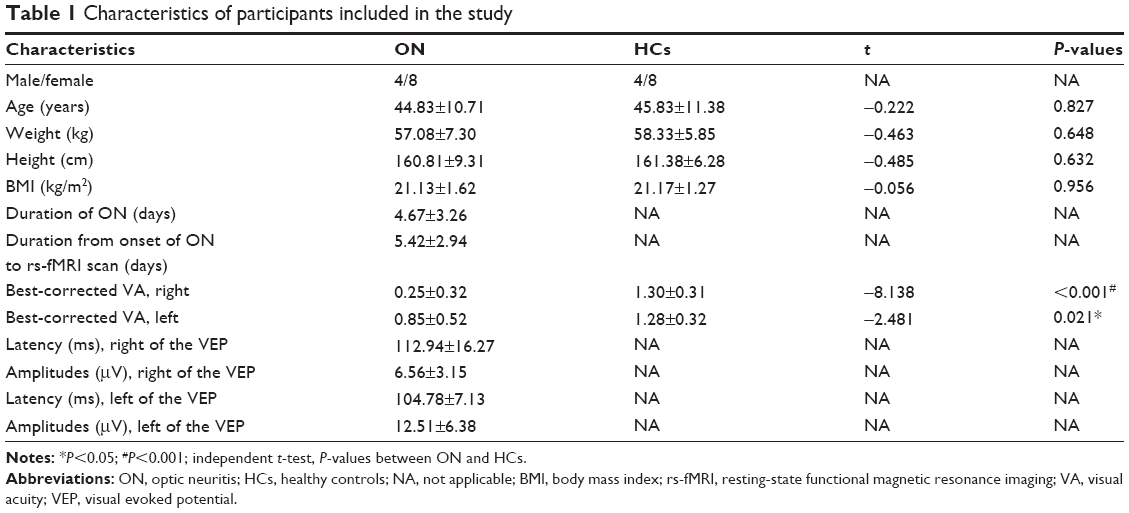
There were no obvious differences in weight (P=0.648), age (P=0.827), height (P=0.632), or body mass index (P=0.956) between the patients with ON and the HCs. There were significant differences in best-corrected VA – right (P<0.001) and best-corrected VA – left (P=0.021) between patients with ON and the HCs. Details are presented in Table 1.
 | Table 1 Characteristics of participants included in the study |
ALFF differences
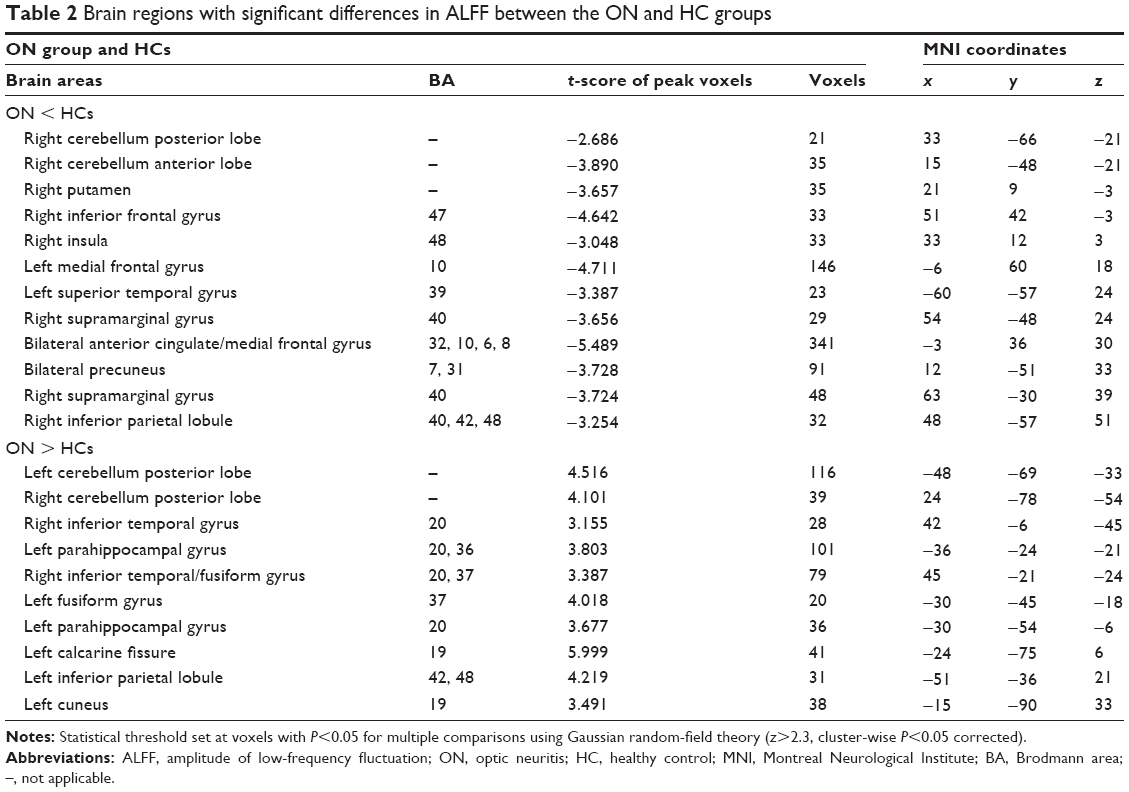
Compared with HCs, patients with ON had significantly decreased ALFF values in the anterior and posterior lobes of the right cerebellum, and the right putamen, right inferior frontal gyrus, right insula, right supramarginal gyrus, right inferior parietal lobule, left medial frontal gyrus, left superior temporal gyrus, bilateral anterior cingulate/medial frontal gyrus, and bilateral precuneus (Figure 1 [blue] and Table 2).
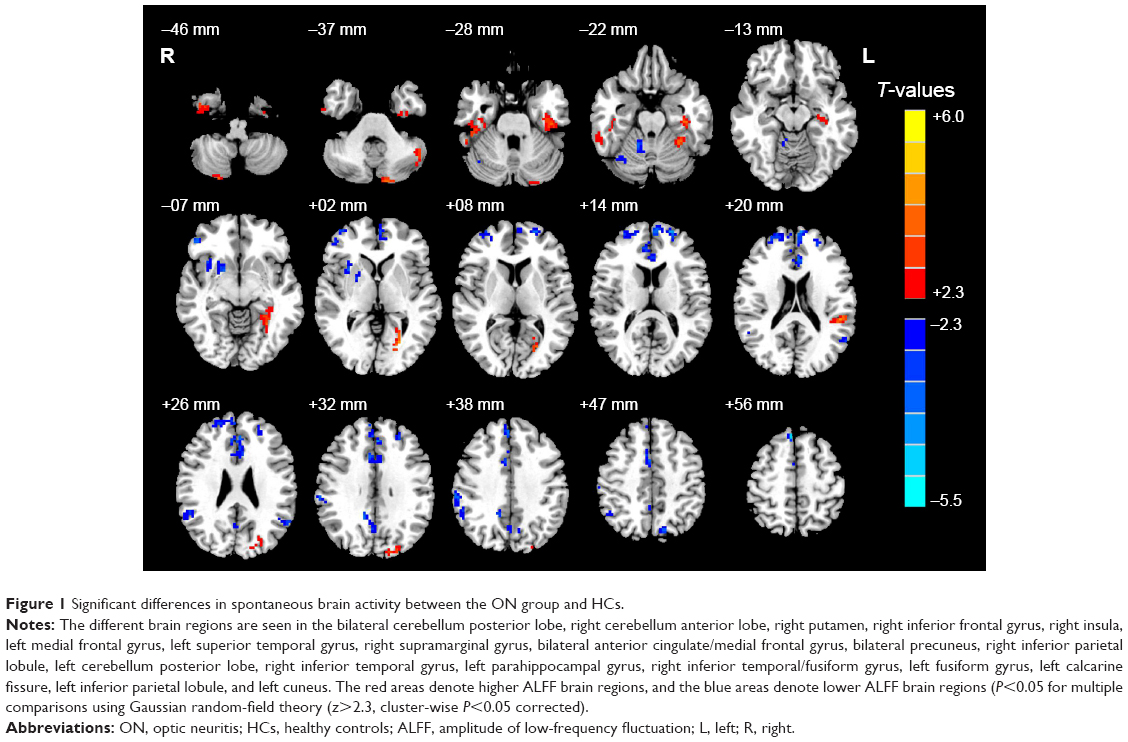 | Figure 1 Significant differences in spontaneous brain activity between the ON group and HCs. |
 | Table 2 Brain regions with significant differences in ALFF between the ON and HC groups |
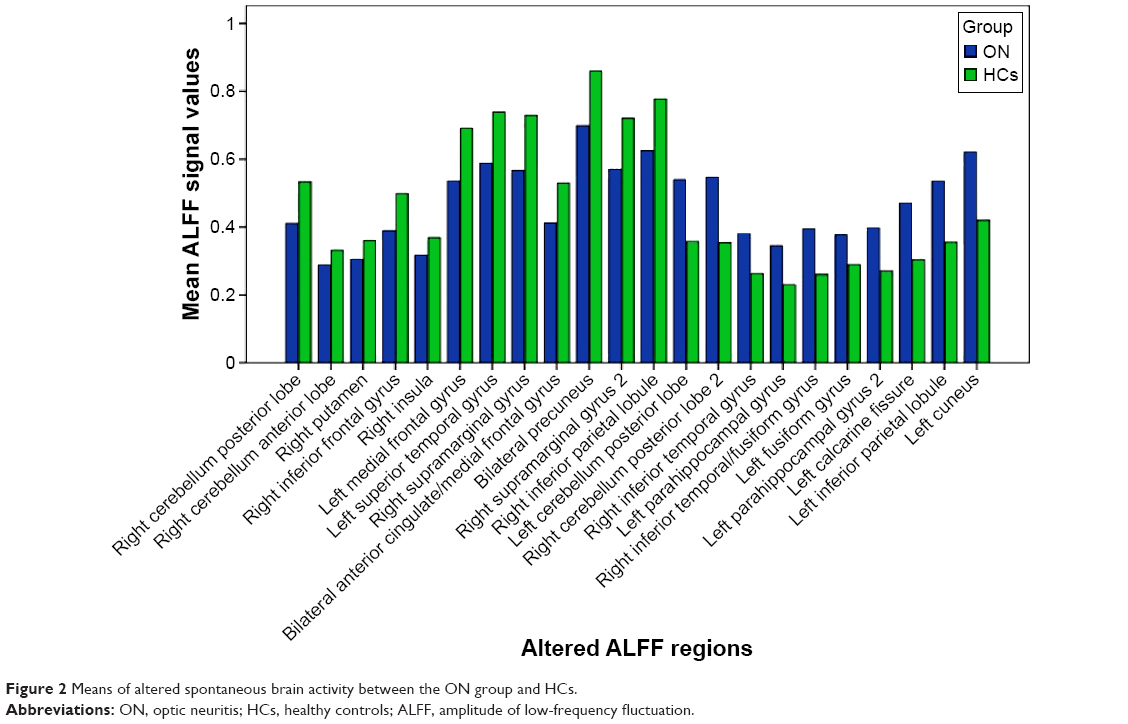
Brain areas with significantly increased ALFF values in the ON group were located in the posterior lobes of the left and right cerebellum, and the right inferior temporal gyrus, right inferior temporal/fusiform gyri, left parahippocampal gyrus, left fusiform gyrus, left calcarine fissure, left inferior parietal lobule, and left cuneus (Figure 1 [red] and Table 2). Meanwhile, we showed the mean of altered spontaneous brain activity between the ONs and HCs in Figure 2.
 | Figure 2 Means of altered spontaneous brain activity between the ON group and HCs. |
Correlation analysis
In the ON group, we found that the mean ALFF signal value of the left parahippocampal gyrus showed a negative correlation with the VEP amplitude of the right eye in patients with ON (r=−0.584, P=0.046), while the mean ALFF value of the bilateral precuneus showed a positive correlation with the best-corrected VA – left (r=0.579, P=0.048). Details are presented in Figure 3.
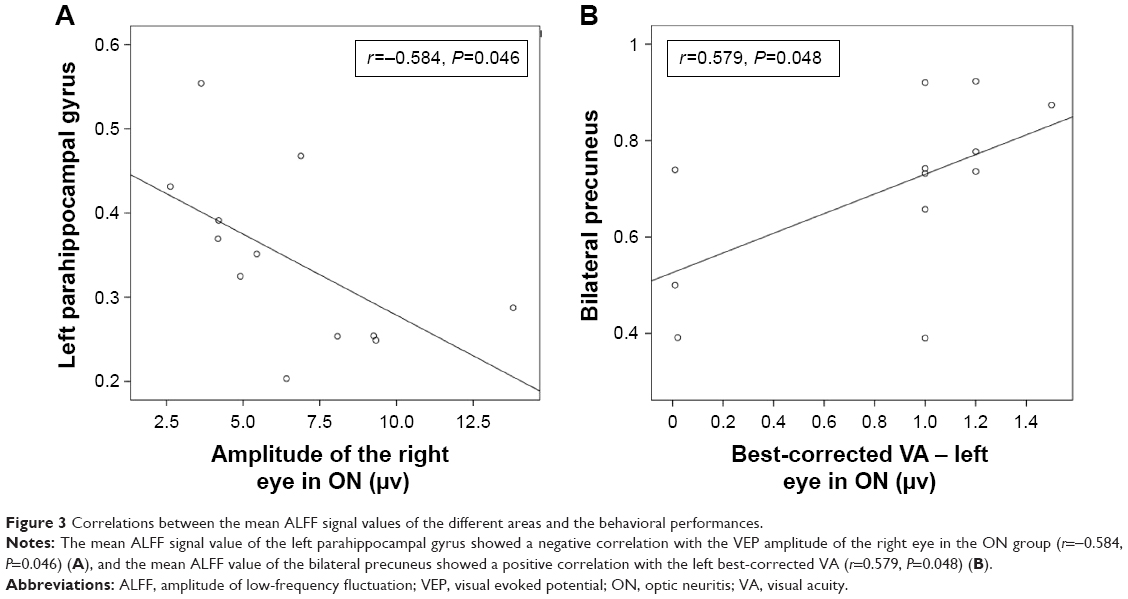 | Figure 3 Correlations between the mean ALFF signal values of the different areas and the behavioral performances. |
Discussion
This study is the first to our knowledge to evaluate the effect of ON on resting-state brain activity using the ALFF technique. We found that compared with HCs, patients with ON had lower ALFF values in the posterior and anterior lobes of the right cerebellum, and the right putamen, right inferior frontal gyrus, right insula, right supramarginal gyrus, right inferior parietal lobule, left medial frontal gyrus, left superior temporal gyrus, bilateral anterior cingulate/medial frontal gyrus, and bilateral precuneus, while they had higher ALFF values in the cluster of the posterior lobes of the left and right cerebella, and the right inferior temporal gyrus, right inferior temporal/fusiform gyrus, left parahippocampal gyrus, left fusiform gyrus, left calcarine fissure, left inferior parietal lobule, and left cuneus. Furthermore, we observed that the mean ALFF signal value of the left parahippocampal gyrus showed a negative correlation with the VEP amplitude of the right eye in ON (r=−0.584, P=0.046). In addition, we found that the mean ALFF value of the bilateral precuneus showed a positive correlation with the best-corrected VA – left (r=0.579, P=0.048).
The DMN in the brain is continuously activated during a resting-state condition.25 Many brain-function areas are involved in the DMN, including the posterior cingulate cortex, inferior parietal cortex, medial temporal lobes, medial frontal cortex, and anterior cingulate cortex.26,27 The DMN is related to many awareness activities, such as cognition,28 anxiety, and depression.29 Previous studies have identified many diseases that lead to DMN dysfunction, such as Alzheimer’s disease,30 Parkinson’s disease,31 and schizophrenia.32 Toosy et al33 found that patients with ON showed abnormal activation of areas in the bilateral insula–claustrum and frontal and posterior parietal and lateral temporal cortices. Werring et al34 also found that patients with ON showed abnormal activation of areas in the insula–claustrum, lateral temporal and posterior parietal cortices, and the thalamus. ON is the foremost clinical feature in 20% of patients with MS.35 Bonavita et al36 demonstrated that the DMN connectivity of MS was significantly weaker in the anterior cingulate cortex, but stronger in the posterior cingulate cortex compared with healthy subjects. In support of these findings, we found that patients with ON in the present study had lower ALFF values in the left medial frontal gyrus, left superior temporal gyrus, right inferior parietal lobule, bilateral anterior cingulate/medial frontal gyrus, and bilateral precuneus, while they had higher ALFF in the right inferior temporal gyrus and left inferior parietal lobule. ALFF, as an important aspect of rs-fMRI studies, may provide more information to assist in the understanding of ON-related functional reorganization. Therefore, the decreased ALFF in DMN indicates that ON may lead to DMN damage, while the higher ALFF in the right inferior temporal gyrus and left inferior parietal lobule may reflect compensation by the DMN to maintain the stability of the internal network.
In addition, we found that ALFF signals in the bilateral anterior cingulate/medial frontal gyrus were lower than in other regions. Previous studies have shown that dysfunction of the anterior cingulate cortex is associated with pain37 and depression,38 and thus patients with ON may have abnormal pain and mental depression. Furthermore, the posterior precuneus is primarily involved in visuospatial functions,39,40 and we also found that the mean ALFF value of the bilateral precuneus showed a positive correlation with the best-corrected VA – left (r=0.579, P=0.048). We therefore conclude that the visual loss experienced by patients with ON may relate to dysfunction of the bilateral precuneus.
The cerebellum is involved in balance and motor control, as well as cognitive tasks. Positron-emission tomography and fMRI studies have demonstrated that the functions of the cerebellum include cognition and memory.41 Previous studies have demonstrated that dysfunction of the cerebellum is involved in schizophrenia,42 bipolar disorder,43 and depression.44 Saini et al45 found that there is a reduction in functional connectivity between the left primary motor cortex and the right dentate in patients with MS, while Ceccarelli et al46 demonstrated that patients with primary progressive MS had more obvious activation of the left cerebellum compared with healthy subjects. In support of these findings, we also found that patients with ON had lower ALFF values in the posterior and anterior lobes of the right cerebellum, and had higher ALFF values in the posterior lobes of the left and right cerebellum. The decreased ALFF values in these regions may reflect functional damage, while the increased ALFF values in neighboring brain regions may reflect functional reorganization to compensate for the damaged area. The limbic system is closely related to memory and emotion.47 The classic circuit of the limbic system described by Papez includes the hippocampus, mammillary bodies, anterior thalamic nuclei, cingulate gyrus, and the parahippocampal gyrus.48 Duan et al49 found that patients with relapsing–remitting MS had significant reductions in gray matter in the bilateral thalami, caudate, left parahippocampal gyrus, and right hippocampus, while Audoin et al50 demonstrated that patients with ON had a lower gray-matter transfer ratio in the visual cortex and left hippocampus compared with controls. In the present study, we also found that patients with ON had lower ALFF values in areas in the anterior cingulate, which may suggest that ON has a harmful effect on the limbic system. However, there were higher ALFF values in areas in the left parahippocampal gyrus, which may relate to compensation by the limbic system. Furthermore, we found that the mean ALFF signal value of the left parahippocampal gyrus showed a negative correlation with the VEP amplitude of the right eye in patients with ON (r=−0.584, P=0.046). A previous study showed that patients with ON had delayed P100 VEP latency and reduced P100 VEP amplitude compared with controls,51 and thus, reduced P100 VEP amplitude in ON can to some extent reflect the severity of ON. We therefore conclude that increased ALFF values in the left parahippocampal gyrus may relate to the severity of ON.
Conclusion
In summary, we found that patients with ON had abnormal regional spontaneous activities involved in regional brain changes, which showed negative correlations with the VEP amplitude of the eye in ON. These findings provide important information for the understanding of the neural mechanisms underlying ON. However, there are some limitations to our study, such as the relatively small sample size, the use of a single-center study, and the lack of comparison between patients before and after treatment. In future studies, we will use other techniques to explore changes in brain function in patients with ON.
Acknowledgments
This study was supported by the National Natural Science Foundation of China (81160118 and 81400372); Clinical Medicine Research Special-Purpose Foundation of China (L2012052); Jiangxi Province Voyage Project (2014022); Jiangxi Province Degree and Postgraduate Education Reform Project (2015); Science and Technology Platform Construction Project of Jiangxi Province (2013116); Youth Science Foundation of Jiangxi Province (20151BAB215016); Technology and Science Foundation of Jiangxi Province (20151BBG70223); Jiangxi Province Education Department Scientific Research Foundation (GJJ14170); Health Development Planning Commission Science Foundation of Jiangxi Province (20155154); and Scholar Project of Ganjiang River (2015).
Disclosure
The authors report no conflicts of interest in this work.
References
Pérez-Cambrodí RJ, Cubillana AG, Merino-Suárez ML, Piñero-Llorens DP, Laria-Ochaita C. Optic neuritis in pediatric population: a review in current tendencies of diagnosis and management. J Optom. 2014;7(3):125–130. | ||
Pau D, Al Zubidi N, Yalamanchili S, Plant GT, Lee AG. Optic neuritis. Eye (Lond). 2011;25(7):833–842. | ||
Costello F, Coupland S, Hodge W, et al. Quantifying axonal loss after optic neuritis with optical coherence tomography. Ann Neurol. 2006;59(6):963–969. | ||
Syc SB, Saidha S, Newsome SD, et al. Optical coherence tomography segmentation reveals ganglion cell layer pathology after optic neuritis. Brain. 2012;135(2):521–533. | ||
Trip SA, Schlottmann PG, Jones SJ, et al. Retinal fiber layer axonal loss and visual dysfunction in optic nerve neuritis. An Neurol. 2005;58(3):383–391. | ||
Jayaraman M, Gandhi RA, Ravi P, Sen P. Multifocal neuropathy visual compressive optic evoked potential neuropathy in optic neuritis, ischemic optic neuropathy and compressive optic neuropathy. Indian J Ophthalmol. 2014;62(3):299–304. | ||
Tang WQ, Wei SH. Primary Sjögren’s syndrome related optic neuritis. Int J Ophthalmol. 2013;6(6):888–891. | ||
Hauser SL, Oksenberg JR, Lincoln R, et al. Interaction between HLA-DR2 and abnormal brain MRI in optic neuritis and early MS. Optic Neuritis Study Group. Neurology. 2000;54(9):1859–1861. | ||
Wu GF, Brier MR, Parks CA, Ances BM, Van Stavern GP. An eye on brain integrity: acute optic neuritis affects resting state functional connectivity. Invest Ophthalmol Vis Sci. 2015;56(4):2541–2546. | ||
Li M, Li J, He H, et al. Directional diffusivity changes in the optic nerve and optic radiation in optic neuritis. Br J Radiol. 2011;84(1000):304–314. | ||
Korsholm K, Madsen KH, Frederiksen JL, Skimminge A, Lund TE. Recovery from optic neuritis: an ROI-based analysis of LGN and visual cortical areas. Brain. 2007;130(5):1244–1253. | ||
Mascioli G, Salvolini S, Cavola GL, et al. Functional optic MRI examination of visual pathways in patients with unilateral neuritis. Radiol Res Pract. 2012;2012:265306. | ||
Biswal BB. Resting state fMRI: a personal history. Neuroimage. 2012;62(2):938–944. | ||
Buckner RL, Krienen FM, Yeo BT. Opportunities and limitations of intrinsic functional connectivity MRI. Nat Neurosci. 2013;16(7):832–837. | ||
Dai XJ, Liu CL, Gong HH, et al. Long-term sleep deprivation decreases the default spontaneous activity and connectivity pattern in healthy male subjects: a resting-state fMRI study. Neuropsychiatr Dis Treat. 2015;1:761–772. | ||
Zang YF, He Y, Zhu CZ, et al. Altered baseline brain activity in children with ADHD revealed by resting-state functional MRI. Brain Dev. 2007;29(2):83–91. | ||
Kesler SR. Default mode network as a potential biomarker of chemotherapy-related brain injury. Neurobiol Aging. 2014;35 Suppl 2;2:S11–S19. | ||
Turner JA, Damaraju E, van Erp TG, et al. A multi-site resting state fMRI study on the amplitude of low frequency fluctuations in schizophrenia. Front Neurosci. 2013;7:137. | ||
Kwak Y, Peltier SJ, Bohnen NI, Müller ML, Dayalu P, Seidler RD. L-dopa changes spontaneous low-frequency BOLD signal oscillations in Parkinson’s disease: a resting state fMRI study. Front Syst Neurosci. 2012;4;6:52. | ||
Huang X, Zhong YL, Zeng XJ, et al. Disturbed spontaneous brain activity pattern in patients with primary angle-closure glaucoma using amplitude of low-frequency fluctuation: a fMRI study. Neuropsychiatr Dis Treat. 2015;11:1877–1883. | ||
Hoorbakht H, Bagherkashi F. Optic neuritis, its differential diagnosis and management. Open Ophthalmol J. 2012;6:65–72. | ||
Li HJ, Dai XJ, Gong HH, Nie X, Zhang W, Peng DC. Aberrant spontaneous low-frequency brain activity in male patients with severe obstructive sleep apnea revealed by resting-state functional MRI. Neuropsychiatr Dis Treat. 2015;11:207–214. | ||
Satterthwaite TD, Elliott MA, Gerraty RT, et al. An improved framework for confound regression and filtering for control of motion artifact in the preprocessing of resting-state functional connectivity data. Neuroimage. 2013;64:240–256. | ||
Yan CG, Cheung B, Kelly C, et al. A comprehensive assessment of regional variation in the impact of head micromovements on functional connectomics. Neuroimage. 2013;76:183–201. | ||
Fox MD, Snyder AZ, Vincent JL, Corbetta M, Van Essen DC, Raichle ME. The human brain is intrinsically organized into dynamic, anticorrelated functional networks. Proc Natl Acad Sci U S A. 2005;102(27):9673–9678. | ||
Raichle ME, MacLeod AM, Snyder AZ, Powers WJ, Gusnard DA, Shulman GL. A default mode of brain function. Proc Natl Acad Sci U S A. 2001;98(2):676–682. | ||
Buckner RL, Andrews-Hanna JR, Schacter DL. The brain’s default network: anatomy, function, and relevance to disease. Ann N Y Acad Sci. 2008;1124:1–38. | ||
Spreng RN, DuPre E, Selarka D, et al. Goal-congruent default network activity facilitates cognitive control. J Neurosci. 2014;34(42):14108–14114. | ||
Andreescu C, Wu M, Butters MA, et al. The default mode network in late-life anxious depression. Am J Geriatr Psychiatry. 2011;19(11):980–983. | ||
Vergara EF, Behrens MI. [Default mode network and Alzheimer’s disease]. Rev Med Chil. 2013;141(3):375–380. Spanish. | ||
Yao N, Shek-Kwan Chang R, Cheung C, et al. The default mode network is disrupted in Parkinson’s disease with visual hallucinations. Hum Brain Mapp. 2014;35(11):5658–5666. | ||
Meda SA, Ruaño G, Windemuth A, et al. Multivariate analysis reveals genetic associations of the resting default mode network in psychotic bipolar disorder and schizophrenia. Proc Natl Acad Sci U S A. 2014;111(19):E2066–E2075. | ||
Toosy AT, Werring DJ, Bullmore ET, et al. Functional humans optic neuritis magnetic resonance imaging of the cortical response to photic stimulation in recovery following. Neurosci Lett. 2002;330(3):255–259. | ||
Werring DJ, Bullmore ET, Toosy AT, et al. Recovery from optic neuritis is associated with a change in the distribution of cerebral response to visual stimulation: a functional magnetic resonance imaging study. J Neurol Neurosurg Psychiatry. 2000;68(4):441–449. | ||
Dooley MC, Foroozan R. Optic neuritis. J Ophthalmic Vis Res. 2010;5(3):182–187. | ||
Bonavita S, Gallo A, Sacco R, et al. Distributed changes in default-mode resting-state connectivity in multiple sclerosis. Mult Scler. 2011;17(4):411–422. | ||
Russo JF, Sheth SA. Deep brain stimulation of the dorsal anterior cingulate cortex for the treatment of chronic neuropathic pain. Neurosurg Focus. 2015;38(6):E11. | ||
Onoda K, Yamaguchi S. Dissociative contributions of the anterior cingulate cortex to apathy and depression: topological evidence from resting-state functional MRI. Neuropsychologia. 2015;77:10–18. | ||
Colby CL, Gattass R, Olson CR, Gross CG. Topographical organization of cortical afferents to extrastriate visual area PO in the macaque: a dual tracer study. J Comp Neurol. 1988;269(3):392–413. | ||
Wang K, Jiang T, Yu C, et al. Spontaneous activity associated with primary visual cortex: a resting-state FMRI study. Cereb Cortex. 2008;18(3):697–704. | ||
Desmond JE, Fiez JA. Neuroimaging studies of the cerebellum: language, learning and memory. Trends Cogn Sci. 1998;2(9):355–362. | ||
Andreasen NC, Paradiso S, O’Leary DS. “Cognitive dysmetria” as an integrative theory of schizophrenia: a dysfunction in cortical-subcortical-cerebellar circuitry? Schizophr Bull. 1998;24(2):203–218. | ||
Baldaçara L, Nery-Fernandes F, Rocha M, et al. Is cerebellar volume related to bipolar disorder? J Affect Disord. 2011;135(1–3):305–309. | ||
Bledsoe JC, Semrud-Clikeman M, Pliszka SR. Neuroanatomical and neuropsychological correlates of the cerebellum in children with attention-deficit/hyperactivity disorder combined type. J Am Acad Child Adolesc Psychiatry. 2011;50(6):593–601. | ||
Saini S, DeStefano N, Smith S, et al. Altered cerebellar functional connectivity mediates potential adaptive plasticity in patients with multiple sclerosis. J Neurol Neurosurg Psychiatry. 2004;75(6):840–846. | ||
Ceccarelli A, Rocca MA, Valsasina P. Structural and functional magnetic resonance imaging correlates of motor network dysfunction in primary progressive multiple sclerosis. Eur J Neurosci. 2010;31(7):1273–1280. | ||
Lövblad KO, Schaller K, Vargas MI. The fornix and limbic system. Semin Ultrasound CT MR. 2014;35(5):459–473. | ||
Papez JW. A proposed mechanism of emotion.1937. J Neuropsychiatry Clin Neurosci. 1995;7(1):103–112. | ||
Duan Y, Liu Y, Liang P, et al. Comparison of grey matter atrophy between patients with neuromyelitis optica and multiple sclerosis: a voxel-based morphometry study. Eur J Radiol. 2012;81(2):e110–e114. | ||
Audoin B, Fernando KT, Swanton JK, Thompson AJ, Plant GT, Miller DH. Selective magnetization transfer ratio decrease in the visual cortex following optic neuritis. Brain. 2006;129(Pt 4):1031–1039. | ||
Parisi V, Pierelli F, Restuccia R, et al. Impaired VEP after photostress response in multiple sclerosis patients previously affected by optic neuritis. Electroencephalogr Clin Neurophysiol. 1998;108(1):73–79. |
 © 2015 The Author(s). This work is published and licensed by Dove Medical Press Limited. The full terms of this license are available at https://www.dovepress.com/terms.php and incorporate the Creative Commons Attribution - Non Commercial (unported, v3.0) License.
By accessing the work you hereby accept the Terms. Non-commercial uses of the work are permitted without any further permission from Dove Medical Press Limited, provided the work is properly attributed. For permission for commercial use of this work, please see paragraphs 4.2 and 5 of our Terms.
© 2015 The Author(s). This work is published and licensed by Dove Medical Press Limited. The full terms of this license are available at https://www.dovepress.com/terms.php and incorporate the Creative Commons Attribution - Non Commercial (unported, v3.0) License.
By accessing the work you hereby accept the Terms. Non-commercial uses of the work are permitted without any further permission from Dove Medical Press Limited, provided the work is properly attributed. For permission for commercial use of this work, please see paragraphs 4.2 and 5 of our Terms.