")
Back to Journals » Journal of Blood Medicine » Volume 13
Distribution Width of Red Blood Cells and Related Factors Among Patients with End-Stage Renal Disease in Addis Ababa, Ethiopia
Authors Melese DM , Mekonen W , Aragaw A, Asefa A , Belete AM
Received 13 May 2022
Accepted for publication 22 September 2022
Published 30 September 2022 Volume 2022:13 Pages 537—548
DOI https://doi.org/10.2147/JBM.S373280
Checked for plagiarism Yes
Review by Single anonymous peer review
Peer reviewer comments 2
Editor who approved publication: Dr Martin H Bluth
Daniel Molla Melese,1 Wondyefraw Mekonen,2 Abebaye Aragaw,2 Adisu Asefa,1 Abebe Muche Belete1
1Department of Biomedical Science, Asrat Woldeyes Health Science Campus, Debre Berhan University, Debre Berhan, Ethiopia; 2Department of Physiology, College of Health Science, Addis Ababa University, Addis Ababa, Ethiopia
Correspondence: Daniel Molla Melese, Department of Biomedical Science, Asrat Woldeyes Health Science Campus, Debre Berhan University, PO Box 445, Debre Berhan, Ethiopia, Tel +251 912204363, Email [email protected]
Background: RDW is critical to the clinical diagnosis and progression of ESRD. There is currently little data on the relationship between RDW and ESRD in sub-Saharan Africa. Because of this, the present study evaluates RDW in patients with ESRD and associated factors in Addis Ababa, Ethiopia.
Methods: The hospital-based cross-sectional study design was conducted on a total of 83 patients. RDW, MCV, SCR, BUN, GFR, FBS and serum albumin were determined. Blood pressure (mmHg), weight (kg), height (m), MUAC (cm) and BMI (kg/m2) were also measured. Data entry was via Epi-data version 3.4 and analyzed with SPSS version 26.0. A multivariate logistic regression analysis with a p-value < 0.05 at a 95% confidence interval was used to identify the associated factors of RDW.
Results: A total of 83 ESRD patients participated, with a response rate of 95.4%. RDW ranged from 15.5% to 23.6% with a mean of 17.40% + 1.46%. Anisocytosis was present in 98.8% of patients. Of 83 patients, 66.3% were hypertensive, 20.5% had diabetes, and the remaining 13.3% had other conditions (glomerulonephritis and peripheral vascular disease). The mean GFR value was 5.20 mL/min/1.73 + 1.58. RDW showed a significant association with GFR (AOR: 4.6, 95% CI [1.27, 20.74], P = 0.047), alcohol consumption (AOR: 13.4, P = 0.012, 95% CI [1.97, 22.62]), recurrent kidney disease (AOR=25.6, P=0.016, 95% CI [1.85, 53.71]) and use of medication (AOR=00.2, P=0.044), 95% CI [0.03, 0.95]).
Conclusion: RDW showed a significant association with GFR, recurrent kidney disease, alcohol consumption, and medication use in hemodialysis-dependent ESRD patients. The mechanisms of RDW disruption in ESRD patients need further investigation.
Keywords: red cell distribution width, end stage renal disease, glomerular filtration rate, serum creatinine, mean corpuscular volume, body mass index, blood urea nitrogen, mid-upper arm circumference
Introduction
RDW is part of the complete blood count which is used to quantify the size variation of red blood cells. Mostly, it is used for the diagnosis of anemia and other cardiovascular disorders.1 The lower and upper limits of the RDW values ranged from (11.5–14.5%), but for women they ranged up to (11.5%–15.5%).2 The RDW value was calculated by dividing the standard deviation of the erythrocyte volume by the mean corpuscular volume and multiplying by 100.3 The RDW value below the standard reference range is not clinically significant, while values above the normal range reflect the presence of anisocytosis (the presence of small and large erythrocytes or both).4
CKD is a structural or functional abnormality in the kidneys’ ability to filter blood for at least 3 months. It is characterized by either kidney damage (protein urea (> 30 mg/24 h or > 1 on a specific dipstick) or decreased GFR < 60 mL/min/1.73 m2).5 A previous study had shown that in patients with stage3–5 chronic kidney disease, higher RDW was associated with high morbidity.5 ESRD is becoming a public health concern worldwide.6 In addition, high RDW was associated with type 2 diabetes mellitus, CKD, and albumin in the general population.7
Hemodialysis, one of the alternative treatments in patients with ESRD, can decrease the average survival time of red blood cells due to compression and twisting of the cells.8,9 Even today, RDW has been used to diagnose various types of anemia. Higher RDW values indicate a shortened red blood cell lifespan due to poor erythropoiesis or increased red blood cell destruction.10 Over the past few decades, there has been increasing evidence that high RDW is a predictor of cardiovascular morbidity in the general population,11 chronic heart failure,12 coronary artery disease,13 stroke,14 and kidney transplant recipients15 and acute kidney injury treated with hemodialysis.16
In addition, it has been reported that high RDW is associated with the presence of type 2 diabetes mellitus, the progression of chronic kidney disease in patients with varying degrees of renal dysfunction,7 and albumin in the general population.17 The underlying mechanisms linking high RDW to all of these serious diseases are still unclear, but chronic inflammation, endothelial dysfunction, oxidative stress, and malnutrition have been suggested as possible causes.18 Type 2 diabetes and hypertensive diseases accelerate atherosclerosis, deterioration in renal function and increased morbidity.19 A higher RDW was associated with morbidity and a stronger predictor of disease worsening than other laboratory markers of anemia, such as transferrin saturation and ferritin levels in hemodialysis patients.5 Globally, it has been estimated that more than 500 million individuals have CKD, defined by either kidney damage or glomerular filtration rate (GFR) < 60 mL/min/1.73 m2 for >3 months.20 In Africa CKD imposes disproportionate human suffering and a catastrophic economic burden. Less than 2% of the patients with ESRD have access to renal replacement therapy, making ESRD a death sentence for most patients.21 According to WHO report,22 death due to kidney disease in Ethiopia reached 12,038 or 1.47% of total deaths. Patients with the end-stage renal disease usually have various comorbidities.22 A study done by Lippi et al, confirmed that the estimated glomerular filtration rate (GFR) progressively decreased when the RDW level increased in adult outpatients.23 Another study24 showed that a lower estimated GFR is related to a higher RDW level. Some of the significant risk factors for poor prognosis of ESRD were anemia and RDW which provides an additional prognostic marker for the progression of CKD.24 In addition, a previous study also had shown that RDW significantly increases among CKD patients and has a negative relationship with the estimated GFR.25 Evidence suggests that RDW may serve as a prognostic indicator in healthy individuals as well as specific patient populations including malignancy, renal failure, and cardiovascular disease independent of anemia.26 RDW was associated with diabetes-associated complications including diabetic nephropathy. It is known that inflammatory cytokines, such as interleukin (IL)-1, IL-6, and tumor necrosis factor (TNF)-a, desensitize bone marrow erythroid progenitors to erythropoiesis, inhibiting red blood cell maturation and thereby promote anisocytosis.26 A previous study also showed that RDW level was associated with early renal injury in hypertensive patients,27 and with diabetes-associated complications like diabetic nephropathy.28 A previous study involving 513 patients with essential hypertension reported a statistically significant association between RDW and systolic blood pressure or albumin-to-creatinine ratio after adjustment for potential confounders such as age, sex, and hemoglobin.28 In the United States, about 28% of patients with clinically significant stage 3 or worse CKD are neither diabetic nor hypertensive, particularly those older than 65 years.29 Because it is known that chronic complications induce inflammatory cytokines, such as interleukin (IL)-1, IL-6,29 tumor necrosis factor (TNF)-a,30 desensitize bone marrow erythroid progenitors to erythropoiesis, inhibiting red blood cell maturation and thereby promote anisocytosis. ESRD is a destructive problem that lies in the medical, social, and economic areas which contributes to significant morbidity and mortality, and economic, social, and fundamental health problems in the community.31 CKD is common in developed and developing nations which is conventionally assessed in terms of both overall renal function (GFR) and the presence of kidney damage ascertained by either kidney biopsy or other markers of kidney damage such as abnormal urinary sediment, abnormalities on imaging studies, or the presence of a kidney transplant.32 According to the 2010 US Renal Data System Annual Report, the leading causes of CKD leading to ESRD in the United States were diabetes (153 per million population), hypertension (99 per million population), and glomerulonephritis (23.7 per million population).33 In Sub-Saharan Africa, CKD more commonly affects individuals aged between 20 and 50 years, and the age of onset of ESRD is 20 years earlier in populations of African compared with other ethnic groups in western countries.33 In developing countries, diabetes and hypertension now appear to be the leading causes of ESRD with a prevalence of about 30% and 21%, respectively, but glomerulonephritis and CKD of unknown origin account for a larger fraction of the total. For example, in a recent study of people with CKD detected by the International Society of Nephrology-sponsored screening programs 43% of people with CKD did not have diabetes or hypertension.34 The prevalence of CKD in the northwest part of Ethiopia, defined by the estimated glomerular filtration rate <60 mL/min/1.73 m2, was found to be 17.3% and 14.3% by MDRD and CKD-EPI (chronic kidney disease epidemiology collaboration) equations, respectively. The proportion of stage 3 CKD by MDRD equation was 14.7%, whereas the proportions of stage 4 and stage 5 CKD were 2.2% and 0.4%, respectively.34 In addition to this, a study done in public hospitals of Addis Ababa on the prevalence and associated factors among stage3–5 CKD diabetic patients were 79.4%, 16.2%, and 4.4% respectively by the Cockcroft Gault equation, whereas, it was 73%, 21.6%, and 5.4% respectively by the MDRD equation.35 Elevated RDW reflects increased variations of red blood cell size which indicate altered erythrocyte life span or dysfunctional erythrocytes.36 On the other hand, greater RDW was associated with a greater risk of morbidity in men compared to women, whereas no effect was observed by ethnicity.37 In addition, RDW has been found as a predictor of morbidity in the general population37 and in several conditions including acute and chronic heart failure,38 acute pulmonary embolism and myocardial infarction,39 peripheral arterial disease,40 acute renal failure which required hemodialysis,40 and kidney transplant recipients.41 RDW was increased above the normal reference range in ESRD patients, especially in the subgroup of patients with inflammation and malnutrition. It was positively correlated with hemodialysis duration and weight gain, whereas, negatively correlated with serum albumin. These findings may reflect the negative effects of inflammation and malnutrition on the association between mortality and elevated RDW in ESRD patients.42 A positive correlation between a high RDW and increased incidence of both macro and microvascular complications was seen in diabetic patients without marked vascular complications.43 Several mechanisms can be postulated to explain the association between rising RDW and adverse outcomes. The most important one is inflammatory stress. RDW correlated positively with the log of the CRP concentration in the total population, and the correlation was stronger in the RDW-increased group. Similarly, RDW was positively associated with CRP levels in a study based on a nationwide database of people with diabetes.43 People undergoing hemodialysis treatment suffer from numerous pathological processes along with kidney disease.44 Patients with sustained, higher RDW demonstrated a significantly higher risk than did those with lower RDW (adjusted OR: 1.65, 95% CI: 1.02–2.67).45 Patients with hypertension have elevated RDW. The possible pathophysiological mechanism that increases RDW among hypertensive patients is that hypertension is associated with inflammation. However, whether inflammation is a cause or effect of hypertension is not well understood.46 RDW increased with increased age, obesity, smoking, and alcohol consumption.47 Researchers have shown that inflammatory markers, deficient vitamin B-12, and folic acid were more common in the elderly as compared to younger age.48 Females were found to have a statistically significant higher RDW value as compared to males. The reason behind this is that women are more likely to have a folic acid deficiency and menorrhagia (which is one of the most common complaints of females of reproductive age) which might result in an increased RDW level.49 Multiple mechanisms may play a role in the relationship between RDW and prognosis in critically ill alcoholic patients. The most accepted one is that alcohol metabolites like acetaldehyde, increase the generation of free radicals, such as reactive oxygen and nitrogen species. These free radicals affect the normal development of red blood cells, reduce their oxygen‐carrying capacity, and shorten the life span of these cells.50 RDW values were found to be higher among smokers. The pathophysiological mechanism explaining the association of RDW with smoking is that chronic subclinical inflammation appears to be the driving factor. Hs-CRP levels, a well-established surrogate marker of inflammation, as well as numerous other inflammatory markers such as interleukin-6 and soluble tumor necrosis factor-alpha, VCAM-1, ICAM-1, and E-selectin have been independently associated with smoking.51 Chronic kidney disease affects young adults aged 20–50, in sub-Saharan Africa and is primarily due to hypertension and glomerular diseases. Unlike developed countries, where chronic kidney disease presents in middle-aged and elderly patients is predominantly due to diabetes mellitus and hypertension.52 In a study done among renal patients that attend Dessie referral hospital, the prevalence of CKD, was 3.0% had stage I, 11.9% had stage II, 9.5% had stage III, 3.8% had stage IV and 1.6% had stage V CKD respectively.53 High RDW group patients had significantly higher BMI, lower hemoglobin, higher urea, and creatinine, lower estimated glomerular filtration rate (eGFR), high albumin, and a longer period of T2DM diagnosis compared to a low value.54 Increased RDW can be an appropriate indicator for various types of diseases like inflammatory bowel disease (IBD), cardiovascular disease (CVD), pulmonary disease (PD), Cancer, and cerebrovascular accident.55 Inflammatory cytokines may directly inhibit erythropoietin-induced erythrocyte maturation, which leads to an increase in RDW. It is also known that inflammatory cytokines, such as interleukin 1 or interleukin 6, upregulated hepcidin, which regulates iron homeostasis by inhibiting iron absorption from the intestine and iron release from reticuloendothelial stores.56 A study demonstrated no association existed between RDW and sex in either gender.57 Several genetic risks were previously associated with different traits and diseases and found that most of these, especially those related to cholesterol (both LDL and HDL), triglycerides, systolic blood pressure, BMI, diabetes, and some inflammatory diseases were significantly associated with RDW.58 However, the importance of RDW scores in screening, diagnosis, and progression of ESRD has not been well researched. Therefore, the intention of this study was to assess RDW and associated factors in ESRD patients.
Methods and Materials
Study Area and Time Period
This study was conducted from February to September 2021 at St. Paulo’s Hospital Millennium Medical College, Menelik II Referral Hospital and Zewditu Memorial Hospital.
Study Design and Population
A hospital-based, cross-sectional study design was used and study participants were all ESRD patients who were followed up for hemodialysis during the study period.
Determination of Sample Size and Sampling Technique
The sample size was calculated using the formula for individual population proportions, assuming the prevalence of ESRD in Addis Ababa to be 4.4% and 5.4% using the Cockcroft Gault and MDRD equations, respectively.35 A prevalence of 5.4 and a marginal error of 0.05 were assumed to calculate the sample size.
n= (Zα/2)2 p (q) /d2 = (1.96)2 (0.054) (0.946)/0.0025=78.5=79
n = minimum sample size required for the study
z = standard normal distribution (z = 1.96) with 95% confidence interval
p = sampling proportion of success (0.054),
q = sampling proportion of failure (0.946),
d = tolerable error margin = 5% (0.05).
Allowing for a 10% non-response rate, the final sample size was 87.
A systematic random sample was used to recruit study participants. A proportionate allocation was made for each hospital. From St. Paulo’s= (500, 87)/988=44, from Minilik= (188, 87) /988=17, from Zewditu= (300, 87) /988=26.
Inclusion and Exclusion Criteria
All ESRD patients between the ages of 18 and 70 years who attended selected hospitals during the data collection period were included in this study. However, those suffering from congestive heart failure, anemia, blood cell cancer, chronic liver disease, and inflammatory bowel disease, recent infections including Covid-19 and refusing to participate were excluded.
Variables
RDW was the dependent variable in this study. However, socio-demographic characteristics, behavioral factors, chronic illnesses, medication, and blood cell parameters other than RDW were independent variables.
Data Collection Tools and Measurement
Socio-demographic characteristics and medical history were collected from the patients using a questionnaire. Blood pressure (mmHg); using mercury sphygmomanometer; weight (kg), height (m); using digital weighing scale; and mid-upper arm circumference (cm) using tape were measured. The body mass index (BMI) (kg/m2) was calculated from the weight and height of the study patients.
Laboratory Tests
Five milliliter blood samples were taken from each patient by the laboratory technician. Blood taken from each patient was separated into two test tubes: an EDTA tube for CBC by using MINDRAY BC-5130 Hematology Analyzer and RDW and mean corpuscular volume were determined according to the standard reference range of the machine. SST for serum chemical analysis was used and blood in SST was centrifuged at 3400 RPM for 15 minutes for blood urea and albumin analysis.
Serum creatinine, blood urea level, and serum albumin were measured by Cobas C 311 (Roche, India). Fasting blood glucose level was also measured by a glucometer. GFR was calculated using the diet modification formula for kidney disease. Physical measurements and blood sample collection were conducted thirty minutes before they start dialysis.
Serum creatinine, blood urea level, fasting blood glucose level (glucometer) and serum albumin were also measured. GFR was determined using (the MDRD eGFR formula). Physical measurements and blood sample collection were conducted thirty minutes before they start dialysis.
Data Quality Control
Data were collected by trained health officials and nurses under the supervision of the principal investigators. All variables were filled daily in data extraction format. The laboratory producers were handled by laboratory technologists and all the tests were standardized.
Operational Definition
End-stage renal disease: GFR < 15 mL/min/1.73 m2 using the MDRD-GFR formula.
Anisocytosis: erythrocyte distribution ≥ 16%.
Medium anisocytosis: red cell distribution width between (≥16% - ≤ 17.4%).
High anisocytosis: red cell distribution width > 17.4%.
Statistical Analysis
Data entry was done with Epi-data (version 3.4) and analyzed with SPSS (version 26.0). Associations between variables were determined using logistic regression. A p-value < 0.25 during bivariate logistic regression analysis was subjected to multiple logistic regression, and a p-value < 0.05 during multivariate analysis at a 95% confidence level was considered statistically significant.
Ethical Approval
Ethical approvals for the study were obtained from the Addis Ababa University, Department of Medical Physiology and the Addis Ababa Public Health Research and Emergency Management Directorate with ethical approval reference number (A/A/13173/227). Patients were informed about the aims and benefits of the study before we began data collection. Written consent was obtained from each participant. Patient privacy and confidentiality has been maintained as we assign code numbers. This study is in line with the Declaration of Helsinki.
Results
Socio-Demographic Characteristics
A total of 83 adult ESRD patients took part in this study with a response rate of 95.4%. The average age of patients were 42±11.27, with a range of 20–68 years. Among the study patients, 69.0% were males, 54.2% were married, 45.8% had college or university education, 77.1% were from urban areas and 56.6% had a monthly salary (ETB) of less than 5462 (Table 1).
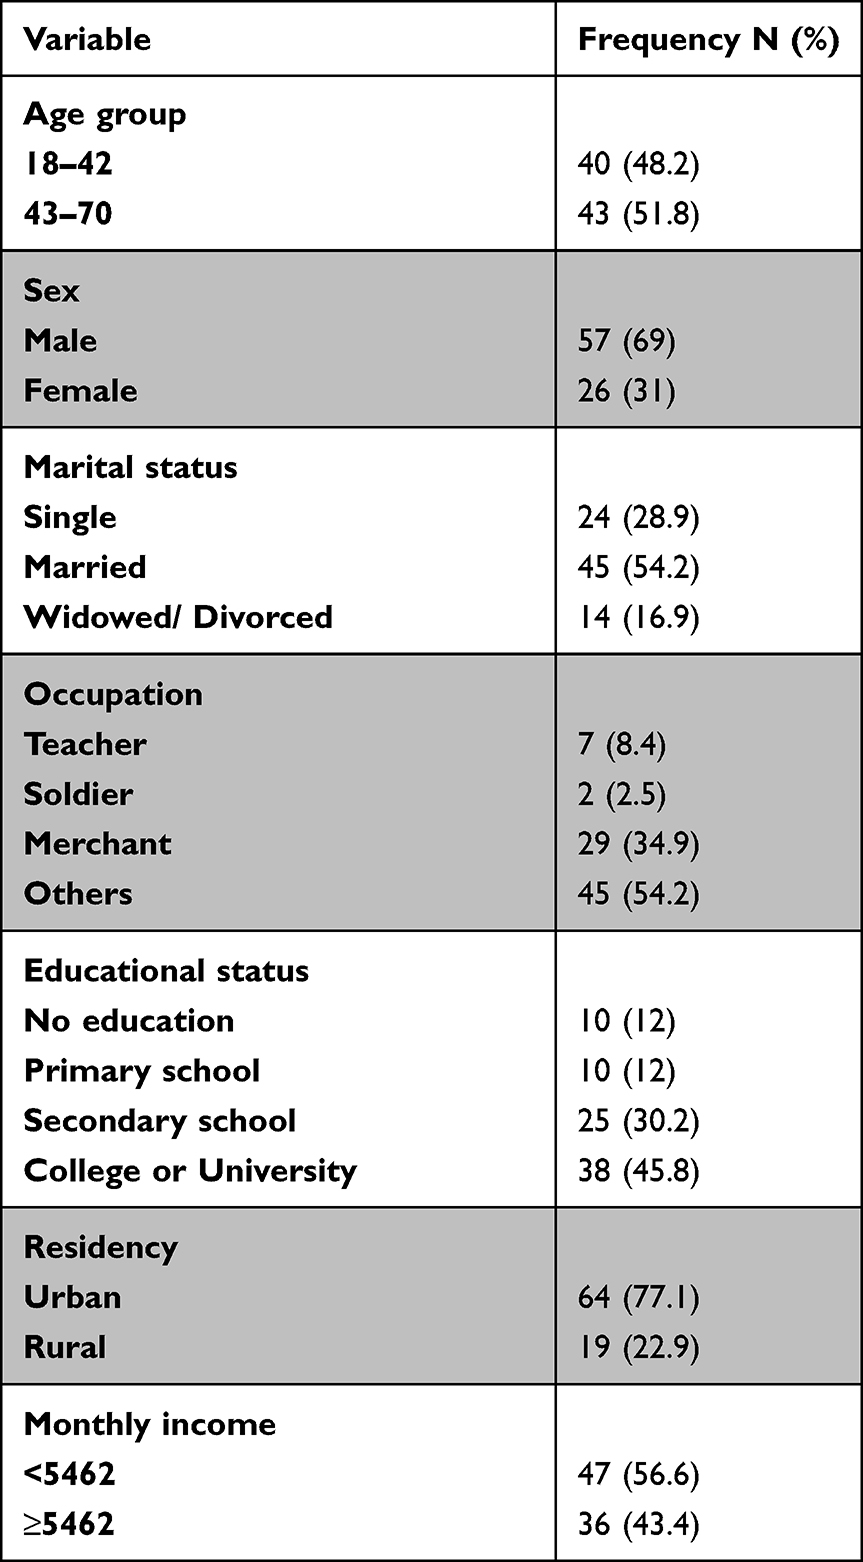 |
Table 1 Socio-Demographic Characteristics |
Clinical and Anthropometric Characteristics
RDW was ranged between 15.5% and 23.6% with a mean value of 17.40% ±1.46. Almost all patients (98.8%) had anisocytosis. Out of 83 patients, 55 (66.3%) were hypertensive, 17 (20.5%) had diabetes, and the remaining 11 (13.3%) had other diseases (glomerulonephritis and peripheral vascular disease) (Table 2). The mean value of GFR and MUAC was (5.20 mL/min ± 1.58) and (28.32cm ± 2.99) (Table 3).
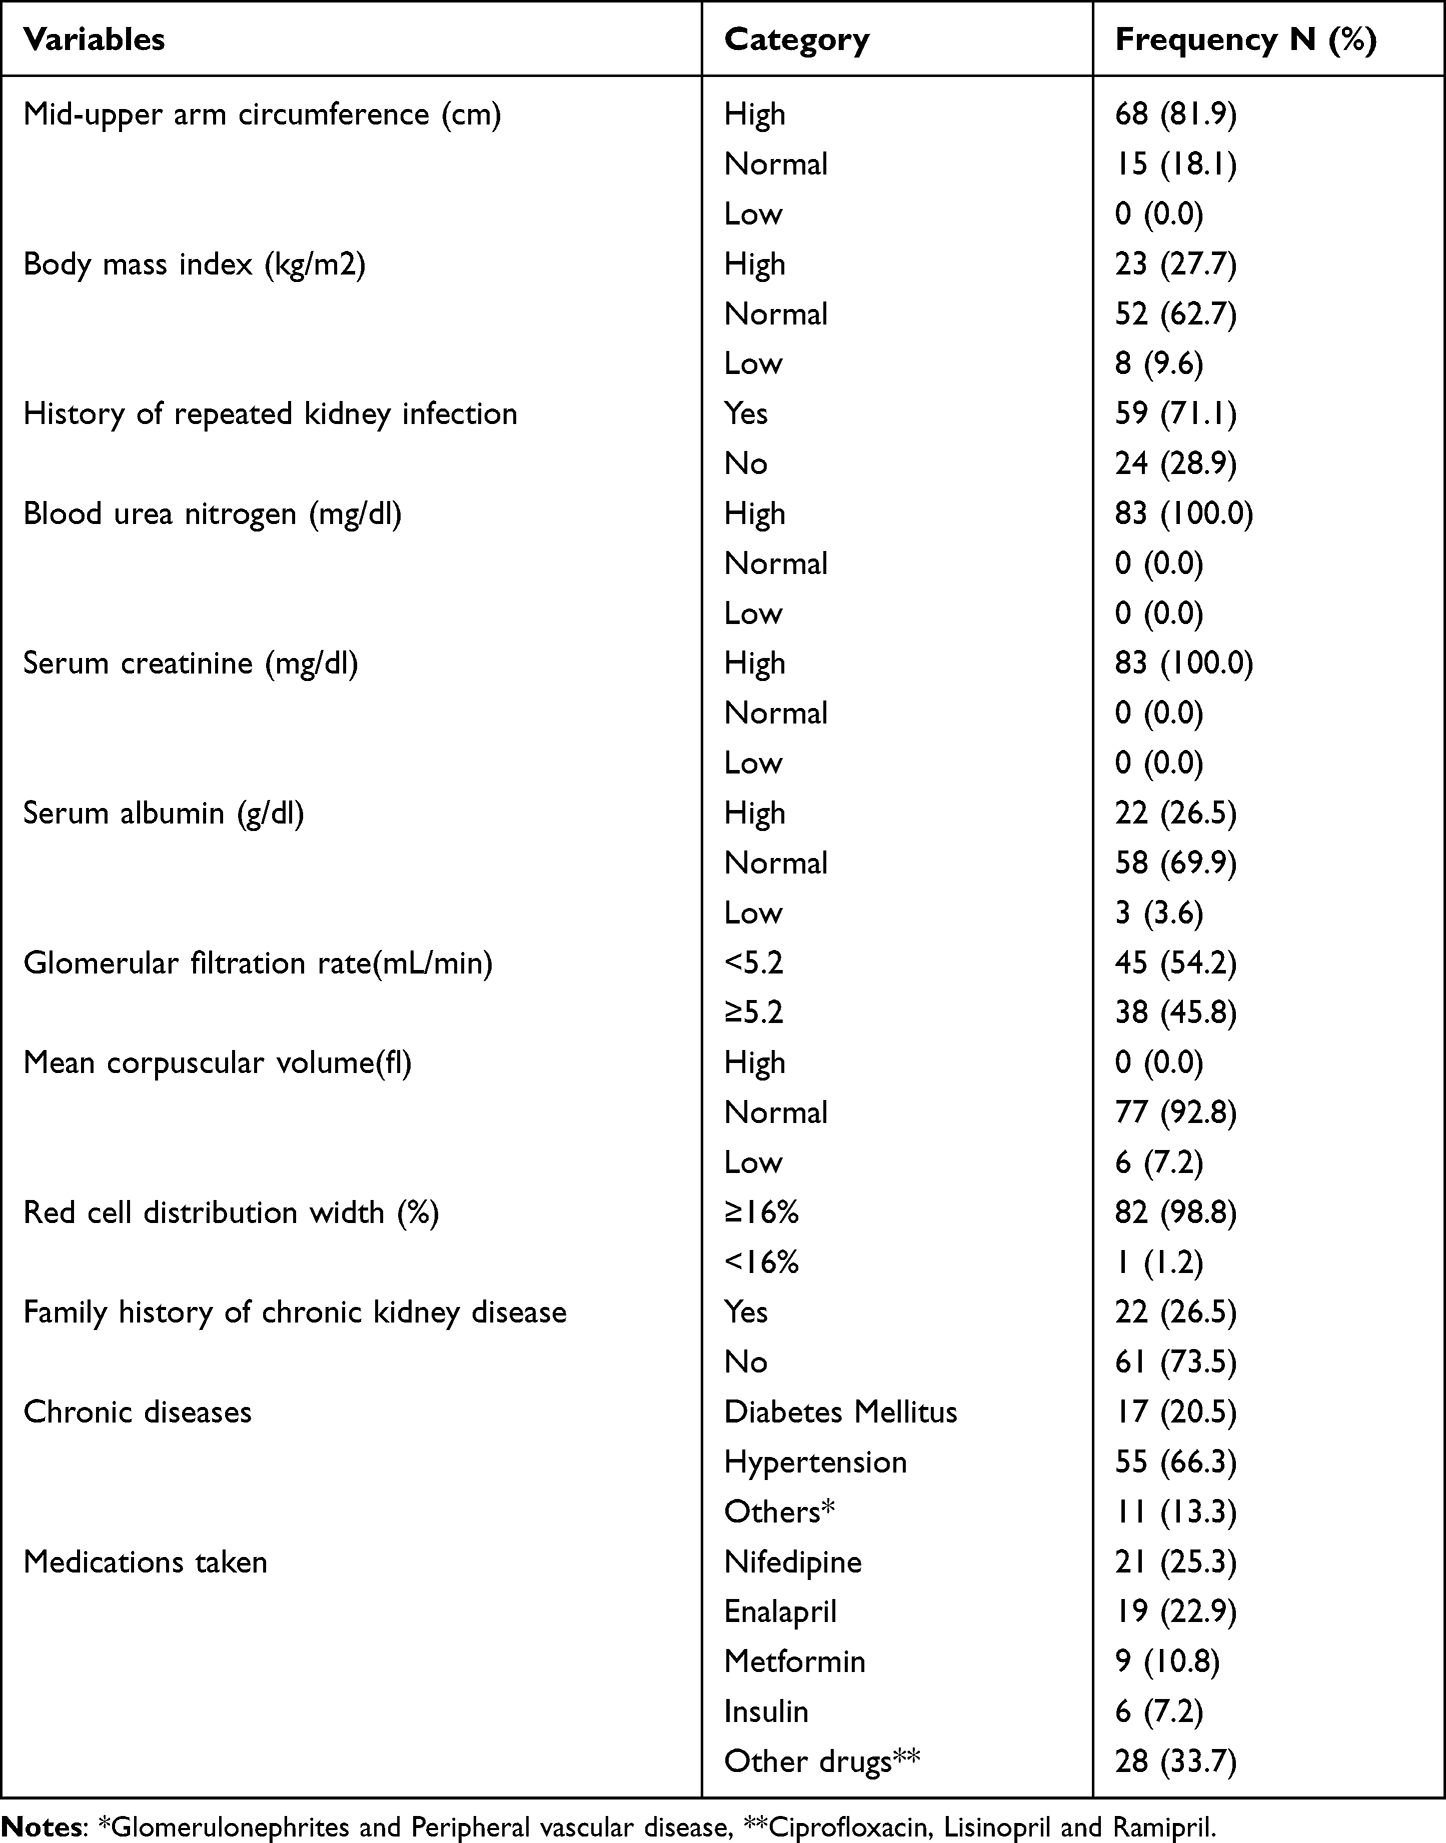 |
Table 2 Frequency Distribution of Clinical Parameters |
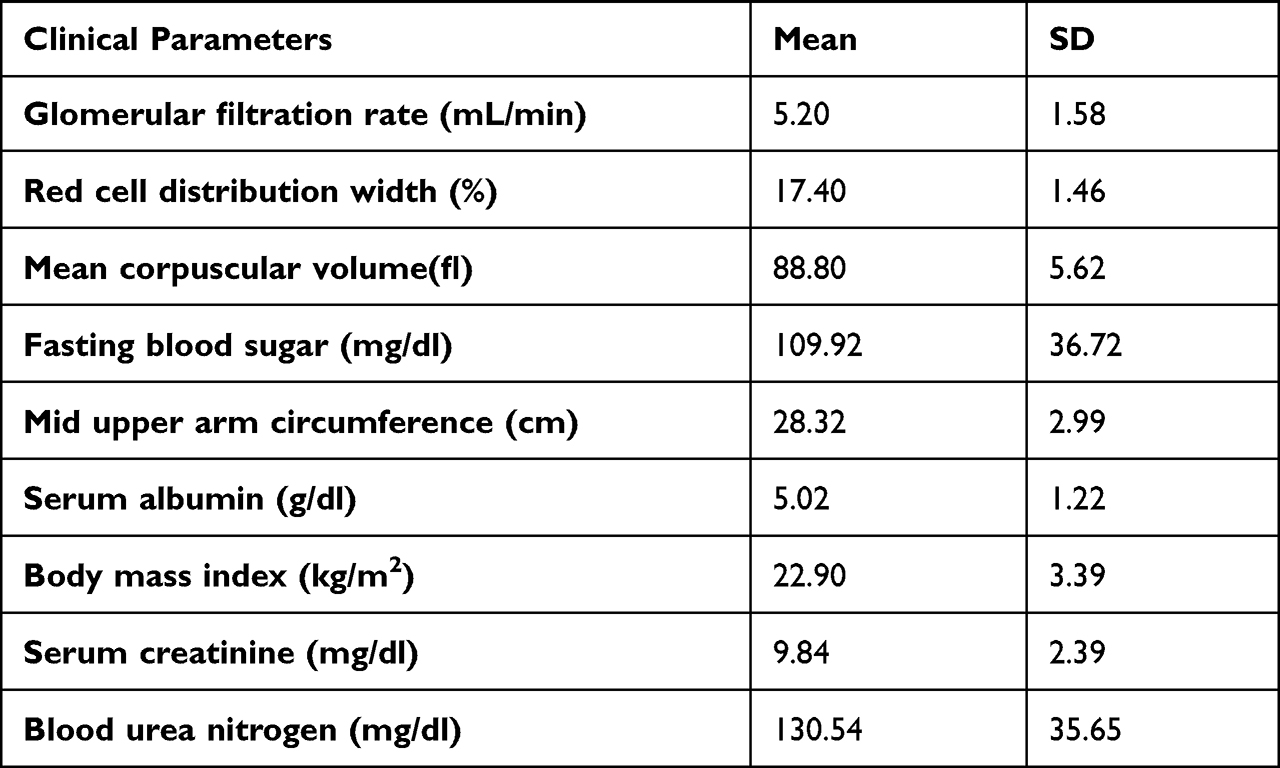 |
Table 3 Mean Values of Clinical Parameters |
Behavioral Characteristics
In this study, 9.6% of patients were smokers, 53.0% were alcoholics, 15.3% had a history of using traditional medicine, 4.8% use traditional medicines currently and 31.3% habitually chew Khat (Table 4).
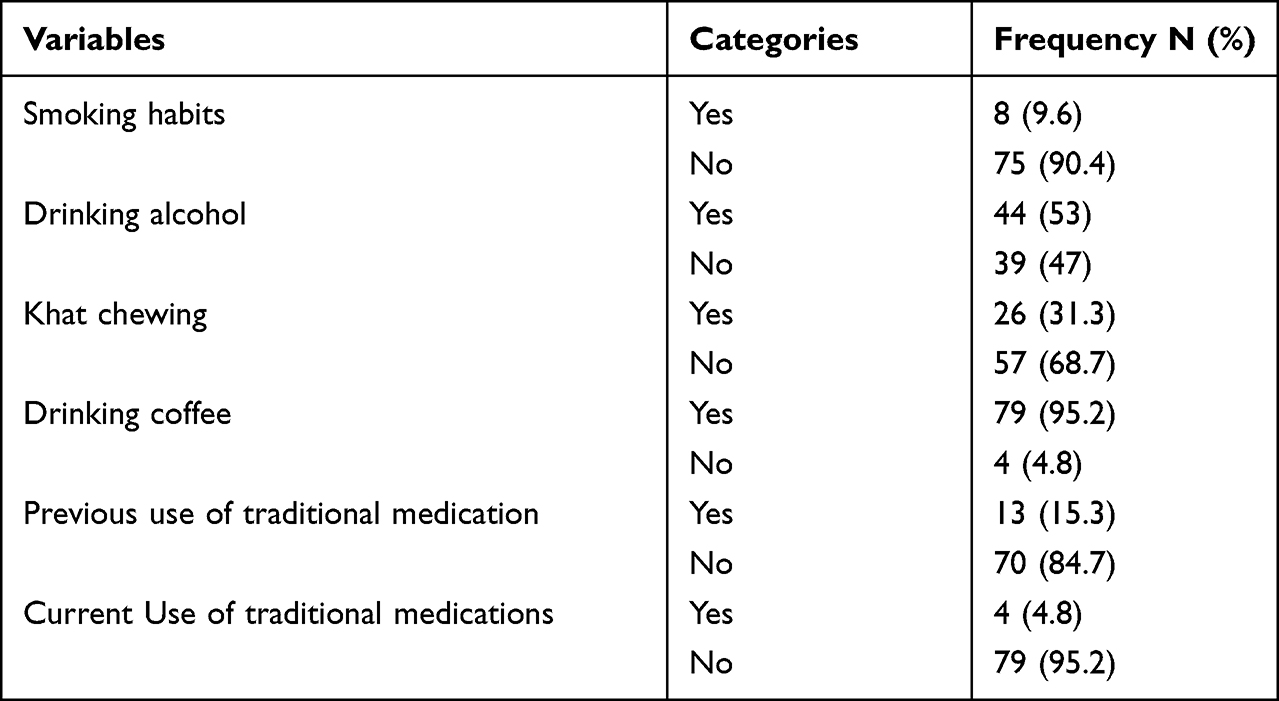 |
Table 4 Behavioral Characteristics |
Association Factors of RDW
Of patients with moderate anisocytosis, 25 of them had GFR < 5.20 mL/min and 30 had GFR > 5.20 mL/min. whereas of those with high anisocytosis, 20 had GFR < 5.20 mL/min and 8 had GFR > 5.20 mL/min. GFR (AOR=4.6, P=0.047, 95% CI [1.27, 20.74]), alcohol consumption (AOR=13.4, P=0.012, 95% CI [1.97, 22.62]), recurrent kidney disease (AOR=25.6, P=0.016, 95% CI [1.85, 53.71]), and use of antihypertensive and antidiabetic medications (AOR=0.2, P=0.044, 95% CI [0.03, 0.95]) showed a significant association with RDW (Table 5).
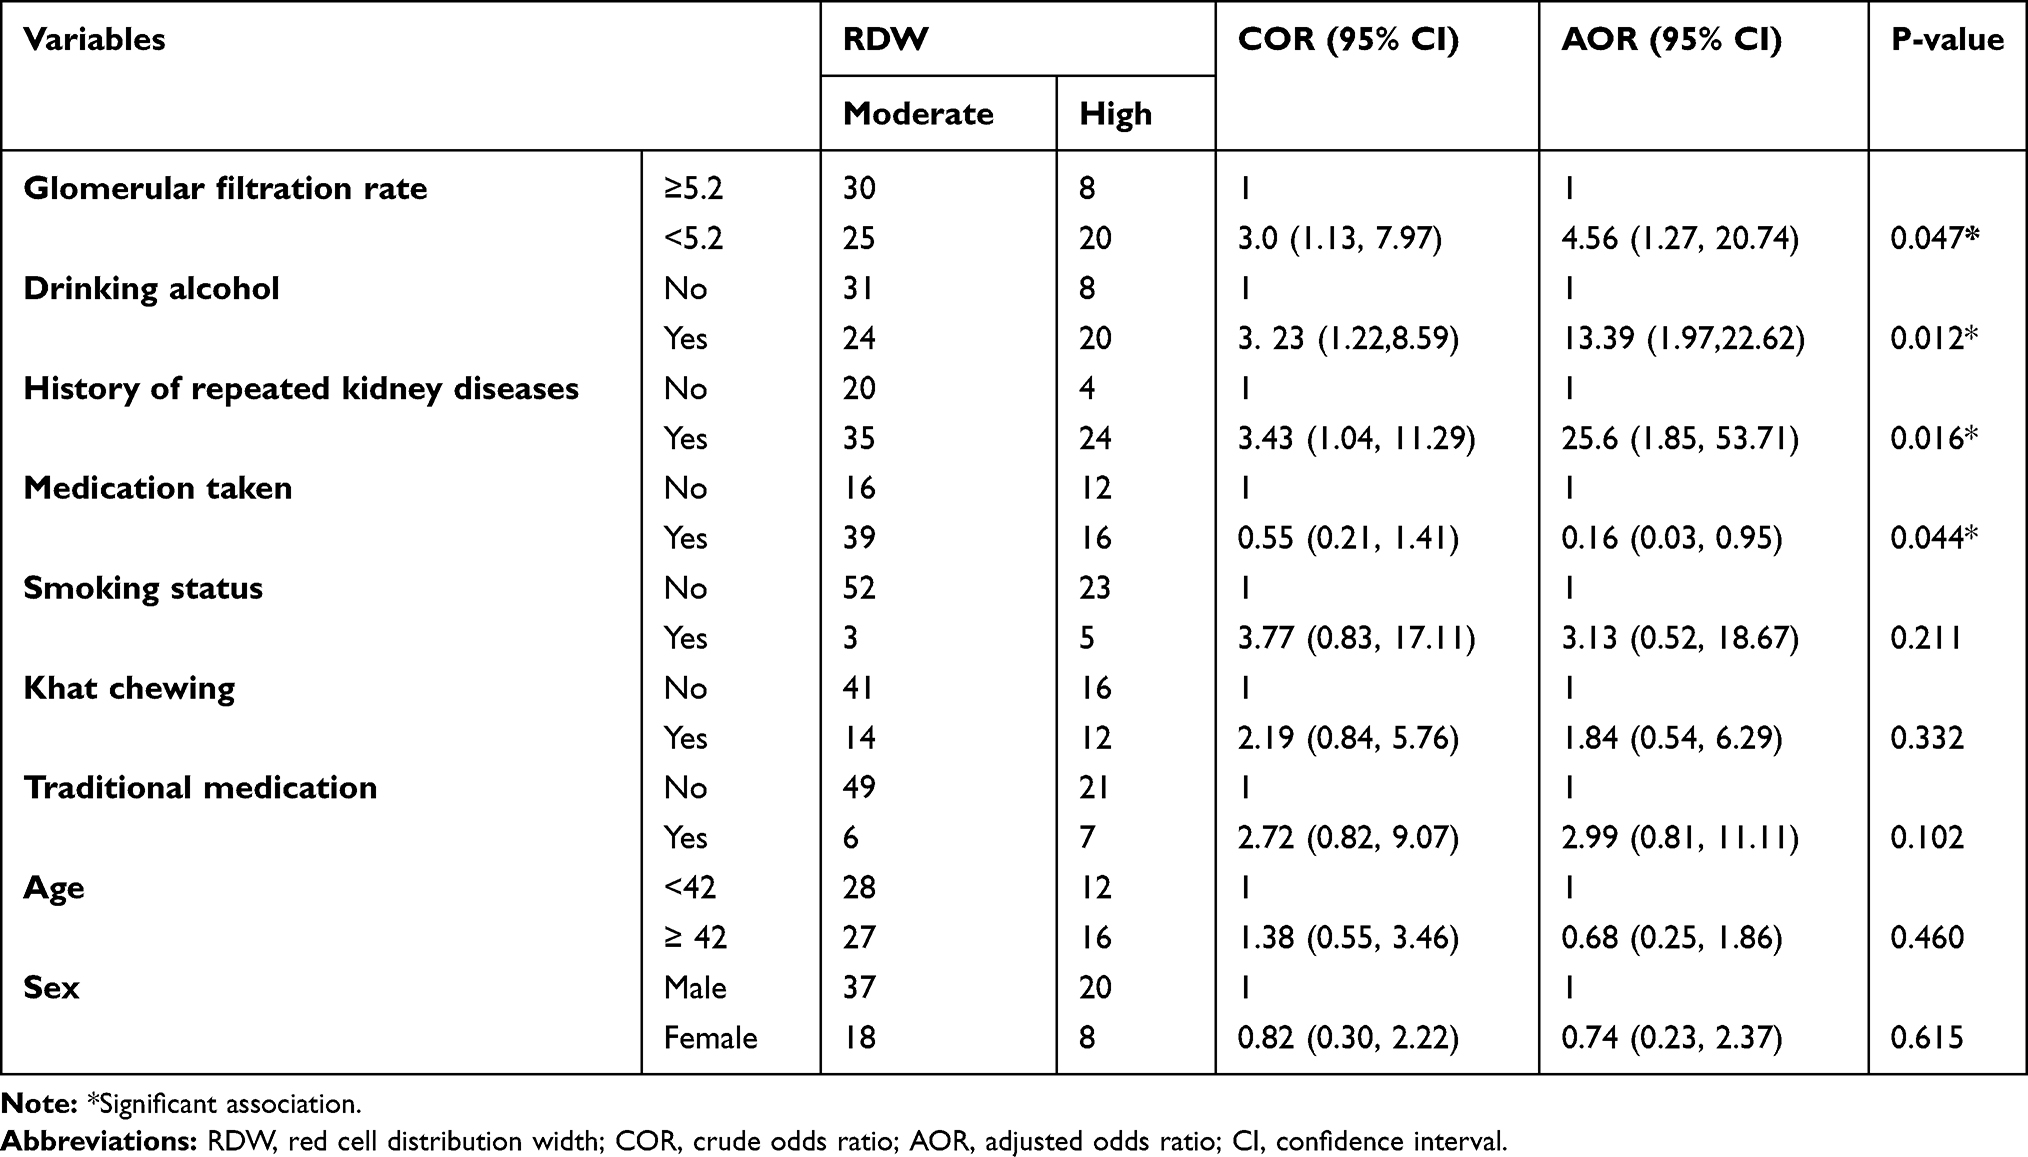 |
Table 5 Bivariate and Multivariate Logistic Regression Analysis of RDW and Other Variables |
Discussion
In this study, 66.3% of patients with ESRD had a prior diagnosis of hypertension and 20.5% had diabetes mellitus (Table 2), indicating that it may be hypertension that contributes to ESRD. In contrast to this study, a previously conducted study showed that 30% of patients with ESRD had diabetes mellitus, while only 21% of them had hypertension.34 In this earlier study, glomerulonephritis and CKD of unknown cause are a major cause of ESRD. In the United States, approximately 28% of elderly (over 65 years old) patients with clinically significant stage3–5 chronic kidney disease were neither diabetic nor hypertensive.29 This discrepancy between studies could be because the prevalence of hypertension in Ethiopia was high compared to diabetes and other glomerular diseases. In this study, reduced GFR (AOR=4.6, P=0.047, 95% CI [1.27, 20.74]), repeated renal infection (AOR=25.6, P=0.016, 95% CI [1.85, 53.71]), medication use (AOR=0.2, P=0.044, 95% CI [0.03, 0.95]), and alcohol consumption (AOR=13.4, P=0.012, 95% CI [1,97, 22.62]) were significantly associated with a high RDW (Table 5). In this study, low GFR was four times more likely to develop high RDW compared to high GFR. This result is consistent with other studies.5 A cross-sectional study was conducted in adult outpatients and showed an inverse association between RDW and renal function.24 The increase in RDW in patients with ESRD could be attributed to inflammation, stress response, malnutrition, and other comorbidities.49 According to a previous study,49 Inflammation plays an important role in increasing RDW in patients with ESRD. In addition, inflammatory cytokines such as interleukin-1 and interleukin-6, unregulated hepcidin that regulates iron hemostasis, are involved in RDW increase (67).
The second mechanism contributing to the higher RDW in patients with ESRD may be due to chronic hypoxia, oxidative stress, and endothelial dysfunction. A previously conducted study showed that RDW was autonomously associated with endothelial dysfunction and oxidative stress, which increases in patients with CKD, and oxidative stress can reduce red blood cell survival, inducing the release of premature and heterogenic shaped red blood cells.48
The third mechanism could be due to the increase in blood pressure and hyperglycemia in patients with ESRD. One of the risk factors for elevated blood pressure is wall tension. Wall tension contributes to the loss of normal red blood cell shape, resulting in increased levels of RDW.54 Long-term hyperglycemia contributes to loss of red blood cell size, which is worse in diabetics with kidney damage. The loss of the normal size of the RBCs further increases the fragility of the erythrocytes.50
In this study, there was a significant association between RDW and recurrent kidney disease in patients with ESRD. Repeat kidney infection was twenty-five times more likely to develop high RDW than a single non-repeated infection (Table 5). This is similar to a previous study that reported that patients with many different chronic diseases had a higher baseline RDW.53 The other factor that showed a significant association with the increase in RDW levels in this study was alcohol consumption. In patients with ESRD who consumed alcohol, the RDW level was 13 times higher than in patients who did not consume alcohol (Table 5). Although there is limited study of the association between alcohol consumption and RDW, alcohol metabolites such as acetaldehyde, which increase free radical formation such as reactive oxygen and nitrogen species, could be the possible mechanism. These free radicals interfere with the normal development of red blood cells, reduce their oxygen-carrying capacity and shorten the lifespan of these cells.50 In this study, taking antihypertensive and antidiabetic medication also had a significant association with decreased RDW. This study is similar to a study done in China that, insulin therapy, beta-blockers, and ACE-inhibitors were protective in decreasing the level of RDW.51 A significant association between serum albumin and RDW was not seen in this study, but the previous study reported that RDW was negatively correlated with serum albumin.42 In the other study, patients in the high RDW group had significantly more albumin and a longer period of T2DM diagnosis compared to a low RDW group.54 Although this difference occurred between studies, albumin and pre albumin are very poor predictors of nutritional status. Possible explanations for this were, first, that serum proteins such as albumin and pre albumin have not been included as defining characteristics of malnutrition, since evidence shows that serum levels of these proteins do not change in response to changes in nutrient intake, which shows no sensitivity. Specificity and reliability. Second, since serum albumin levels were time-averaged values over the year of hemodialysis, values from just a single measurement may not be representative of long-term nutritional status in this study population. The discrepancy in results could be due to differences in sample size, sociodemographic factors, the presence of comorbidity, and frequency of measurement of laboratory parameters, only once in this study but more than twice consecutively in other studies to investigate the relationship between nutritional statuses and to see RDW. In contrast to the previous study,55 RDW was not associated with age and gender (Table 5). In contrast, another study showed that there is a positive relationship between RDW and age. This is because older people are more likely to be deficient in nutrients than younger people who have comorbidities and those who have had inflammation.22 The discrepancy between these results could be due to variations in sample size and socio-demographic characteristics. Not enough older people participated in this study. Although the frequency of males with high RDW was higher than females in this study, gender has no significant association with RDW. Similar to this finding, another study showed that there was no association between RDW in either sex.57 Conversely to this finding, a larger RDW was associated with a higher risk of morbidity in males compared to females.37 On the other hand, a study has shown that women have a statistically significantly higher RDW value compared to men.49 Women are more likely to have folic acid deficiency and menorrhagia (one of the most common complaints in women of childbearing age), which can lead to increased levels of RDW.49 This is because only twenty-six female patients with end-stage renal disease were involved during the study period. Blood pressure, body mass index, diabetes, and inflammatory diseases were significantly associated with RDW.58 A previous study of 513 patients with essential hypertension reported that a statistically significant association was found between RDW and blood pressure and albumin after adjusting for potential confounders such as age and gender.25 But in this study, no significant association was observed between RDW and hypertension, diabetes mellitus, and BMI. The differences between these studies, particularly those related to factors considered risky for this study, have been matched in other studies. The other reason could be that the sample size (83) was small in this study compared to another study (513).25 Smoking had no significant association with RDW in this study (Table 5). In contrast to this study, higher RDW values were found in smokers.51 The mechanism that explains RDW’s relationship to smoking is that chronic inflammation appears to be the driving factor. Hs-CRP levels, a well-established surrogate marker of inflammation, as well as numerous other inflammatory markers such as interleukin-6 and soluble tumor necrosis factor-alpha, VCAM-1, ICAM-1, and E-selectin have been independently associated with smoking.51 Although this explanation was accepted, the differences between the studies could be due to the fact that the number of patients who smoked cigarettes was small compared to others. In conclusion, RDW showed a significant association with GFR, recurrent kidney disease, alcohol consumption, and use of antidiabetic and antihypertensive drugs. As shown by the adjusted odds ratio, reduced GFR, recurrent kidney disease, and alcohol consumption were more likely to result in a high RDW, while medication taken was the protective factor. The mechanisms of RDW disruption in patients with ESRD need further investigation.
Acknowledgments
We thank the staff of the Department of Physiology, Faculty of Medicine, Addis Ababa University for their collaboration. We also thank volunteers who participated in this study. Finally, we would also like to express our appreciation for Debre Berhan University.
Author Contributions
All authors made significant contributions to the reported work, whether in conception, study design, implementation, data collection, analysis and interpretation, or all of these areas; were involved in drafting, revising, or critically reviewing the article; give final approval of the version to be published; agreed on the journal to which the article was submitted; and agreed to be responsible for all aspects of the work.
Disclosure
This paper was done for the fulfilment of Master’s Degree in Medical Physiology from Addis Ababa University. Since it is a must to give a full thesis after successful defense for Addis Ababa University Library to put it online for the purpose of reading for students. So that it is available online in Addis Ababa University Library Circulation. But it is our original work paper which is not a published yet. The authors declare no conflicts of interest in relation to this, and all authors are responsible for the content and writing of this document.
References
1. Lou Y, Wang M, Mao W. Clinical usefulness of measuring red blood cell distribution width in patients with hepatitis B. PLoS One. 2012;7(5):e37644. doi:10.1371/journal.pone.0037644
2. Aung N, Ling HZ, Cheng AS, et al. Expansion of the red cell distribution width and evolving iron deficiency as predictors of poor outcome in chronic heart failure. Int J Cardiol. 2013;168(3):1997–2002. doi:10.1016/j.ijcard.2012.12.091
3. Montagnana M, Danese E. Red cell distribution width and cancer. Ann Transl Med. 2016;4:20. doi:10.21037/atm.2016.10.50
4. Montagnana M, Cervellin G, Meschi T, Lippi G. The role of red blood cell distribution width in cardiovascular and thrombotic disorders. Clin Chem Lab Med. 2012;50(4):635–641. doi:10.1515/cclm.2011.831
5. Hsieh YP, Tsai SM, Chang CC, Kor CT, Lin CC. Association between red cell distribution width and mortality in patients undergoing continuous ambulatory peritoneal dialysis. Sci Rep. 2017;7(1):1–9. doi:10.1038/srep45632
6. Yuen SK, Suen HP, Kwok OL, Yong SP, Tse MW. Advance care planning for 600 Chinese patients with end-stage renal disease. Hong Kong J Nephrol. 2016;19:19–27. doi:10.1016/j.hkjn.2016.04.001
7. Solak Y, Gaipov A, Turk S, et al. Red cell distribution width is independently related to endothelial dysfunction in patients with chronic kidney disease. Am J Med Sci. 2014;347(2):118–124. doi:10.1097/MAJ.0b013e3182996a96
8. Thorsteinsdottir B, Swetz KM, Feely MA, Mueller PS, Williams AW. Are there alternatives to hemodialysis for the elderly patient with end-stage renal failure? In: Mayo Clinic Proceedings. Elsevier; 2012:514–516.
9. Vashistha T, Streja E, Molnar MZ, et al. Red cell distribution width and mortality in hemodialysis patients. Am J Kidney Dis. 2016;68(1):110–121. doi:10.1053/j.ajkd.2015.11.020
10. Perkins SL. Examination of the Blood and Bone Marrow. Wintrobe’s Clinical Hematology. Philadelphia: Lippincot William, Co; 1998:9–35.
11. Perlstein TS, Weuve J, Pfeffer MA, Beckman JA. Red blood cell distribution width and mortality risk in a community-based prospective cohort. Arch Intern Med. 2009;169(6):588–594. doi:10.1001/archinternmed.2009.55
12. Felker GM, Allen LA, Pocock SJ, et al. Red cell distribution width as a novel prognostic marker in heart failure: data from the CHARM Program and the Duke Databank. J Am Coll Cardiol. 2007;50(1):40–47. doi:10.1016/j.jacc.2007.02.067
13. Tonelli M, Sacks F, Arnold M, Moye L, Davis B, Pfeffer M. Relation between red blood cell distribution width and cardiovascular event rate in people with coronary disease. Circulation. 2008;117(2):163–168. doi:10.1161/CIRCULATIONAHA.107.727545
14. Ani C, Ovbiagele B. Elevated red blood cell distribution width predicts mortality in persons with known stroke. J Neurol Sci. 2009;277(1–2):103–108. doi:10.1016/j.jns.2008.10.024
15. Mucsi I, Ujszaszi A, Czira ME, Novak M, Molnar MZ. Red cell distribution width is associated with mortality in kidney transplant recipients. Int Urol Nephrol. 2014;46(3):641–651. doi:10.1007/s11255-013-0530-z
16. Oh HJ, Park JT, Kim JK, et al. Red blood cell distribution width is an independent predictor of mortality in acute kidney injury patients treated with continuous renal replacement therapy. Nephrol Dial Transplant. 2012;27(2):589–594. doi:10.1093/ndt/gfr307
17. Afonso L, Zalawadiya SK, Veeranna V, Panaich SS, Niraj A, Jacob S. Relationship between red cell distribution width and microalbuminuria: a population-based study of multiethnic representative US adults. Nephron Clin Pract. 2011;119(4):c277–82. doi:10.1159/000328918
18. Roumeliotis S, Mallamaci F, Zoccali C. Endothelial dysfunction in chronic kidney disease, from biology to clinical outcomes: a 2020 update. J Clinl Med. 2020;9(8):2359. doi:10.3390/jcm9082359
19. Liakopoulos V, Roumeliotis S, Zarogiannis S, Eleftheriadis T, Mertens PR. Oxidative stress in hemodialysis: causative mechanisms, clinical implications, and possible therapeutic interventions. In: Seminars in Dialysis. Wiley Online Library; 2019:58–71.
20. System URD. USRDS 2013 annual data report: atlas of chronic kidney disease and end-stage renal disease in the United States. National Institutes of Health, National Institute of Diabetes and Digestive and Digestive and Kidney Diseases; 2013.
21. Dereje D. Using microalbuminuria as early screening tool for prevention of renal disease progression in diabetes mellitus: a review article of current insights. EC Microbiol. 2021;17:35–40.
22. Prabahar MR, Chandrasekaran V, Soundararajan P. Epidemic of chronic kidney disease in India-what can be done? Saudi J Kidney Dis Transpl. 2008;19(5):847.
23. Lippi G, Targher G, Montagnana M, Salvagno GL, Zoppini G, Guidi GC. Relationship between red blood cell distribution width and kidney function tests in a large cohort of unselected outpatients. Scand J Clin Lab Invest. 2008;68(8):745–748. doi:10.1080/00365510802213550
24. Patel KV, Ferrucci L, Ershler WB, Longo DL, Guralnik JM. Red blood cell distribution width and the risk of death in middle-aged and older adults. Arch Intern Med. 2009;169(5):515–523. doi:10.1001/archinternmed.2009.11
25. Li ZZ, Chen L, Yuan H, Zhou T, Kuang ZM. Relationship between red blood cell distribution width and early-stage renal function damage in patients with essential hypertension. J Hypertens. 2014;32(12):2450–2456. doi:10.1097/HJH.0000000000000356
26. Zhang M, Zhang Y, Li C, He L. Association between red blood cell distribution and renal function in patients with untreated type 2 diabetes mellitus. Ren Fail. 2015;37(4):659–663. doi:10.3109/0886022X.2015.1010938
27. Elsharif ME. The mortality rate of patients with end-stage renal disease on regular hemodialysis: a single-center study. Saudi J Kidney Dis Transpl. 2011;22(3):594.
28. Eknoyan G, Hostetter T, Bakris GL, et al. Proteinuria and other markers of chronic kidney disease: a position statement of the national kidney foundation (NKF) and the national institute of diabetes and digestive and kidney diseases (NIDDK) 1. Am J Kidney Dis. 2003;42(4):617–622. doi:10.1016/S0272-6386(03)00826-6
29. Bakris G, Collins AJ. Executive summary: Kidney Early Evaluation Program (KEEP) 2007 annual data report. Am J Kidney Dis. 2008;51(4):S1–2. doi:10.1053/j.ajkd.2008.01.015
30. Sharma SK, Zou H, Togtokh A, et al. Burden of CKD, proteinuria, and cardiovascular risk among Chinese, Mongolian, and Nepalese participants in the International Society of Nephrology screening programs. Am J Kidney Dis. 2010;56(5):915–927. doi:10.1053/j.ajkd.2010.06.022
31. Eggers PW. Has the incidence of end-stage renal disease in the USA and other countries stabilized? Curr Opin Nephrol Hypertens. 2011;20(3):241–245. doi:10.1097/MNH.0b013e3283454319
32. Chertow GM, Burdick E, Honour M, Bonventre JV, Bates DW. Acute kidney injury, mortality, length of stay, and costs in hospitalized patients. J Am Soc Nephrol. 2005;16(11):3365–3370. doi:10.1681/ASN.2004090740
33. Stanifer JW, Muiru A, Jafar TH, Patel UD. Chronic kidney disease in low-and middle-income countries. Nephrol Dial Transplant. 2016;31(6):868–874. doi:10.1093/ndt/gfv466
34. Alemu H, Hailu W, Adane A. Prevalence of chronic kidney disease and associated factors among patients with diabetes in northwest Ethiopia: a hospital-based cross-sectional study. Curr Ther Res. 2020;Jan(92):100578. doi:10.1016/j.curtheres.2020.100578
35. Bekele MM. Prevalence and associated factors of chronic kidney disease among diabetic patients that attend public hospitals of Addis Ababa [Ph.D. Thesis]. Addis Ababa University; 2016.
36. Evans TC, Jehle D. The red blood cell distribution width. J Emerg Med. 1991;9:71–74. doi:10.1016/0736-4679(91)90592-4
37. Zalawadiya SK, Veeranna V, Panaich SS, Afonso L, Ghali JK. Gender and ethnic differences in red cell distribution width and its association with mortality among low risk healthy United State adults. Am J Cardiol. 2012;109(11):1664–1670. doi:10.1016/j.amjcard.2012.01.396
38. Al-Najjar Y, Goode KM, Zhang J, Cleland JG, Clark AL. Red cell distribution width: an inexpensive and powerful prognostic marker in heart failure. Eur J Heart Fail. 2009;11(12):1155–1162. doi:10.1093/eurjhf/hfp147
39. Azab B, Torbey E, Hatoum H, et al. Usefulness of red cell distribution width in predicting all-cause long-term mortality after non-ST-elevation myocardial infarction. Cardiology. 2011;119(2):72–80. doi:10.1159/000329920
40. Ye Z, Smith C, Kullo IJ. Usefulness of red cell distribution width to predict mortality in patients with peripheral artery disease. Am J Cardiol. 2011;107(8):1241–1245. doi:10.1016/j.amjcard.2010.12.023
41. Zhang Z, Xu X, Ni H, Deng H. Red cell distribution width is associated with hospital mortality in unselected critically ill patients. J Thorac Dis. 2013;5(6):730. doi:10.3978/j.issn.2072-1439.2013.11.14
42. Tekce H, Kin tekce B, Aktas G, Tanrisev M, Sit M. The evaluation of red cell distribution width in chronic hemodialysis patients. Int J Nephrol. 2014;2014. doi:10.1155/2014/754370
43. Malandrino N, Wu WC, Taveira TH, Whitlatch HB, Smith RJ. Association between red blood cell distribution width and macrovascular and microvascular complications in diabetes. Diabetologia. 2012;55(1):226–235. doi:10.1007/s00125-011-2331-1
44. Wilund KR, Tomayko EJ, Wu PT, et al. Intradialytic exercise training reduces oxidative stress and epicardial fat: a pilot study. Nephrol Dial Transplant. 2010;25(8):2695–2701. doi:10.1093/ndt/gfq106
45. Yonemoto S, Hamano T, Fujii N, et al. Red cell distribution width and renal outcome in patients with non-dialysis-dependent chronic kidney disease. PLoS One. 2018;13(6):e0198825. doi:10.1371/journal.pone.0198825
46. Bilal A, Farooq JH, Kiani I, Assad S, Ghazanfar H, Ahmed I. Importance of mean red cell distribution width in hypertensive patients. Cureus. 2016;8(11). doi:10.7759/cureus.902
47. Vayá A, Alis R, Hernandez-Mijares A, et al. Red blood cell distribution width is not related with inflammatory parameters in morbidly obese patients. Clin Biochem. 2014;47(6):464–466. doi:10.1016/j.clinbiochem.2014.01.020
48. Vaya A, Alis R, Romagnoli M, et al. Rheological blood behavior is not only influenced by cardiovascular risk factors but also by aging itself. Research into 927 healthy Spanish Mediterranean subjects. Clin Hemorheol Microci. 2013;54(3):287–296. doi:10.3233/CH-131734
49. Finnamore H, Le Couteur J, Hickson M, Busbridge M, Whelan K, Shovlin CL. Hemorrhage-adjusted iron requirements, hematinics and hepcidin define hereditary hemorrhagic telangiectasia as a model of hemorrhagic iron deficiency. PLoS One. 2013;8(10):e76516. doi:10.1371/journal.pone.0076516
50. Waris S, Patel A, Ali A, Mahmood R. Acetaldehyde-induced oxidative modifications and morphological changes in isolated human erythrocytes: an in vitro study. Environ Sci Pollut Res. 2020;27(14):16268–16281. doi:10.1007/s11356-020-08044-4
51. Kurtoğlu E, Aktürk E, Korkmaz H, et al. Elevated red blood cell distribution width in healthy smokers. Turk Kardiyol Dern Ars. 2013;41(3):199–206.
52. Barsoum RS. Chronic kidney disease in the developing world. N Engl J Med. 2006;354(10):997–999. doi:10.1056/NEJMp058318
53. Fiseha T, Ahmed E, Chalie S, Gebreweld A. Prevalence and associated factors of impaired renal function and albuminuria among adult patients admitted to a hospital in Northeast Ethiopia. PLoS One. 2021;16(2):e0246509. doi:10.1371/journal.pone.0246509
54. Roumeliotis S, Stamou A, Roumeliotis A, et al. Red blood cell distribution width is associated with deterioration of renal function and cardiovascular morbidity and mortality in patients with diabetic kidney disease. Life. 2020;10(11):301. doi:10.3390/life10110301
55. Yousefi B, Sanaie S, Ghamari AA, Soleimanpour H, Karimian A, Mahmoodpoor A. Red cell distribution width as a novel prognostic marker in multiple clinical studies. Indian J Crit Care Med. 2020;24(1):49. doi:10.5005/jp-journals-10071-23328
56. Lee P, Peng H, Gelbart T, Wang L, Beutler E. Regulation of hepcidin transcription by interleukin-1 and interleukin-6. Proc Natl Acad Sci USA. 2005;102(6):1906–1910. doi:10.1073/pnas.0409808102
57. Zhang C, Meng Z, Li X, et al. No associations exists between red blood cell distribution width and serum uric acid in both sexes. Medicine. 2018;97:40.
58. Pilling LC, Atkins JL, Duff MO, et al. Red blood cell distribution width: genetic evidence for aging pathways in 116,666 volunteers. PLoS One. 2017;12(9):e0185083. doi:10.1371/journal.pone.0185083
 © 2022 The Author(s). This work is published and licensed by Dove Medical Press Limited. The full terms of this license are available at https://www.dovepress.com/terms.php and incorporate the Creative Commons Attribution - Non Commercial (unported, v3.0) License.
By accessing the work you hereby accept the Terms. Non-commercial uses of the work are permitted without any further permission from Dove Medical Press Limited, provided the work is properly attributed. For permission for commercial use of this work, please see paragraphs 4.2 and 5 of our Terms.
© 2022 The Author(s). This work is published and licensed by Dove Medical Press Limited. The full terms of this license are available at https://www.dovepress.com/terms.php and incorporate the Creative Commons Attribution - Non Commercial (unported, v3.0) License.
By accessing the work you hereby accept the Terms. Non-commercial uses of the work are permitted without any further permission from Dove Medical Press Limited, provided the work is properly attributed. For permission for commercial use of this work, please see paragraphs 4.2 and 5 of our Terms.