")
Back to Journals » Cancer Management and Research » Volume 13
Distribution of Peripheral Blood Cells in Esophageal Cancer Patients During Concurrent Chemoradiotherapy Predicts Long-Term Locoregional Progression Hazard After Treatment (GASTO1072)
Authors Xu L, Chen J, Guo H, Huang R , Guo L, Yu II Y, Zhai T, Wu F, Chen Z, Li D , Chen C
Received 25 February 2021
Accepted for publication 4 May 2021
Published 25 May 2021 Volume 2021:13 Pages 4203—4215
DOI https://doi.org/10.2147/CMAR.S307695
Checked for plagiarism Yes
Review by Single anonymous peer review
Peer reviewer comments 2
Editor who approved publication: Professor Seema Singh
Liangyu Xu,1,2,* Jianzhou Chen,1,* Hong Guo,1 Ruihong Huang,1 Longjia Guo,1 Yuanxiang Yu II,1 Tiantian Zhai,1 Fangcai Wu,1 Zhijian Chen,1,3 Derui Li,1 Chuangzhen Chen1
1Department of Radiation Oncology, Cancer Hospital of Shantou University Medical College, Shantou, 515031, People’s Republic of China; 2Department of Radiation Oncology, Dongguan Tungwah Hospital, Dongguan, 523110, People’s Republic of China; 3Department of Radiation Oncology, National Cancer Center/National Clinical Research Center for Cancer, Cancer Hospital, Chinese Academy of Medical Sciences and Peking Union Medical College, Shenzhen, 518116, People’s Republic of China
*These authors contributed equally to this work
Correspondence: Chuangzhen Chen
Department of Radiation Oncology, Cancer Hospital of Shantou University Medical College, 7 Raoping Road, Shantou, Guangdong, 515031, People’s Republic of China
Tel/Fax +86 754 88555844
Email [email protected]
Purpose: Predicting the response to chemoradiotherapy is critical for the optimal management of esophageal cancer; however, it remains an unmet clinical need. This study aimed to evaluate the predictive potential of peri-treatment peripheral blood cells (PBC) in disease progression hazard in esophageal cancer following chemoradiotherapy.
Patients and Methods: A total of 87 patients with primary esophageal squamous cell carcinoma were subjected to definitive concurrent chemoradiotherapy in a Phase II trial. PBC parameters (hemoglobin, neutrophils, platelets, lymphocytes, and monocytes) were collected at seven time points throughout the course of radiotherapy. The potential of peri-treatment PBC parameters to predict the 3-year cumulative hazard of tumor progression was evaluated.
Results: Patients with disease progression displayed distinct distribution patterns of peri-treatment PBC compared to that in patients without disease progression. Greater prediction capabilities for risk of locoregional disease progression were found in PBC collected after the start of radiotherapy compared to those in their pretreatment counterparts, and in individual parameters rather than cell-to-cell ratios. The most predictive PBC parameters were integrated by summation and designated as a PBC score (PBCS), which further augmented their predictive power. Patients classified according to their PBCS (high vs medium v. low) had significantly different 3-year cumulative hazards of locoregional progression (58% vs 29% vs 7%, P = 0.0017). Multivariate analysis confirmed that high PBCS (HR, 12.2; 95% CI, 2.0– 76.3; P = 0.007) and medium (HR, 5.8; 95% CI 1.2– 27.7; P = 0.028) were independent indicators of locoregional progression.
Conclusion: Systematic analysis of PBC distribution in esophageal cancer patients undergoing definitive chemoradiotherapy could help predict long-term locoregional progression hazard after treatment.
Keywords: peripheral blood cell parameters, integration, discriminatory capacity, tumor control failure, esophageal squamous cell carcinoma, chemoradiotherapy
Introduction
Esophageal cancer (EC) is one of the deadliest malignant diseases. It was estimated that there were approximately 572,000 new cases of EC, and more than 500,000 patients died due to this disease in 2018, worldwide.1 Concurrent chemoradiotherapy (CCRT) has gradually become the standard for nonsurgical treatment of locoregional EC. Locoregional tumor control is achieved in approximately half of the patients, whereas the other half eventually experience recurrence.2–4 Heterogeneity in response to CCRT in patients reflects the complexity of EC and poses a great challenge to clinicians. To address this issue, it is critical to be able to predict the hazard of disease progression in patients after CCRT, enabling timely and more specific intervention in patients with a high risk of tumor control failure and allowing low-risk patients to be spared from unnecessary treatment.
Predicting the response to CCRT in patients with EC is an area of great interest. Studies have examined a variety of means, including functional imaging (eg, Fluorine-18-fluorodeoxyglucose positron emission tomography/computed tomography [18F FDG PET/CT]), clinical parameters (eg, tumor stage), and biomarkers in tumor samples.5–9 These factors have been shown to correlate with the treatment outcomes of EC patients to some extent. However, none of these methods have become standards or have been widely used for clinical patient stratification or decision-making, as each of them has weaknesses and limitations. Thus, the prediction of patient response to CCRT for EC remains an unmet clinical need, and novel methods that are both accurate and cost-effective are needed.
Complete blood count is a routine clinical examination in patients undergoing CCRT. This test quantifies various peripheral blood cell (PBC) parameters, including hemoglobin as a surrogate for red blood cells, neutrophils, platelets, lymphocytes, and monocytes. There is a growing body of evidence suggesting that these PBC parameters, either singly or as ratios, correlate with treatment outcomes of cancer patients.10–13 Consistently, it has been shown that EC patients with high neutrophil-to-lymphocyte ratio (NLR) or platelet-to-lymphocyte ratio (PLR) are associated with unfavorable outcomes after various treatments, including CCRT.14–19 The prognostic implications of PBC parameters in EC patients and their clinical availability render them attractive candidates for the prediction of tumor control. However, it remains to be determined whether PBC parameters independently correlate with the long-term hazard of disease progression in patients with EC following CCRT. Moreover, efforts are warranted to maximize their predictive potential, as the reported correlations between PBC parameters and patient survival are relatively modest.10–15
The majority of previous studies have relied solely on pretreatment PBC parameters,10–13 while emerging data suggest that radiation therapy (RT) can trigger an anti-tumor immune response, which plays an important role in determining tumor response to RT in animal models.20–24 Studies also indicate that the local immune response interplays with systemic inflammation, which consists of a variety of circulating inflammatory factors, including PBC parameters.25 Thus, changes in PBC parameters after RT may add substantial input to their predictive capacity for patient outcomes. Furthermore, RT-induced immune responses appear to be transient in animal models, indicating that prompt assessment of PBC parameters after RT may better reflect the ongoing immune response. However, it is difficult to determine a specific time point for PBC assessment in patients. Definitive RT generally takes 5–7 weeks, and the crosstalk between the local immune response and systemic reactions during this period is still not understood. Therefore, a more comprehensive analysis of PBC parameters with multiple assessments during radiotherapy (peri-treatment) may help to better evaluate their predictive value.
We launched a phase II clinical trial in 2012, in which patients with esophageal squamous cell carcinoma were subjected to definitive CCRT with radiation dose escalation. One of the objectives of this trial was to explore the predictive potential of peri-treatment PBC parameters for tumor control. PBC assessment was performed at seven time points throughout the course of RT. We hypothesized that systematic assessment of peri-treatment PBC parameters might provide a predictive tool to evaluate disease progression hazard in patients following treatment. Herein, we report the results of this prospective cohort study. We found that peri-treatment PBC had moderate potential for predicting the hazard of locoregional disease progression in this patient cohort. Notably, greater predictive capability was found for parameters collected after the start of RT compared to that in their pretreatment counterparts, and for individual parameters rather than cell-to-cell ratios. With regard to these emerging features, we developed an approach to integrate multiple peri-treatment PBC parameters into a PBC score (PBCS), which led to greater predictive power. Further analysis showed that PBCS was an independent predictor of tumor control failure at locoregional sites and was able to separate patients into subgroups with significantly different long-term hazards of locoregional disease progression.
Methods
Patients
Patients who met the following criteria were enrolled in this trial: (1) pathologically confirmed primary esophageal squamous cell carcinoma; (2) disease located in the cervical, upper, or middle thoracic esophagus; (3) Stage I–IVA, including cervical nodes, according to the 6th edition of the American Joint Committee on Cancer (AJCC) TNM staging system; (4) aged ≥ 18 but ≤ 75 years; (5) Zubrod performance status 0–2; (6) hemoglobin ≥ 10 g per liter (g/L), neutrophils ≥ 1.5 × 10⁹/L, platelets ≥ 150 × 109/L; (7) adequate liver and renal function; (8) no history of prior chemotherapy, radiotherapy, or major esophageal surgery.
Statement of Ethics
This study was carried out in accordance with the the Declaration of Helsinki and approved by the Clinical Research Ethics Committee of the Cancer Hospital of Shantou University Medical College and registered at clinicaltrial.gov (NCT01670409;). Written informed consent for participation in this study was obtained from all patients prior to enrollment.
Treatment
Patients recruited for this trial were treated with definite CCRT (the treatment scheme is shown in Figure 1A). RT was delivered using a simultaneous integrated boost (SIB) approach, as previously described.26 Briefly, the gross tumor (primary and regional metastatic lymph nodes) was determined by CT imaging, endoscopic reports, and barium swallow fluoroscopy. The region of subclinical disease, including high-risk lymph node regions, was derived from the gross tumor. The prescribed dose was 66 Gray (Gy) to the gross tumor and at the same time 54 Gy to the subclinical disease in 30 fractions (F), administered over 6 weeks. RT was delivered using intensity-modulated radiotherapy with cone-beam CT guidance using a TrueBeam linear accelerator (Varian Medical System, Palo Alto, CA, USA). Patients were also treated with two cycles of concurrent chemotherapy at weeks 1 and 5 during radiotherapy, and another two cycles of adjuvant chemotherapy after radiotherapy at weeks 8 and 11. The chemotherapy regimen consisted of intravenous cisplatin, 75 mg/m2, on day 1 and intravenous fluorouracil, 0.5 g/m2, on days 1–4.
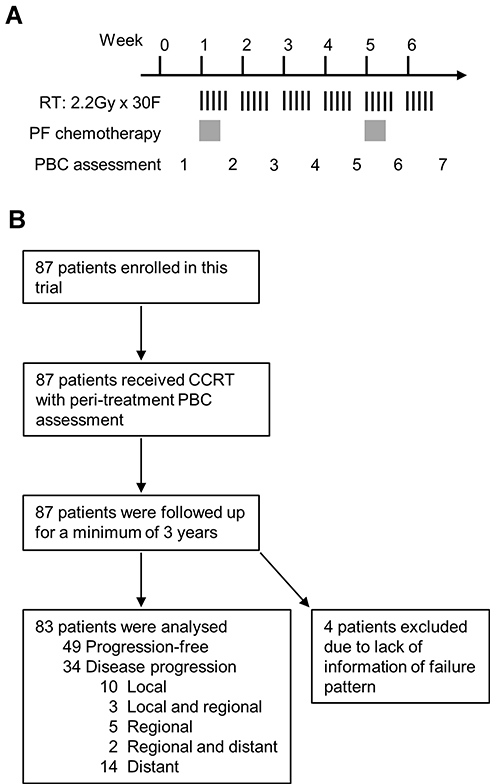 |
Figure 1 Treatment scheme and outline of the trial. The treatment scheme and timing of peripheral blood cell (PBC) assessments are shown in (A). The trial is summarized in (B). Abbreviations: RT, radiotherapy; Gy, gray; F, fraction; PF, cisplatin and fluorouracil; CCRT, concurrent chemoradiotherapy. |
Assessment of PBC Parameters
Assessment of PBC parameters was performed in patients at pre-defined time points, including baseline (within 1 week before RT) and after every five fractions of RT (seven time points in total). PBC assessments at other time points were allowed but not included in the current analysis. All PBC assessments were performed using a Coulter LH 750 Hematology Analyzer (Beckman Coulter, Brea, CA, USA). The following PBC parameters were analyzed: hemoglobin, neutrophils, platelets, lymphocytes, monocytes, NLR, PLR, and monocyte-to-lymphocyte ratio (MLR).
Follow-Up and Evaluation of Therapeutic Response
Follow-up of patients was scheduled for every 3 months for 2 years and then every 6 months for 3 years. Assessments included history, physical examination, hematologic and biochemical profiles, chest X-ray plus esophageal barium swallow test or contrast-enhanced CT scan, and abdominal ultrasound. Endoscopic ultrasound of the esophagus with biopsy or PET/CT was performed if clinically indicated. Tumor response to CCRT was evaluated according to the Response Evaluation Criteria in Solid Tumors guidelines 1.1.27 Disease progression was confirmed by pathological proof, or longitudinal imaging when biopsy was not available.
Endpoints and Statistical Analysis
The endpoints of this study included peri-treatment PBC parameters, first failure patterns (local, regional, or distant) within 3 years after RT, and survival. Multiple sites of tumor progression were considered concomitant if they occurred within 3 months. Time-to-event (cumulative hazard or survival) was measured from the date of completion of radiotherapy to the date of the event (tumor progression or death) or the last clinic visit. Analyses were performed using the Statistical Package for Social Sciences (SPSS 25.0; SPSS Inc, Chicago, IL, USA). Means were compared between two groups using the two-tailed unpaired Student’s t-test or the Wilcoxon rank-sum test, as appropriate. Time-to-event curves were generated using the Kaplan-Meier method and compared using the Log rank test. Receiver operating characteristic (ROC) curves were used to assess the prediction capability of the PBC parameters. Areas under the curve (AUC) for ROC curves were calculated. The cut-off for the ROC curves was determined by the Youden index (sensitivity + specificity - 1). Univariate analysis was performed using the Log rank test. Multivariate Cox regression with the enter selection method was used for the hazard evaluation. Statistical significance was set at p < 0.05.
Results
A total of 87 patients were enrolled in this study between August 2012 and August 2015. The interim results of this trial have been previously reported.28 The current analysis included all enrolled patients (see the trial diagram in Figure 1B), which included 67 men and 20 women, with a median age of 61 years (range, 37–73 years). The clinical stages were as follows: stage II, 30 cases (34.5%); stage III, 44 cases (50.6%); and stage IV, 13 cases (14.9%). All patients completed the entire course of CCRT, and the majority (85.1%) also received 1–2 cycles of adjuvant chemotherapy. The data provided in this report were current as of September 15, 2018, when all patients had a minimum 3-year follow-up after RT. Four patients (4.6%) were excluded from the analysis due to a lack of information on disease progression. Of the 83 patients analyzed, 34 (41%) cases had disease progression.
The distribution of peri-treatment PBC parameters in patients with or without disease progression is summarized in Figure 2. These parameters in both groups exhibited a generally similar trend over time, including periodic oscillation of neutrophils, platelets, and monocytes, a gradual decline of hemoglobin and lymphocytes, and a steady increase in NLR, PLR, and MLR. However, significant differences were found for some parameters. Patients with disease progression had elevated levels of neutrophils at the 3rd time point (after 10F of RT), and platelets at the 6th time point (after 25F of RT), compared to those in patients without disease progression. These patients also showed a trend of increasing hemoglobin levels throughout the course of RT. The distinct distribution patterns of PBC parameters in patients who failed to respond to CCRT suggest that they have potential predictive value.
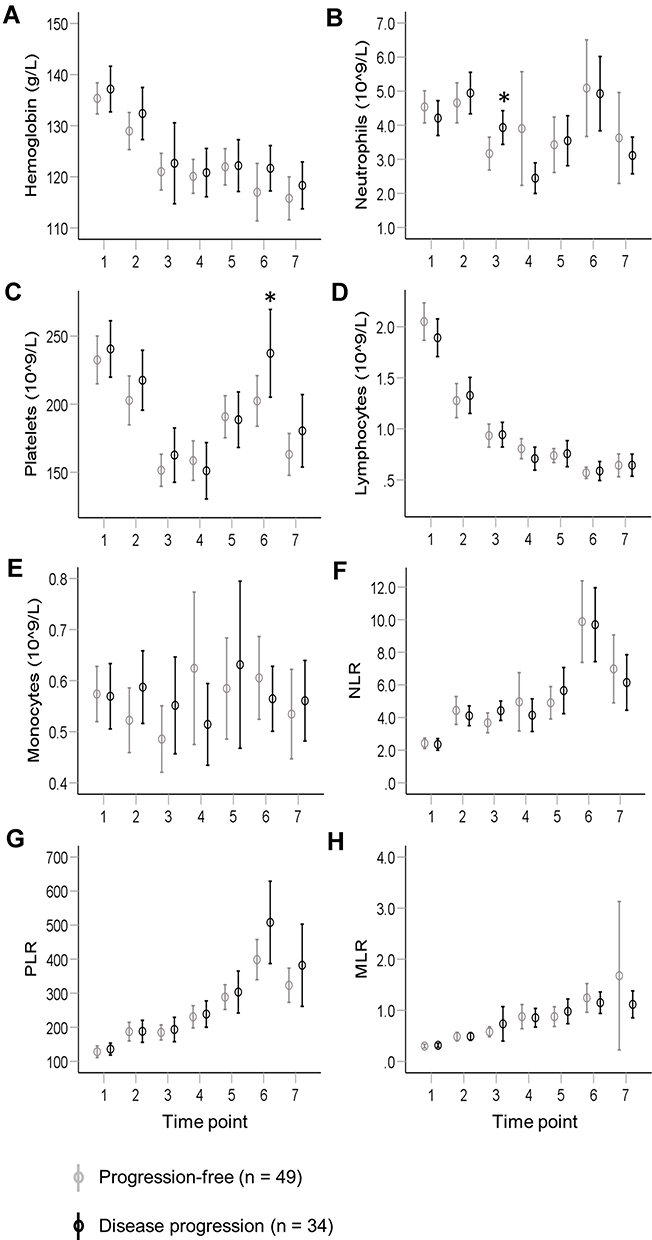 |
Figure 2 Distribution of peri-treatment peripheral blood cell parameters in patients with or without disease progression following definite chemoradiotherapy for esophageal squamous cell carcinoma. Eight peripheral blood cell parameters were collected from patients at seven time points during radiotherapy, including hemoglobin (A), neutrophils (B), platelets (C), lymphocytes (D), monocytes (E), neutrophil-to-lymphocyte ratio (NLR, F), platelet-to-lymphocyte ratio (PLR, G), and monocyte-to-lymphocyte ratio (MLR, H). These parameters in patients with (black, n = 34) or without (gray, n = 49) disease progression were plotted in parallel and compared. Values represent means with 95% confidence intervals Comparisons of means were performed using the two-tailed unpaired Student’s t-test (*P < 0.05). |
The ability of 56 peri-treatment PBC parameters to predict the hazard of disease progression was analyzed using ROC curves (Figure 3A). Pretreatment (the 1st time point) PBC parameters did not appear to have predictive potential (AUC range, 0.52–0.58), whereas modest capacity (AUC, up to 0.67) was found for PBC parameters collected after the start of RT (the 2nd–7th time points). Only the values for neutrophils (3rd) and NLR (3rd) were statistically significant, which is consistent with their mean differences as shown in Figure 2. Further analysis revealed that the prediction capability of PBC parameters varied markedly for different progression patterns (Figure 3B–D). Greater discriminatory capacity was found for the prediction of local (Figure 3B; AUC, up to 0.68) or regional progression hazards (Figure 3C; AUC, up to 0.76) for a number of PBC parameters, whereas their potential was much less for risk of distant progression (Figure 3D; AUC, up to 0.63). Therefore, subsequent analyses concentrated only on local and regional progression. Consistently, higher AUC values were found for PBC parameters during the course of treatment compared to those in pretreatment PBC parameters for these two failure patterns (Figure 3B and C). Individual PBC parameters also exhibited greater potential than cell ratios (NLR, PLR, and MLR) in most cases. Moreover, the panel of parameters with higher AUCs (> 0.6) differed between local and regional progression. Parameters with statistical significance included lymphocytes (7th) for local progression and hemoglobin (2nd and 7th) and neutrophils (3rd) for regional progression.
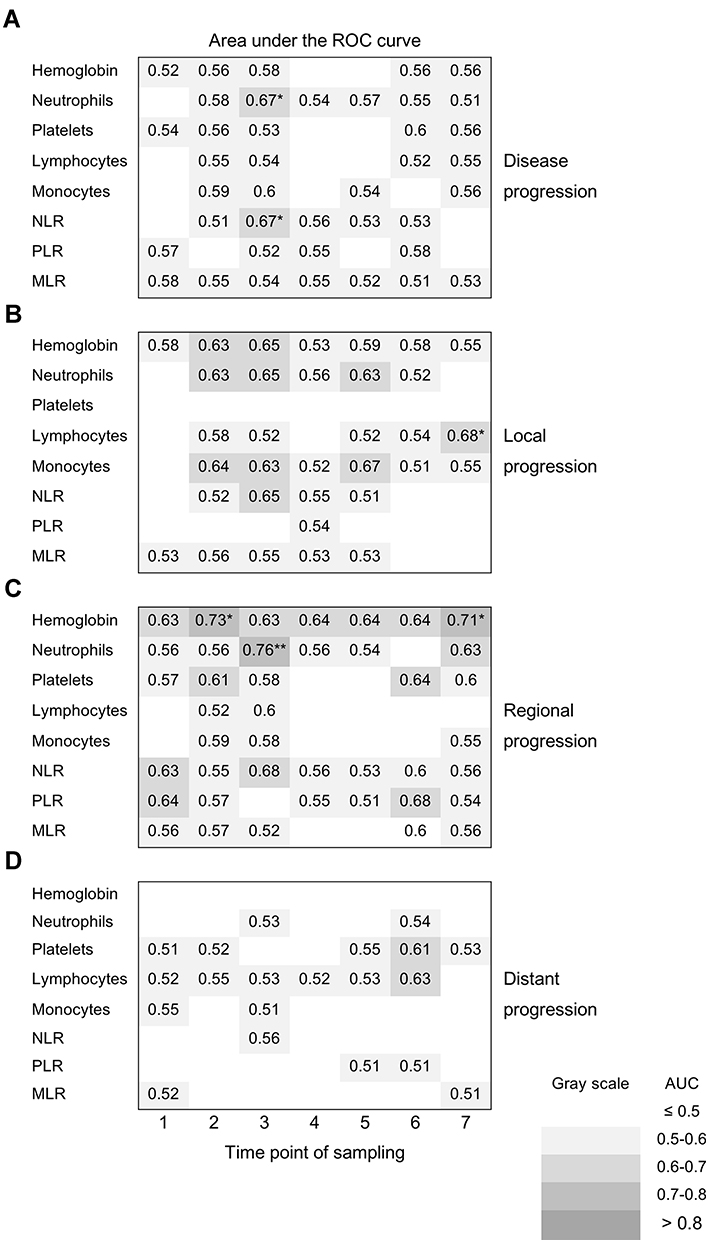 |
Figure 3 Discriminatory capacity of peri-treatment peripheral blood cell parameters for hazard of disease progression. The discriminatory capacity of peri-treatment peripheral blood cell parameters (PBC) for hazard of disease progression (A), and local (B), regional (C), and distant (D) progression, were evaluated individually by receiver operating characteristic (ROC) curves. Peri-treatment PBC parameters included hemoglobin, neutrophils, platelets, lymphocytes, monocytes, neutrophil-to-lymphocyte ratio (NLR), platelet-to-lymphocyte ratio (PLR), and monocyte-to-lymphocyte ratio (MLR). The areas under the curve (AUC) of these curves were summarized as a matrix with parameter type on the column and the time point on the row. AUCs with statistical significance are indicated by asterisks. AUC < 0.5, is not shown (*P < 0.05. **P < 0.01). The background of each AUC corresponds to its value, as indicated. |
To further augment the predictive power of PBC parameters, the integration of multiple parameters was examined. Cell-to-cell ratios (NLR, PLR, and MLR) from a single time point led to inferior predictive potential and were not considered further (Figure 3B and C). The distinctive distribution of predictive PBC parameters that emerged from the screen suggested that a novel integration approach based on peri-treatment PBC might stratify patient prognosis. Since the panel of predictive PBC parameters varied between local and regional progression, these two patterns were analyzed separately. All 35 PBC parameters were ranked according to their AUC values from high to low (Figure 4A and B). The top 10 parameters were selected for the initial integration test. These parameters showed a consistent trend of elevated levels in patients with progression versus patients without progression, suggesting that their summation might integrate their predictive potential (Figure S1). Because PBC parameters have different ranges of normal values, each parameter was first normalized to the mean of the whole group. Normalization did not alter the AUC values or rankings (data not shown). The means of the top parameters (1–10) were then calculated and designated as a PBC score (PBCS) to test for hazard prediction of local (PBCS-L) or regional progression (PBCS-R). As shown in Figure 4C, combinations of multiple PBS parameters resulted in greater AUC values. PBCS-L with the highest AUC (0.73) was derived from the top two parameters, comprising lymphocytes (7th) and monocytes (5th) (Figure 4A). PBSC-R with the highest AUC (0.83) was based on the top four parameters, including neutrophils (3rd), hemoglobin (2nd and 7th), and platelets (6th) (Figure 4B). These parameters were used in the subsequent analyses of this cohort of patients.
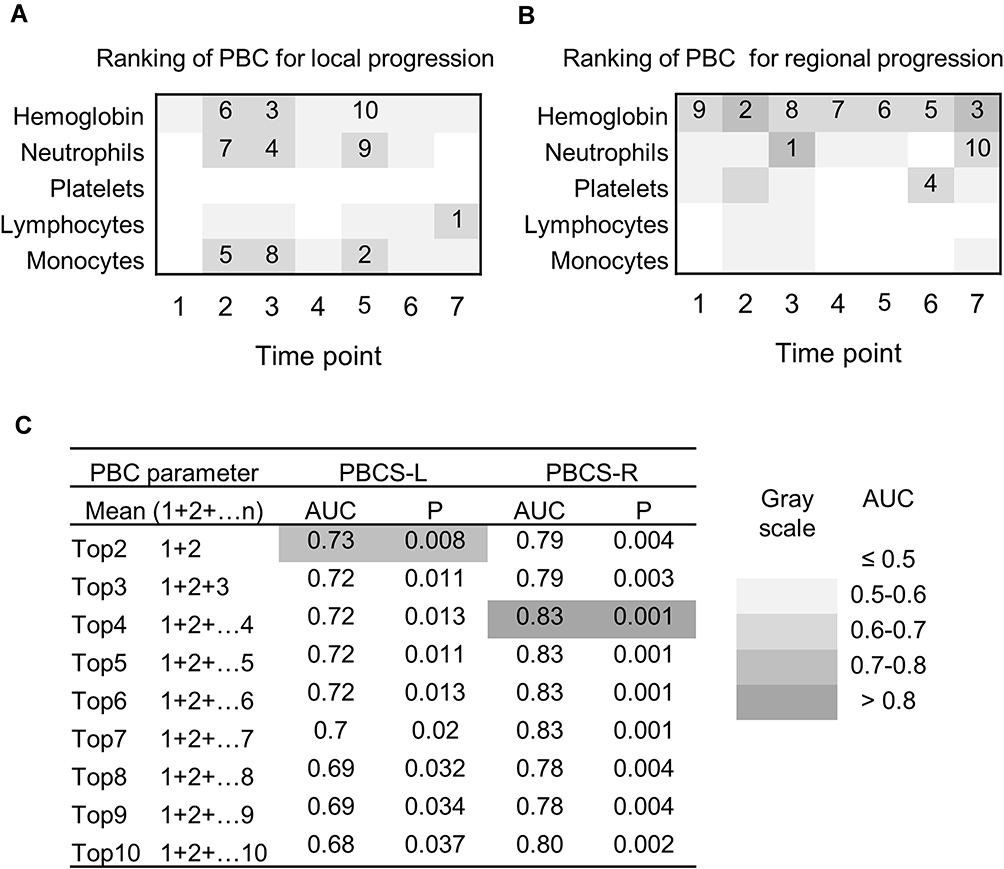 |
Figure 4 Development of peripheral blood cell score. Peri-treatment peripheral blood cell (PBC) parameters were ranked according to their area under the curve (AUC) for discrimination of local (A) and regional (B) progression using receiver operating characteristic (ROC) curves. The top 10 parameters are indicated. The values of each PBC parameter were normalized to the mean of the whole group (mean = 100). The mean of the top PBC (n = 2–10) parameters from (A) and (B) were calculated and designated as PBC scores for local and regional progression (PBCS-L and PBCS-R), respectively. The discriminatory capacity of PBCS-L and PBCS-R was evaluated using ROC curves and summarized in (C). The background of each AUC corresponds to its value, as indicated. |
The optimal cut-off of PBCS-L was set at 86, as determined by the Youden index (Figure 5A), and showed a sensitivity of 92.3% and a specificity of 57.1% for predicting the risk of local progression. Patients with high PBCS-L had a greater 3-year cumulative hazard of local progression compared to that in patients with low PBCS-L (30% vs 3%, P = 0.002) (Figure 5B). Twelve out of 13 (92.3%) patients with confirmed local progression were PBCS-L high. The cut-off of PBSC-R was set at 107 with a sensitivity of 90.0% and a specificity of 79.5% (Figure 5C). Patients with high PBCS-Rs had a significantly higher 3-year cumulative hazard of regional progression than that in patients with low PBCS-Rs (41% vs 2%, P < 0.001) (Figure 5D). Nine out of 10 (90%) patients with confirmed regional progression had high PBCS-Rs. Multivariate Cox regression confirmed that high PBCS-L (HR 16.0, 95% CI 1.9–132.5, P = 0.01) and high PBCS-R (HR 28.6, 95% CI 3.2–254.8, P = 0.003) were independent indicators of local and regional progression, respectively (Tables S1 and S2).
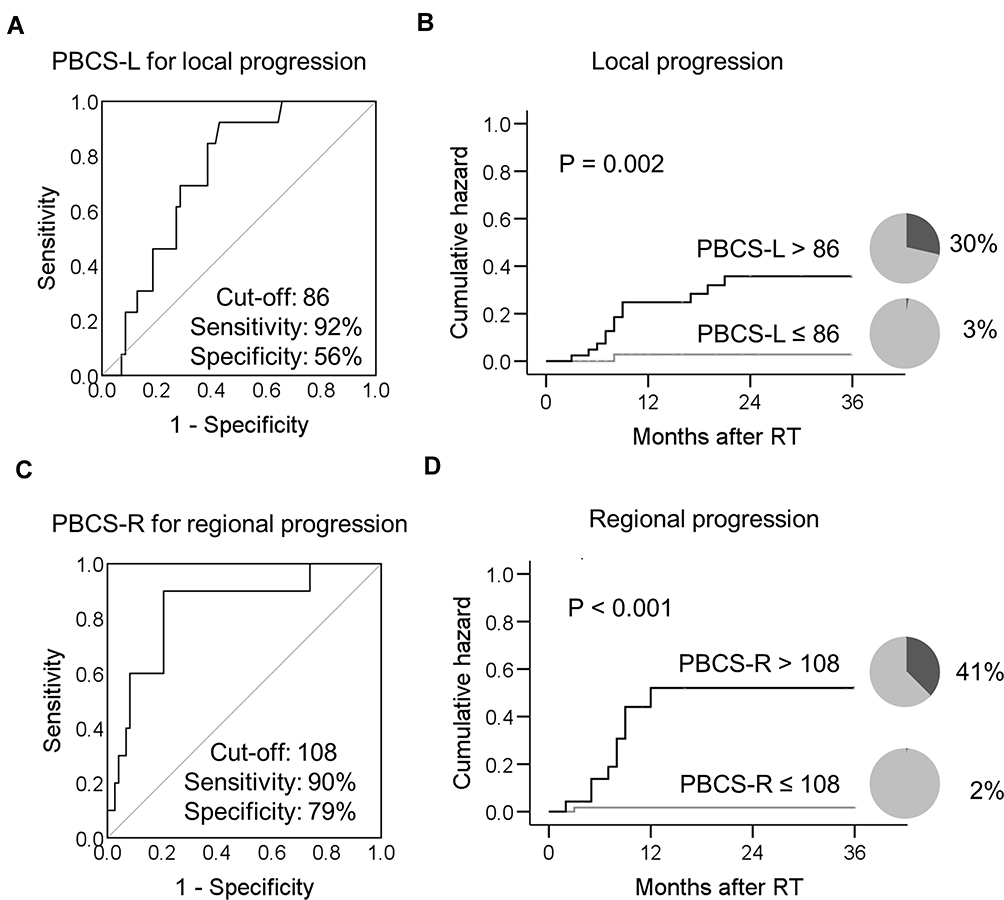 |
Figure 5 Peri-treatment peripheral blood cell score (PBCS) predicts long-term hazard of local or regional progression in esophageal cancer patients after chemoradiotherapy. The receiver operating characteristic curves of PBCS-L and PBCS-R are shown in (A) and (C), respectively. The cut-off value of the curve was determined using the Youden index. The percentage and 3-year cumulative hazard of local progression in patients with PBCS-L > 86 (black, n = 42) or PBCS-L ≤ 86 (gray, n = 41) are plotted in (B). The 3-year cumulative hazard of regional progression in patients with PBCS-R > 108 (black, n = 24) or PBCS-R ≤ 108 (gray, n = 59) is plotted in (D). Black pie charts indicate the percentage of patients with disease progression. A comparison of the 3-year cumulative hazards was performed using the Log rank test. Abbreviations: PBCS-L, peripheral blood cell score for local progression; PBCS-R, peripheral blood cell type for regional progression. |
Overall, 20 patients (24%) had local or regional disease progression. To evaluate the predictive value of PBCS in terms of local and regional progression as a whole, patients were divided into three subgroups according to their PBCS-L and PBCS-R, as follows. PBCS high: both PBCS-L and PBCS-R high; PBCS medium: either PBCS-L or PBCS-R high; PBCS low: both PBCS-L and PBCS-R low. These subgroups of patients displayed significantly different 3-year cumulative hazards of locoregional failure (58% vs 29% vs 7%, P = 0.0017, Figure 6A). In contrast, no significant differences were found in the patients with different clinical stages (Figure 6B). Multivariate Cox regression analysis confirmed that PBCS was the only independent variable associated with risk of locoregional progression (Table 1). A higher risk of locoregional failure was found in patients with high PBCSs (HR, 12.2; 95% CI, 2.0–76.3; P = 0.007) or medium (HR, 5.8; 95% CI, 1.2–27.7; P = 0.028) compared to that in patients with low PBCSs.
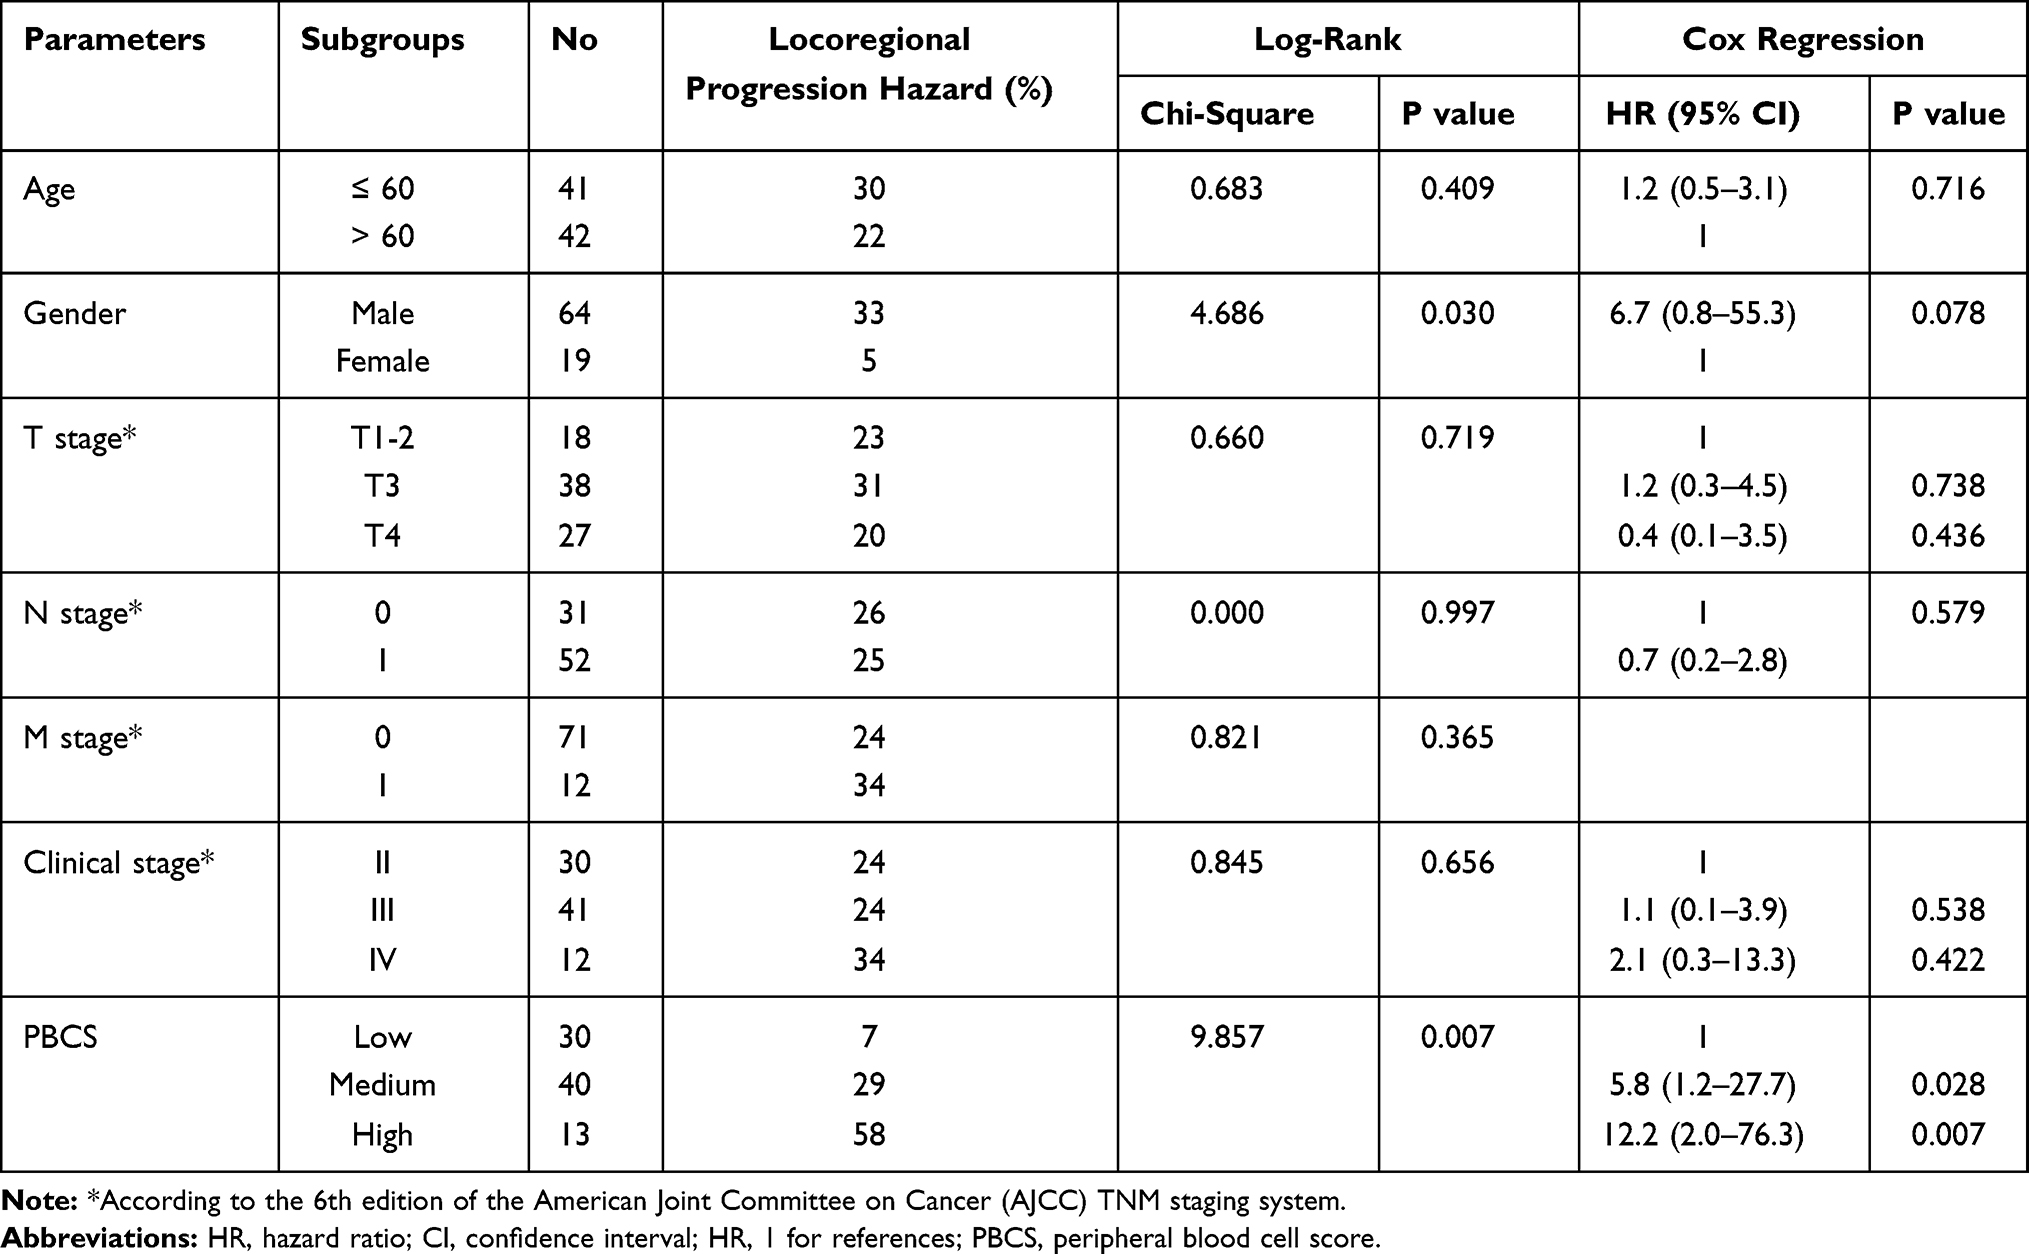 |
Table 1 Univariate and Multivariate Cox Regression Analysis for 3-Year Cumulative Hazard of Locoregional Tumor Progression |
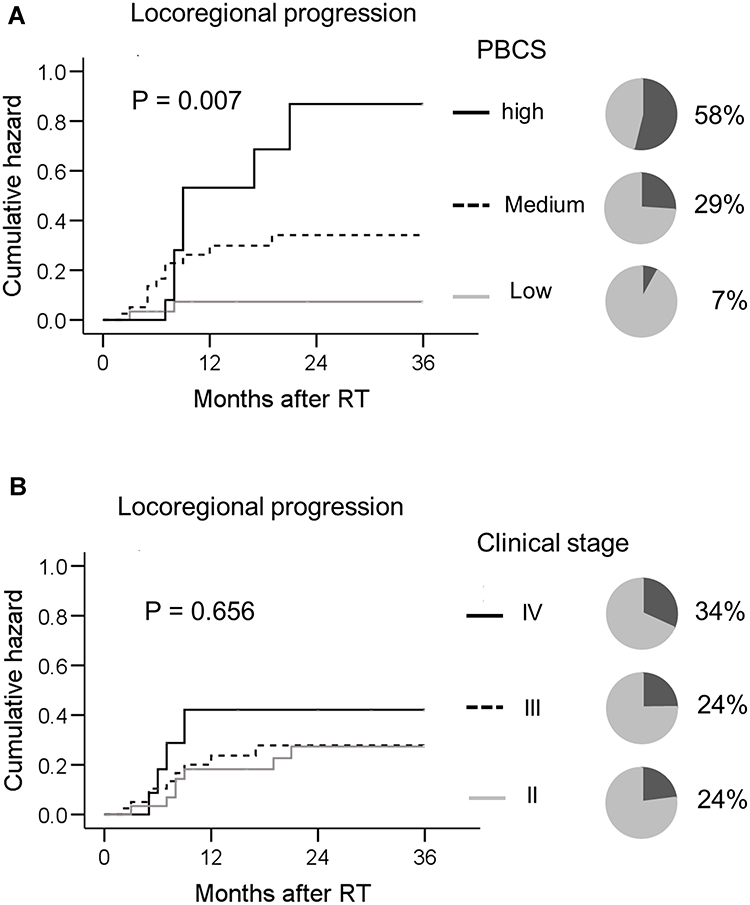 |
Figure 6 Peri-treatment peripheral blood cell score (PBCS) predicts long-term hazard of locoregional recurrence in patients with esophageal squamous cell carcinoma after chemoradiotherapy. Patients were divided into three subgroups according to their PBCS-L and PBCS-R. PBCS high (black solid line): PBCS-L and PBCS-R high; PBCS medium (black dashed line): either PBCS-L or PBCS-R high; PBCS low (gray solid line): both PBCS-L and PBCS-R low. The percentage and 3-year cumulative hazard of locoregional progression in patients categorized according to their PBCS is plotted in (A). The 3-year cumulative hazard of locoregional progression in patients categorized according to their clinical stage (II [black solid line] vs III [black dashed line] vs IV [gray solid line]) is plotted in (B). Black pie charts indicate the percentage of patients with disease progression. A comparison of the 3-year cumulative hazards was performed using the Log rank test. Abbreviations: PBCS-L, peripheral blood cell score for local progression; PBCS-R, peripheral blood cell type for regional progression. |
Discussion
The heterogeneous response among EC patients after definite CCRT is a major challenge for the optimal management of this disease.3,4 The ability to predict patient response to CCRT could be a critical step leading to stratified treatments and better outcomes; however, it remains an unmet clinical need. The prognostic implication of pretreatment PBC parameters in EC patients suggests that they may help address this issue, although their predictive capacity is often modest. In this study, we show that PBC parameters collected after the start of RT exhibited greater discriminatory capacity in predicting disease progression hazard compared to that in their pretreatment counterparts. Moreover, superior potentials were found for individual parameters compared to cell-to-cell ratios. In the face of these emerging features from this peri-treatment PBC screen, an approach was developed to integrate the most predictive PBC parameters into a PBCS, which further augmented their predictive potential. Patients with high PBCSs had a significantly higher risk of locoregional progression than that in patients with low PBCSs. Multivariate analysis confirmed that high peri-treatment PBCS is an independent indicator of tumor control failure at locoregional sites.
The sample size of this study was relatively smaller than that of most previous studies that examined the prognostic value of peripheral blood-related parameters in esophageal cancer.15–17,19 This represents a common challenge in the clinic where researchers often have to rely on small to medium-sized clinical datasets to develop response predictors. This limitation may impede the discovery of potential predictors or undermine their predictive value. Indeed, the majority of patient clinical characteristics and pretreatment PBC parameters failed to discriminate patients with disease progression hazard from patients without in this study. However, our results show that systematic assessment and appropriate integration could help reveal the predictive value of peri-treatment PBC for tumor response to therapy. PBCS can separate patients into subgroups with markedly distinct disease progression hazards, suggesting that it is an effective methodology to tackle the conflict between the clinical need for cost-effective predictors and limited resources.
Our results suggest that the timing of PBC assessment is important for a thorough evaluation of their predictive value. In our hands, pretreatment PBC parameters did not correlate with local progression hazard and only displayed modest discriminatory capacity for the risk of regional progression. Peri-treatment PBC parameters proved to be better indicators. Indeed, all parameters with significant discriminatory capacity were collected after the start of RT, rather than at baseline. In line with our results, a number of recently published studies suggest that post-treatment PBC parameters are associated with the outcomes of cancer patients after RT or immunotherapy.29–35 Barbetta et al showed that changes in NLR after CRT are associated with risk of recurrence in patients with esophageal squamous cell carcinoma.35 Davuluri et al found that lymphocyte nadir during CRT for EC was associated with poor outcomes, and a higher lymphocyte count during neoadjuvant CRT was associated with a higher rate of pathologic complete response in EC.36,37 The majority of these studies, however, used only a single assessment of PBC after the start of treatment, which may have limited their predictive ability. For instance, Zhou and colleagues examined the predictive role of NLR in patients with EC after definite CRT. They found that post-treatment NLR had prognostic value only in patients with high NLR (> 5) at baseline, but not in patients with low NRL (< 5).33 The majority (98%) of patients enrolled in this study had a low NLR (< 5) at baseline (1st). Post-treatment NLR (7th) did not show an apparent association with disease progression hazard. Nevertheless, a number of statistically significant PBC parameters emerged in our screen, and most of them were collected during RT. This suggests that the correlations between PBC parameters and patient response to RT follow a temporal pattern with considerable variation, and require longitudinal and more comprehensive assessment.
Our results also indicate that the integration of multiple parameters into a score could provide superior discriminatory capacity over any single parameter or cell-to-cell ratios. The specific distribution of predictive PBC parameters in patients with locoregional progression led us to develop an integrated score for hazard prediction. This score is composed of a variety of PBC parameters at multiple time points during RT. Consistent with these results, a recently published report by Feng et al showed that integrating multiple PBC parameters could predict the survival of patients with adult T-lymphoblastic lymphoma.38 Thus, combining multiple PBC parameters through appropriate integration may reveal their predictive power. This is practically feasible, as PBC assessment at multiple time points is readily available in patients undergoing CCRT. Nonetheless, how these parameters collectively influence locoregional tumor control requires further investigation.
One interesting observation from this study is that the best predictive PBC parameters for local and regional progression differ. PBCS-L is based on lymphocytes (7th) and monocytes (5th), while neutrophils (3rd), hemoglobin (2nd and 7th), and platelets (6th) comprise PBCS-R. This discrepancy provides a way to distinguish regional progression from local progression, which could be helpful for clinical stratification. Further studies will be needed to address how increases in circulating lymphocytes and monocytes lead to a greater risk of local recurrence, and why regional progression is more often found in patients with augmentation of neutrophils, hemoglobin, and platelets.
In addition to its predictive role, peri-treatment PBCS could also provide insights for the investigation of novel targets. A variety of PBC parameters have been shown to increase at different time points in patients with disease progression, and these cells might contribute to treatment failure. For instance, the increased number of neutrophils and monocytes in patients with disease progression is in accordance with findings from animal models, in that IR leads to recruitment of myeloid-derived suppressor cells (derived from granulocytes and monocytes) in tumors, which then mediates their resistance to IR.39,40 Targeting these cells may reverse resistance to therapy. In contrast to neutrophils and monocytes, there are fewer studies regarding the potential detrimental effects of hemoglobin variation on tumor control. However, our results suggest that patients with a risk of treatment failure are associated with elevated hemoglobin levels, which may provide clues for exploring potential targets to improve response to CCRT.
This study has some limitations that should be addressed in further research. First, the sample size of this study was relatively small, and all patients were enrolled in a single center. Further validation in multicenter studies with a larger cohort of patients is warranted. Second, we used only a summation of PBC parameters as a score for the discrimination of disease progression. There might be other integration methods, such as those that weigh different components, which could provide greater predictive power. Additionally, we did not consider information regarding local and systemic immune responses. These data could help further improve the peri-treatment PBC-based prediction system and provide important insights into the underlying mechanisms.
Emerging studies suggest that robust prediction of patient response to CCRT could also be achieved by using a variety of other methodologies, including molecular signature, CT-radiomics, and positron emission tomography.41–43 Combining these markers with PBCS may lead to a greater predictive capability for patient outcomes.
Conclusions
In this prospective cohort study, we showed that peri-treatment PBCS can predict the long-term hazard of locoregional progression after definitive CCRT in patients with esophageal squamous cell carcinoma. This could provide useful insights for personalized adjuvant therapy. Further validation in multicenter studies using a larger cohort of patients is warranted.
Data Sharing Statement
The individual deidentified participant data that underlie the results reported in this article are available from the corresponding author Chuangzhen Chen upon reasonable request.
Acknowledgments
This study was supported by grants from the Science and Technology Planning Project of Guangdong Province (2016ZC0166 and 2017ZC0279); Shantou University Medical College Clinical Research Enhancement Initiative (N0201424); Collaborative and Creative Center, Molecular Diagnosis and Personalized Medicine, Shantou University, Guangdong, China; Science and Technology Special Fund of Guangdong Province of China (2019-132); and Strategic and Special Fund for Science and Technology Innovation of Guangdong Province of China (180918114960704). We thank all the patients and their families for their participation in this study.
Disclosure
The authors declare no competing interests.
References
1. Bray F, Ferlay J, Soerjomataram I, et al. Global cancer statistics 2018: GLOBOCAN estimates of incidence and mortality worldwide for 36 cancers in 185 countries. CA Cancer J Clin. 2018;68:394–424. doi:10.3322/caac.21492
2. Herskovic A, Martz K, al-Sarraf M, et al. Combined chemotherapy and radiotherapy compared with radiotherapy alone in patients with cancer of the esophagus. N Engl J Med. 1992;326:1593–1598. doi:10.1056/NEJM199206113262403
3. Cooper JS, Guo MD, Herskovic A, et al. Chemoradiotherapy of locally advanced esophageal cancer: long-term follow-up of a prospective randomized trial (RTOG 85-01). Radiation Therapy Oncology Group. JAMA. 1999;281:1623–1627. doi:10.1001/jama.281.17.1623
4. Minsky BD, Pajak TF, Ginsberg RJ, et al. INT 0123 (Radiation Therapy Oncology Group 94-05) Phase III trial of combined-modality therapy for esophageal cancer: high-dose versus standard-dose radiation therapy. J Clin Oncol. 2002;20:1167–1174. doi:10.1200/JCO.2002.20.5.1167
5. Kwee RM. Prediction of tumor response to neoadjuvant therapy in patients with esophageal cancer with use of F-18 FDG PET: a systematic review. Radiology. 2010;254:707–717. doi:10.1148/radiol.09091324
6. Cremonesi M, Garibaldi C, Timmerman R, et al. Interim (18)F-FDG-PET/CT during chemo-radiotherapy in the management of oesophageal cancer patients. A systematic review. Radiother Oncol. 2017;125:200–212. doi:10.1016/j.radonc.2017.09.022
7. Ishihara R, Yamamoto S, Iishi H, et al. Factors predictive of tumor recurrence and survival after initial complete response of esophageal squamous cell carcinoma to definitive chemoradiotherapy. Int J Radiat Oncol Biol Phys. 2010;76:123–129. doi:10.1016/j.ijrobp.2009.01.038
8. Chao YK, Tseng CK, Wen YW, et al. Using pretreatment tumor depth and length to select esophageal squamous cell carcinoma patients for nonoperative treatment after neoadjuvant chemoradiotherapy. Ann Surg Oncol. 2013;20:3000–3008. doi:10.1245/s10434-013-2962-1
9. Fareed KR, Kaye P, Soomro IN, et al. Biomarkers of response to therapy in oesophago-gastric cancer. Gut. 2009;58:127–143. doi:10.1136/gut.2008.155861
10. Knight K, Wade S, Balducci L. Prevalence and outcomes of anemia in cancer: a systematic review of the literature. Am J Med. 2004;116(Suppl 7A):11S–26S. doi:10.1016/j.amjmed.2003.12.008
11. Templeton AJ, McNamara MG, Seruga B, et al. Prognostic role of neutrophil-to-lymphocyte ratio in solid tumors: a systematic review and meta-analysis. J Natl Cancer Inst. 2014;106:dju124. doi:10.1093/jnci/dju124
12. Templeton AJ, Ace O, McNamara MG, et al. Prognostic role of platelet to lymphocyte ratio in solid tumors: a systematic review and meta-analysis. Cancer Epidemiol Biomarkers Prev. 2014;23:1204–1212. doi:10.1158/1055-9965.EPI-14-0146
13. Mao Y, Chen D, Duan S, et al. Prognostic impact of pretreatment lymphocyte-to-monocyte ratio in advanced epithelial cancers: a meta-analysis. Cancer Cell Int. 2018;18:201. doi:10.1186/s12935-018-0698-5
14. Yodying H, Matsuda A, Miyashita M, et al. Prognostic significance of neutrophil-to-lymphocyte ratio and platelet-to-lymphocyte ratio in oncologic outcomes of esophageal cancer: a systematic review and meta-analysis. Ann Surg Oncol. 2016;23:646–654. doi:10.1245/s10434-015-4869-5
15. Yoo EJ, Park JC, Kim EH, et al. Prognostic value of neutrophil-to-lymphocyte ratio in patients treated with concurrent chemoradiotherapy for locally advanced oesophageal cancer. Dig Liver Dis. 2014;46:846–853. doi:10.1016/j.dld.2014.05.009
16. Cox S, Hurt C, Grenader T, Mukherjee S, Bridgewater J, Crosby T. The prognostic value of derived neutrophil to lymphocyte ratio in oesophageal cancer treated with definitive chemoradiotherapy. Radiother Oncol. 2017;125:154–159. doi:10.1016/j.radonc.2017.08.023
17. Miao C, Zhu S, Pan H, Cao X, Yuan S, Hu X. Combined neutrophil-platelet score and hemoglobin level predict survival in esophageal squamous cell carcinoma patients treated with chemoradiotherapy. Oncotarget. 2017;8:87971–87979. doi:10.18632/oncotarget.21313
18. Chen MF, Chen PT, Kuan FC, Chen WC. The predictive value of pretreatment neutrophil-to-lymphocyte ratio in esophageal squamous cell carcinoma. Ann Surg Oncol. 2019;26:190–199. doi:10.1245/s10434-018-6944-1
19. Zenda S, Hironaka S, Boku N, et al. Impact of hemoglobin level on survival in definitive chemoradiotherapy for T4/M1 lymph node esophageal cancer. Dis Esophagus. 2008;21:195–200. doi:10.1111/j.1442-2050.2007.00750.x
20. Apetoh L, Ghiringhelli F, Tesniere A, et al. Toll-like receptor 4-dependent contribution of the immune system to anticancer chemotherapy and radiotherapy. Nat Med. 2007;13:1050–1059. doi:10.1038/nm1622
21. Lee Y, Auh SL, Wang Y, et al. Therapeutic effects of ablative radiation on local tumor require CD8+ T cells: changing strategies for cancer treatment. Blood. 2009;114:589–595. doi:10.1182/blood-2009-02-206870
22. Swann JB, Smyth MJ. Immune surveillance of tumors. J Clin Invest. 2007;117:1137–1146. doi:10.1172/JCI31405
23. Reits EA, Hodge JW, Herberts CA, et al. Radiation modulates the peptide repertoire, enhances MHC class I expression, and induces successful antitumor immunotherapy. J Exp Med. 2006;203:1259–1271. doi:10.1084/jem.20052494
24. Burnette BC, Liang H, Lee Y, et al. The efficacy of radiotherapy relies upon induction of type I interferon-dependent innate and adaptive immunity. Cancer Res. 2011;71(7):2488–2496. doi:10.1158/0008-5472.CAN-10-2820
25. Diakos CI, Charles KA, McMillan DC, Clarke SJ. Cancer-related inflammation and treatment effectiveness. Lancet Oncol. 2014;15:E493–E503. doi:10.1016/S1470-2045(14)70263-3
26. Zhang WZ, Chen JZ, Li DR, et al. Simultaneous modulated accelerated radiation therapy for esophageal cancer: a feasibility study. World J Gastroenterol. 2014;20:13973–13980. doi:10.3748/wjg.v20.i38.13973
27. Eisenhauer EA, Therasse P, Bogaerts J, et al. New response evaluation criteria in solid tumours: revised RECIST guideline (version 1.1). Eur J Cancer. 2009;45:228–247. doi:10.1016/j.ejca.2008.10.026
28. Chen JZ, Guo H, Zhai TT, et al. Radiation dose escalation by simultaneous modulated accelerated radiotherapy combined with chemotherapy for esophageal cancer: a phase II study. Oncotarget. 2016;7:22711–22719. doi:10.18632/oncotarget.8050
29. Chowdhary M, Switchenko JM, Press RH, et al. Post-treatment neutrophil-to-lymphocyte ratio predicts for overall survival in brain metastases treated with stereotactic radiosurgery. J Neuro-Oncol. 2018;139:689–697. doi:10.1007/s11060-018-2914-5
30. Lin AJ, Rao YJ, Chin RI, et al. Post-operative radiation effects on lymphopenia, neutrophil to lymphocyte ratio, and clinical outcomes in palatine tonsil cancers. Oral Oncol. 2018;86:1–7. doi:10.1016/j.oraloncology.2018.08.008
31. Suh KJ, Kim SH, Kim YJ, et al. Post-treatment neutrophil-to-lymphocyte ratio at week 6 is prognostic in patients with advanced non-small cell lung cancers treated with anti-PD-1 antibody. Cancer Immunol Immunther. 2018;67:459–470. doi:10.1007/s00262-017-2092-x
32. Khunger M, Patil PD, Khunger A, et al. Post-treatment changes in hematological parameters predict response to nivolumab monotherapy in non-small cell lung cancer patients. PLoS One. 2018;13:e0197743. doi:10.1371/journal.pone.0197743
33. Zhou XL, Li YQ, Zhu WG, et al. Neutrophil-to-lymphocyte ratio as a prognostic biomarker for patients with locally advanced esophageal squamous cell carcinoma treated with definitive chemoradiotherapy. Sci Rep. 2017;7.
34. Lee YJ, Lee SB, Beak SK, et al. Temporal changes in immune cell composition and cytokines in response to chemoradiation in rectal cancer. Sci Rep. 2018;8:7565. doi:10.1038/s41598-018-25970-z
35. Barbetta A, Nobel TB, Sihag S, et al. Neutrophil to lymphocyte ratio as predictor of treatment response in esophageal squamous cell cancer. Ann Thorac Surg. 2018;106:864–871. doi:10.1016/j.athoracsur.2018.04.007
36. Davuluri R, Jiang W, Fang P, et al. Lymphocyte nadir and esophageal cancer survival outcomes after chemoradiation therapy. Int J Radiat Oncol Biol Phys. 2017;99:128–135. doi:10.1016/j.ijrobp.2017.05.037
37. Fang P, Jiang W, Davuluri R, et al. High lymphocyte count during neoadjuvant chemoradiotherapy is associated with improved pathologic complete response in esophageal cancer. Radiother Oncol. 2018;128:584–590. doi:10.1016/j.radonc.2018.02.025
38. Feng X, Li L, Wu J, et al. complete blood count score model integrating reduced lymphocyte-monocyte ratio, elevated neutrophil-lymphocyte ratio, and elevated platelet-lymphocyte Ratio Predicts inferior clinical outcomes in Adult T-lymphoblastic lymphoma. Oncologist. 2019;24(11). doi:10.1634/theoncologist.2018-0789
39. Ahn GO, Tseng D, Liao CH, Dorie MJ, Czechowicz A, Brown JM. Inhibition of Mac-1 (CD11b/CD18) enhances tumor response to radiation by reducing myeloid cell recruitment. Proc Natl Acad Sci U S A. 2010;107:8363–8368. doi:10.1073/pnas.0911378107
40. Liang H, Deng L, Hou Y, et al. Host STING-dependent MDSC mobilization drives extrinsic radiation resistance. Nat Commun. 2017;8:1736. doi:10.1038/s41467-017-01566-5
41. Zhang C, Zhang Z, Zhang G, et al. A three-lncRNA signature of pretreatment biopsies predicts pathological response and outcome in esophageal squamous cell carcinoma with neoadjuvant chemoradiotherapy. Clin Transl Med. 2020;10:e156. doi:10.1002/ctm2.156
42. Luo HS, Huang SF, Xu HY, et al. A nomogram based on pretreatment CT radiomics features for predicting complete response to chemoradiotherapy in patients with esophageal squamous cell cancer. Radiat Oncol. 2020;15:249. doi:10.1186/s13014-020-01692-3
43. Wang C, Zhao K, Hu S, et al. The PET-derived tumor-to-liver standard uptake ratio (SUV TLR) is superior to tumor SUVmax in predicting tumor response and survival after chemoradiotherapy in patients with locally advanced esophageal cancer. Front Oncol. 2020;10:1630. doi:10.3389/fonc.2020.01630
 © 2021 The Author(s). This work is published and licensed by Dove Medical Press Limited. The full terms of this license are available at https://www.dovepress.com/terms.php and incorporate the Creative Commons Attribution - Non Commercial (unported, v3.0) License.
By accessing the work you hereby accept the Terms. Non-commercial uses of the work are permitted without any further permission from Dove Medical Press Limited, provided the work is properly attributed. For permission for commercial use of this work, please see paragraphs 4.2 and 5 of our Terms.
© 2021 The Author(s). This work is published and licensed by Dove Medical Press Limited. The full terms of this license are available at https://www.dovepress.com/terms.php and incorporate the Creative Commons Attribution - Non Commercial (unported, v3.0) License.
By accessing the work you hereby accept the Terms. Non-commercial uses of the work are permitted without any further permission from Dove Medical Press Limited, provided the work is properly attributed. For permission for commercial use of this work, please see paragraphs 4.2 and 5 of our Terms.