")
Back to Journals » Cancer Management and Research » Volume 13
Dissecting Prognosis Modules and Biomarkers in Glioblastoma Based on Weighted Gene Co-Expression Network Analysis
Authors Cao F , Fan Y , Yu Y, Yang G, Zhong H
Received 19 March 2021
Accepted for publication 3 June 2021
Published 8 July 2021 Volume 2021:13 Pages 5477—5489
DOI https://doi.org/10.2147/CMAR.S310346
Checked for plagiarism Yes
Review by Single anonymous peer review
Peer reviewer comments 2
Editor who approved publication: Dr Ahmet Emre Eşkazan
Fang Cao,1,* Yinchun Fan,1,* Yunhu Yu,2 Guohua Yang,3 Hua Zhong4
1Department of Cerebrovascular Disease, Affiliated Hospital of Zunyi Medical University, Zunyi, Guizhou, 563000, People’s Republic of China; 2Clinical Research Center for Neurological Disease, the People’s Hospital of Hong Hua Gang District of ZunYi, Zunyi, 563000, People’s Republic of China; 3Demonstration Center for Experimental Basic Medicine Education of Wuhan University, Wuhan, Hubei, 430071, People’s Republic of China; 4College of Life Sciences, Wuhan University, Wuhan, Hubei, 430072, People’s Republic of China
*These authors contributed equally to this work
Correspondence: Hua Zhong Email [email protected]
Introduction: As one of the most prevalent and malignant brain cancers, glioblastoma multiforme (GBM) presents a poor prognosis and the molecular mechanisms remain poorly understood. Consequently, molecular research, including various biomarkers, is essential to exploit the occurrence and development of glioma.
Methods: Weighted gene co-expression network analysis (WGCNA) was used to construct gene co-expression modules and networks based on the Chinese Glioma Genome Atlas (CGGA) glioblastoma specimens. Then, protein–protein interaction (PPI) and gene ontology (GO) analyses were performed to mine hub genes. RT-PCR and immunohistochemistry were employed to examine the expression level of GRPR, CXCL5, and CXCL11 in glioma patients.
Results: We confirmed two gene modules by protein–protein interaction networks. Functional enrichment analysis was performed to identify the significance of gene modules. Prognostic biomarkers GRPR, CXCL5, and CXCL11 related to the survival time of GBM samples were mined in The Cancer Genome Atlas (TCGA) dataset. qRT-PCR revealed that GRPR, CXCL5, and CXCL11 led to a significant increase in GBM sample compared to control.
Conclusion: In this study, we developed and confirmed three mRNA signatures (GRPR, CXCL5, and CXCL11) for evaluating overall survival in GBM patients. Our research assists in existing understanding of GBM diagnosis and prognosis.
Keywords: GBM, CGGA, TCGA, WGCNA, biomarkers
Introduction
Gliomas contain heterogeneous brain tumors which are traditionally classified based on distinct histological appearance and malignancy degrees.1 In 2016 World Health Organization (WHO) classification, glioma have been assigned WHO grades I–IV where grade IV is regarded as glioblastoma.2 Glioblastoma multiforme (GBM) is known as the most aggressive primary intracranial tumor, with short median survival time, excessive proliferation, and invasiveness. Hence, developing efficient prognosis signatures is crucial for glioblastoma patients. Past molecular analyses of glioblastoma reported many well-known molecular markers, such as p53, PI3K, RAF, isocitrate dehydrogenase 1 and 2 (IDH1/2), epidermal growth factor receptor (EGFR), X-linked alpha thalassemia mental retardation syndrome gene (ATRX), platelet-derived growth factor receptor alpha (PDGFRA), and insulin-like growth factor 1 (IGF-1).3–7 Another prognosis marker, codeletion of chromosome arms 1p and 19q (1p/19q loss), displays a better prognosis.8 Additionally, O(6)-methylguanine-DNA methyltransferase (MGMT) is associated with the prognosis of patients and sensitivity of temozolomide therapy.9 Lack of NF1 could cause increased tumor-associated microglia infiltration.10
Benefited from progresses of high-throughput sequencing and bioinformatics, huge volumes of data make it easier to detect GBM-related hub genes, networks, and pathways. Nonetheless, identification of appropriate biological features remains challenging. Weighted gene co-expression network analysis (WGCNA) serves as a system biology and statistical tool to describe the correlation patterns among genes, as well as to recognize highly correlated modules.11 In this study, we performed WGCNA for RNA-Seq data derived from the Chinese Glioma Genome Atlas (CGGA) and reconstructed gene co-expression networks. Then, we identified glioblastoma-associated gene modules and delineated several prognostic biomarkers related to the survival time of glioblastoma samples both in CGGA and The Cancer Genome Atlas (TCGA) datasets.
The independent prognostic model were identified by Log rank test along with Kaplan–Meier survival analysis. The results found that GRPR, CXCL5, and CXCL11 has been put forward as biomarkers for further guiding malignant glioma diagnosis and prognosis. Overall, this finding provides molecular considerations and points directions toward the molecular mechanism concerning gliomagenesis.
Materials and Methods
Data Acquisition
The gene expression data of 693 glioma samples was downloaded from the CGGA database (http://cgga.org.cn/). mRNA-sequencing procession methods were available for public in CGGA website (http://www.cgga.org.cn/about.jsp#mRNA_seq). In WGCNA, those genes without significant changes in expression between samples would be closely correlated. Next, the mRNA expression levels of 23,987 genes were calculated by variance analysis, and top 25% most variable genes (5,997) were subjected in the following steps. The clinical metadata were also derived and filtered for useful information in Table S1 (including CGGA_ID, progression status, histology, grade, gender, age, overall survival (OS), censor, and IDH mutation status). Among them, WHO grade was closely associated with OS.12 The work flow diagram of this study was depicted in Figure S1.
Weighted Gene Co-Expression Network Analysis (WGCNA)
WGCNA was recruited via the R package ‘WGCNA’.11 Firstly, RNA-Seq data were filtered to reduce outliers. In brief, soft threshold power of β (β=3) was established using scale-free topology criterion and the developed weighted adjacency matrix. Then, we chose the bottom-up algorithm, dynamic tree cut method, to recognize co-expression gene modules. To quantify module similarity and further identify biological interesting modules closely associated with tissues type, modules eigengenes (MEs) were estimated by the first principal component.13 Statistical significance was determined by a correlation test p-value <0.05. The module P-reservation function in the ‘WGCNA’ package was applied to calculate the Z-summary to estimate the conserved modules.
Comprehensive Functional Enrichment Analysis
Functional enrichment analyses including GO (Gene ontology), KEGG (Kyoto Encyclopedia of Genes and Genomes), ClinVar, Wiki pathway, and REACTOME of candidate genes in modules were carried out using the ClueGO plug-in of Cytoscape and p-value<0.05 (received by two-sided tests based on hypergeometric distribution) was the cut-off criterion.14 Enriched ontological terms and pathways were visualized by Cytoscape 3.8.0.
Integration of the PPI Network and Hub Genes Selection
The protein–protein interaction (PPI) network in gene module was developed using the STRING 11.0 database (http://string-db.org).15 P-value was received by a hypergeometric test. A combined score >0.4 was set in the PPI networks. A protein interaction relationship network table was visualized by Cytoscape 3.8.0 software (http://www.cytoscape.org/index.html).
The cytoHubba plug-in was employed to explore important nodes using several topological algorithms, such as Degree, Maximum Neighborhood Component (MNC) and centralities based on shortest paths, including bottleneck (BN), betweenness, and radiality.16 Proteins with high degree and betweenness might be important candidate genes which have key physiological regulatory functions.
Validation of Key Candidate Genes Expression Levels via RNA-Seq
The expression levels of core putative genes were next validated by CCGA online tools and the Gene Expression Profiling Interactive Analysis (GEPIA 2.0, http://gepia2.cancer-pku.cn/#index) which could analyze the RNA-Seq expression data of 9,736 tumors and 8,587 normal samples from the TCGA and the Genotype-Tissue Expression (GTEx) projects.17,18 Hub genes with |log2Fold Change (FC)| > 1 and p-value < 0.05 (received by one-way ANOVA) were considered as statistically significant in GEPIA. p-Value was tested by t-test in CGGA tools.
Patients and Glioma Tissue Collection and qRT-PCR
The study protocol was approved by the Clinical Research Ethics Committee from the affiliated hospital of Zunyi medical college, which was conducted in accordance with the Declaration of Helsinki. (Zunyi, Guizhou, China). Written informed consent was obtained from all participants. GBM (n=25), LGG (n=25), and control brain tissue (n=25, sampled during surgical procedures for epilepsy) were obtained from the affiliated hospital of Zunyi medical college, immediately frozen in liquid nitrogen, and stored at −80°C until use.19 All tissues were subjected to quantitative reverse transcriptase PCR (qRT-PCR) to measure key candidate genes expression. The qRT-PCR reaction (10 µL) was formulated using the 2X SYBR Green qPCR Master Mix (US Everbright® Inc., Suzhou, China). All qRT-PCRs were carried out on a CFX96 Touch™ Real-Time PCR Detection System (Bio-Rad, Hercules, CA, USA). The primer sequences designed by Primer 5.0 were shown in Table S2. The relative mRNA expression level was quantified using the 2-ΔΔCt method.
Protein Expression Level and Immune Infiltrates of Candidate Genes
The protein expression levels of hub genes in normal and glioma tissues were investigated. The images were obtained from the Human Protein Atlas (HPA, http://www.proteinatlas.org) database. The purity-corrected Spearman’s rho of CXCL11, CXCL5, and GRPR expressions with the abundance of immune infiltrates, including dendritic cells, CD4+ T cells, neutrophils, macrophages, and NK cell were detected in GBM patients on TIMER (Tumor Immune Estimation Resource) online tools (https://cistrome.shinyapps.io/timer).
Survival Analysis of Key Genes
We assessed the association between hub genes and glioblastoma overall survival (OS) and disease free survival (DFS) in TCGA cohort by GEPIA 2.0.17 Survival data of the GBM subgroup were extracted based on Kaplan–Meier analysis of OS and DFS. Set the median risk score as cutoff, all patients in the TCGA set were classified into a high-risk group and a low-risk group using Log rank test. The prognostic value of screened hub genes in GBM was also analyzed using PrognoScan database (http://dna00.bio.kyutech.ac.jp/PrognoScan/index.html).20
Statistical Analysis
The two-sided t-tests were used to perform differential analysis. All statistical tests and graphing were implemented via the R language, version 3.6.1. In the figures, statistical significance was indicated as follows: *, **, and *** represent p-value < 0.05, 0.01, and 0.001, respectively.
Results
Co-Expression Network Construction and Module Mining
WGCNA was utilized to frame a gene co-expression network to mine biologically meaningful gene modules. We selected top 25% (5,997/23,987) most variable genes which derived from 693 samples in CGGA datasets to construct a weighted gene co-expression network. Validation of co-expression modules might boost identification of hub genes that maintain important functions. WGCNA defined gene modules as a set of genes with topological overlaps. Based on scale-free topology criterion, the soft threshold power of β was set as 3 while scale-free topology model-fit R2 was equal to 0.87 (Figure S2). After establishing a hierarchical clustering dendrogram, co-expression modules were represented by branches of different colors in the dendrogram (Figure 1A and B).
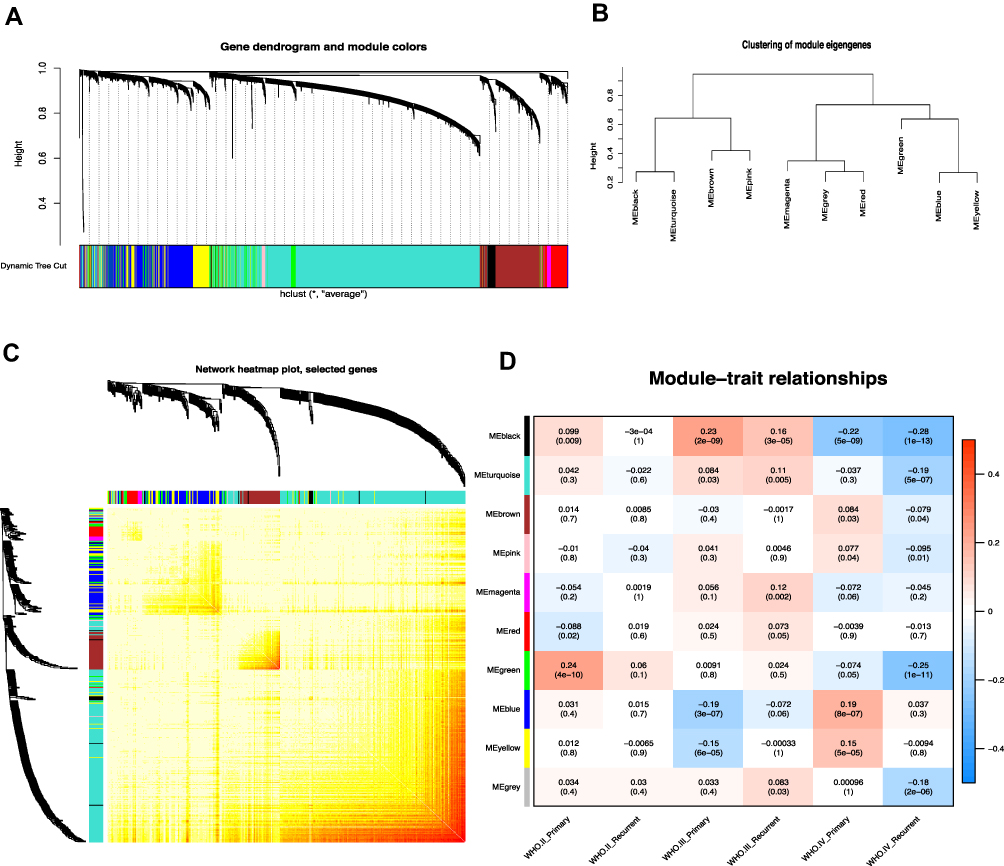 |
Figure 1 Weighted gene co-expression network in glioma. (A) Hierarchical clustering dendrogram of genes based on co-expression network analysis. Each piece of the leaves (short vertical lines) corresponds to individual gene. The branches correspond to modules of highly interconnected genes. Different colors below the dendrograms represent different gene modules. (B) Dendrogram of consensus module eigengenes. (C) The correlation coefficient heatmap of the co-expression module genes. Each bright spot corresponds to the correlation between each gene and other genes. The deeper the colors, the stronger is the connectivity between the two genes in the corresponding row and column. (D) Correlation between the gene module and clinical traits. The clinical traits include different WHO grades of glioma. The correlation coefficient in each cell represented the correlation between the gene module and the clinical traits, which decreased in size from red to blue. The corresponding P value is also annotated. |
To determine module preservation, the Z-summary score was next calculated. Modules with a Z-summary score > 10 were considered as preserved.21,22 Ultimately, 10 gene modules were distinguished with module size ranging from 54 genes in magenta module to 2,288 genes in turquoise module (Table S3). The genes which were not categorized into any gene modules finally were assigned to grey module (Figure 1C and Figure S3). With ranked in a descending order of Z-score, top five modules were turquoise (Z-score=39.57), brown (Z-score=37.68), blue (Z-score=37.10), yellow (Z-score=24.04), and grey (Z-score=20.28) modules. This observation indicated that these modules might provide better knowledge underlying the pathological mechanisms of GBM.
To exploit the relationship between gene modules and clinical indexes, the module eigengene (ME) was developed as the overall gene expression level of corresponding modules. We calculated correlations with ME and clinical phenotypes, such as primary and recurrent glioma in WHO II, WHO III, and WHO IV grades (Figure 1D). Genes in blue and yellow modules possessed similar expression patterns which were significantly accumulated in grade IV (GBM) and declined in other grades. Moreover, hierarchical clustering analysis of modules found that the blue and yellow modules were on the same branch (Figure 1B). The findings illustrated that the blue and yellow modules exhibited similar gene expression modes. Thus, we focused on analysis of the blue and yellow modules in the follow-up analyses.
Functional Enrichment Analysis of Gene in Modules
For a more in-depth understanding of genes in two candidate modules, GO functional enrichment, KEGG/wiki/REACTOME pathway enrichment, REACTOME reaction enrichment, and CLINVAR human diseases enrichment analyses were conducted using ClueGO plug-in of Cytoscape software (Table S4).21,22 As shown in Figure 2A, genes in blue module were particularly enriched in neuroactive ligand-receptor interaction, intrinsic component of presynaptic membrane, taste transduction, and Golgi cis cisterna. Meanwhile, genes in yellow module were mainly involved in detection of chemical stimulus related to sensory perception of bitter taste, and hematopoietic stem cell differentiation (Figure 2B).
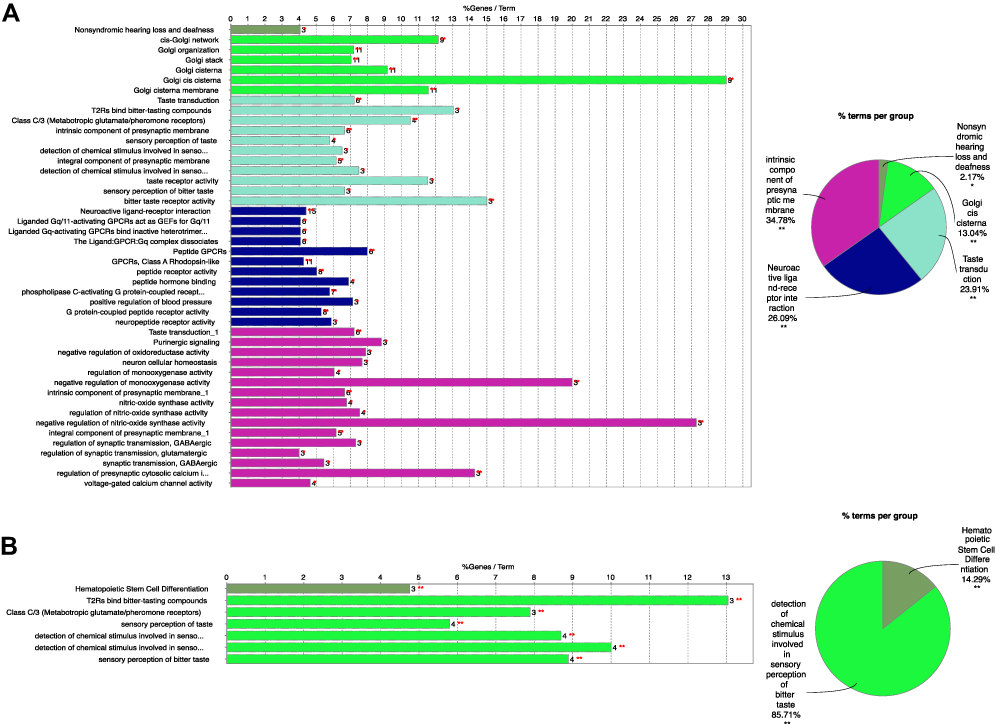 |
Figure 2 Functional Enrichment analysis of genes in blue (A) and yellow (B) modules. Different color displayed distinct GO terms. Statistical significance was derived by two-sided tests. |
Hub Genes and Pathway Determination with PPI and Modular Analyses
Protein–protein interaction relationships of proteins in two modules were established using STRING. Finally, 164, 73 nodes and 79, 32 edges in blue (PPI enrichment p-value=6.62e-14) and yellow (PPI enrichment p-value=6.01e-08) modules were obtained, separately (Figure 3A and B). The degree of connectivity of genes was calculated using the cytoHubba plug-in of Cytoscape software. Genes with top 10 degree of connectivity were displayed in Figure 3C and D. Considering the degree and betweenness, HTR1B, P2RY4, GRM5, GRPR, and NMBR in blue module network and CXCL11, CXCL5, and IL5 in yellow module network were selected as hub genes (Table S5). Those candidate genes possibly have an important impact in glioma progression and can be regarded as diagnostic biomarkers.
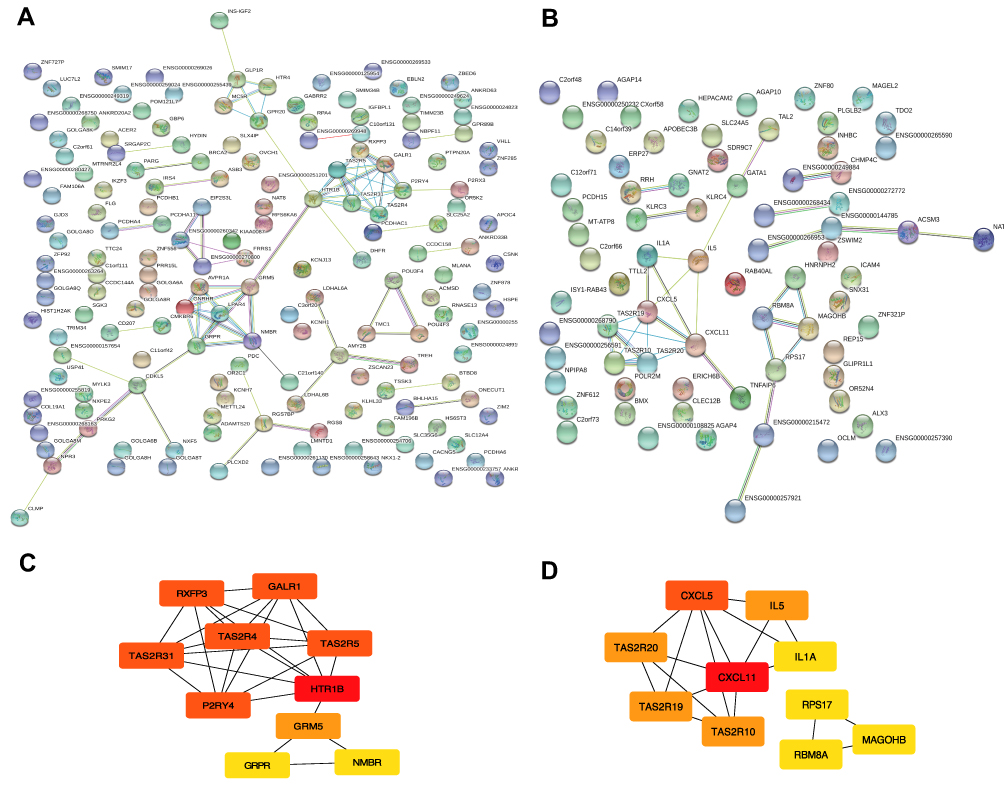 |
Figure 3 Module visualisation and Identification of hub genes. Visualisation of the gene co-expression network of the blue (A) and yellow modules (B) were generated using Cytoscape. Top 10 hub genes in blue (C) and yellow (D) modules were calculated by cytoHubba ranked by degree. The darkness of red in nodes represents the depth of degree. |
Transcriptional Expression Patterns of Key Candidate Genes in TCGA and GTEx
To investigate if the eight hub genes were potential prognostic biomarkers of glioma, we first compared these mRNA expression levels in GTEx dataset containing 207 normal tissue and in TCGA cohort which comprised 163 GBM and 518 LGG specimens. Consequently, we found that GRPR, CXCL5, and CXCL11 mRNA were more abundant in glioma than in control specimens both in GBM and LGG (Figure S4A-C). Whereas, mRNA expression of other five genes did not show significant difference even enriched highly in control compared to glioma samples. After checking the expression patterns about different progression status of glioma of these three central genes in CGGA database, the findings implicated that CXCL11 expression was relatively higher in recurrent than primary type significantly, especially in glioma and WHO II grade (Figure 4A and B and S4G).
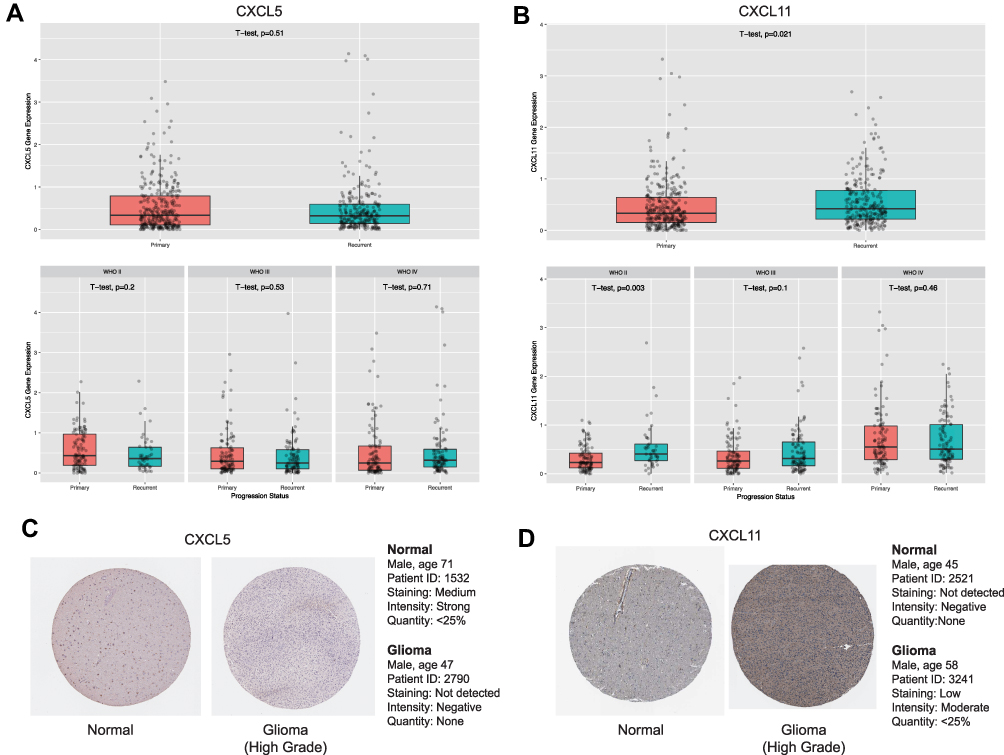 |
Figure 4 Expressions patterns about different grades and progression status of CXCL5 (A) and CXCL11 (B) in CGGA. Expression levels of CXCL5 (A) and CXCL11 (B) among normal, GBM and LGG samples. as well as in different molecular subtypes of GBM. P-value was tested by t-test. Immunohistochemical analyses of CXCL5 (C) and CXCL11 (D) protein expression levels in normal brain tissues (cerebral cortex) and glioma cancer specimens. Images were obtained from the HPA resource. |
As GRPR, CXCL5, and CXCL11 were mainly up-regulated in GBM, we explored these expression across distinct subtypes according to Verhaak’s classification by GEPIA 2.0.23 We compared the mRNA levels between four molecular stratifications, namely classical (n=40), mesenchymal (n=55), neural (n=28), and proneural (n=37). GRPR and CXCL11 mRNA were enriched in classical glioblastoma in comparison with other subtypes (Figure S4D and S4F). Meanwhile, mesenchymal glioblastoma highly expressed CXCL5 than other subtypes (Figure S4E). Immunohistochemical analysis was also investigated and the results revealed that the protein expression level of CXCL11 was accumulated in glioma tumor tissues compared to non-tumor tissues. Remarkably, we noted that protein expression of CXCL5 showed the opposite trend which need more investigation. Immunohistochemistry Images were captured from the Human Protein Atlas (http://www.proteinatlas.org) online database (Figure 4C and D).
Survival Prediction of GBM Patients
To get an indication of the relationship between higher GRPR, CXCL5, and CXCL11 mRNA abundance and survival situation of glioma patients, we analyzed Kaplan–Meier survival curves of the all glioma cohorts in TCGA. The results suggested that a high level of GRPR mRNA was associated with clearly shorter overall survival (OS) as well as disease free survival (DFS) (Figure 5A). Similarly, high expressions of CXCL5 and CXCL11 were linked with a worse prognosis of glioma patients (Figure 5B and C).
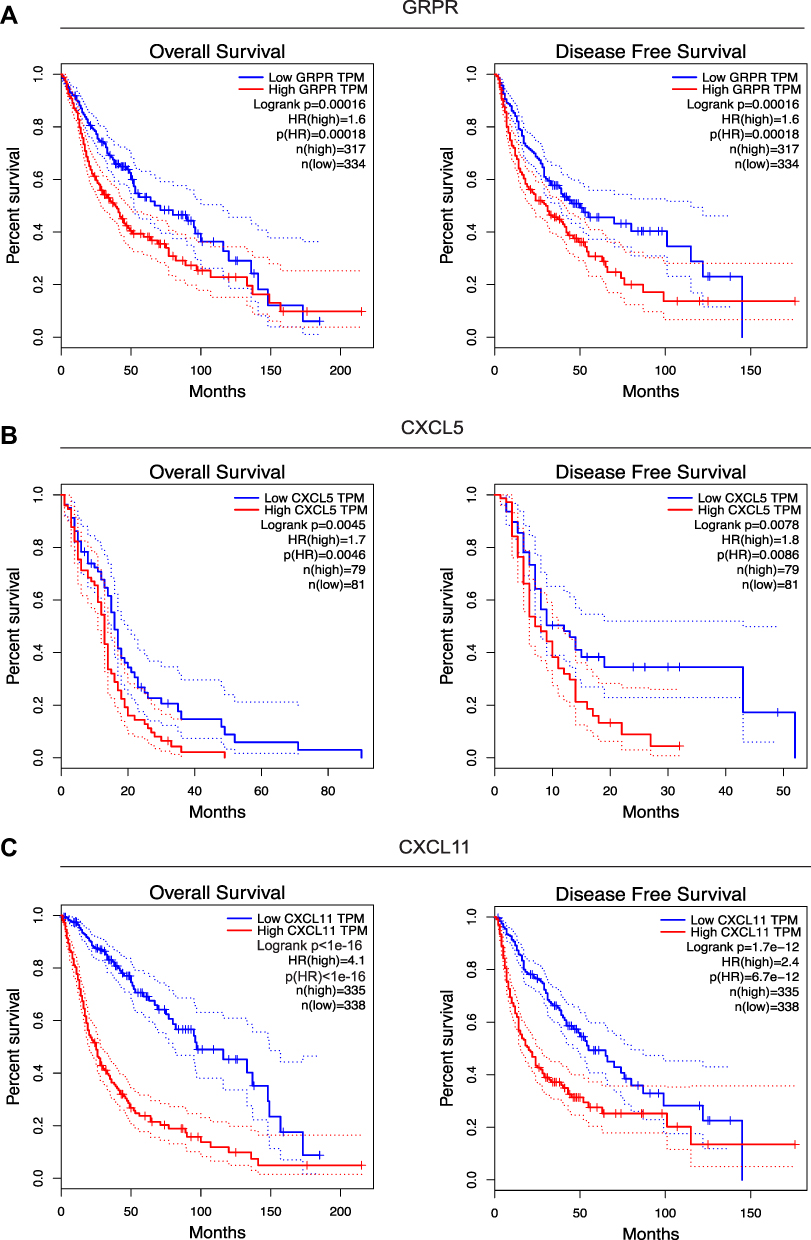 |
Figure 5 Survival curves between groups with low and high GRPR (A), CXCL5 (B), and CXCL11 (C) expressions in TCGA. The red and green lines represent cases with high and low expressions, separately. The X axis indicates survival time (months) and the Y axis indicates the present survival (%). |
To further confirm the prognostic roles of GRPR, CXCL5, and CXCL11, two GEO (Gene Expression Omnibus) datasets (GSE4412 and GSE7696) of GBM and glioma were evaluated by PrognoScan database.20 As shown in Figure S5, the higher expression of these hub genes might figure a worse OS in GBM and glioma, especially for CXCL5 and CXCL11 whose showed statistical significance. These findings offered evidence for the prognostic power of the candidate implications GRPR, CXCL5, and CXCL11.
Association of Immune Infiltration Level and Immune Checkpoints
Tumor infiltrating lymphocytes (TILs) have been found to be an independent predictor of survival in cancers.24 Thus, we researched whether GRPR, CXCL5, and CXCL11 expression was correlated with immune infiltration levels in GBM by TIMER tools. The findings implied that CXCL5 and CXCL11 had marginal positively associations with infiltrating levels of neutrophil, B and dendritic cell, while negatively correlated with CD8+ T cell and CD4+ T cell in GBM. GRPR expression had relatively negative relationships with these immune cells except B cell and CD8+ T cell (Figure 6A–C). Then, Pearson correlation analysis was performed between three candidates and several immune checkpoints, which have been developed as therapeutic targets in clinical characterization.25 As shown in Figure 6D, the outcomes revealed that CXCL11, CXCL5, and GRPR was positively associated with 20 checkpoint members, suggesting possible synergistic effects of the hub genes with immune checkpoints, especially with CD28, CD80, IDO1, and PDCD1LG2. Notably, co-expression of PD-1 with CXCL5 was consistent with the finding in past study.26
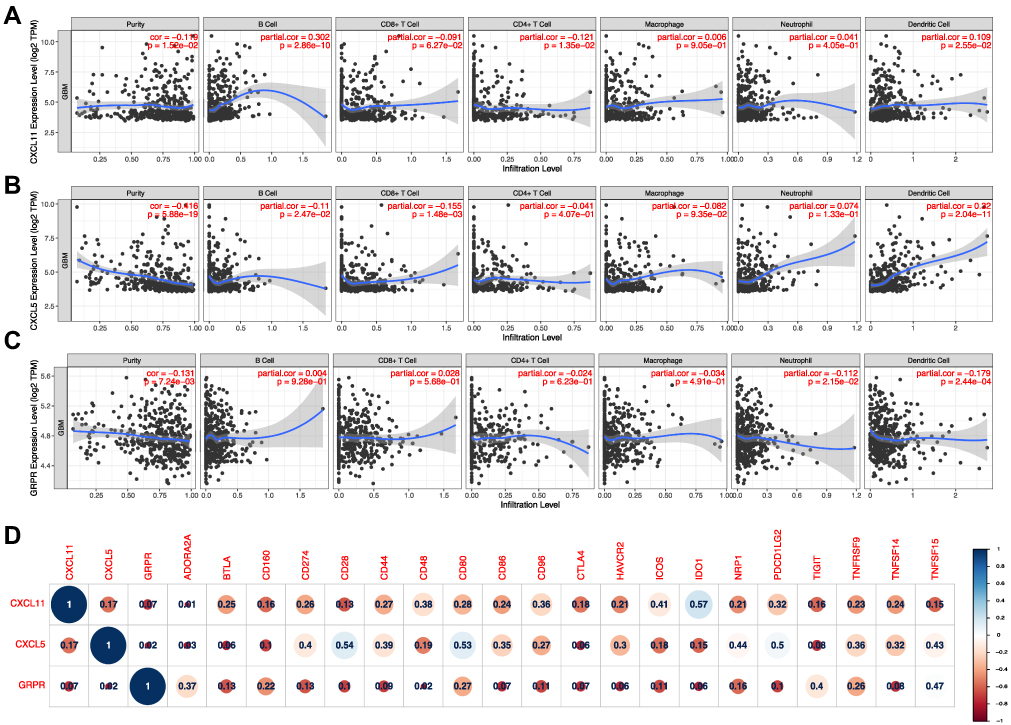 |
Figure 6 Correlation of CXCL5 (A), CXCL11 (B), and GRPR (C) expressions with immune infiltration level in GBM. (D) Corrplot map of three DEGs and immune checkpoint markers in TCGA-GBM database. |
Verification of Functional Roles Using qRT-PCR
To gain better insight on mRNA expression levels of three core DEGs in vivo, qRT-PCR validation was performed based on our study cohort patients. The Clinical data of 75 patients were tabulated in Table S6. The qRT-PCR results revealed that the relative expression of GRPR, CXCL5, and CXCL11 were distinctly increased in the glioma group as compared to the control treatment (Figure 7A–C). Moreover, the same trends were observed between LGG and control specimens (Figure 7D–F). To sum up, the qRT-PCR results were consistent with our integrative meta-analysis, suggesting the critical role of these core DGEs might play necessary roles in the mechanism of glioma, especially in GBM.
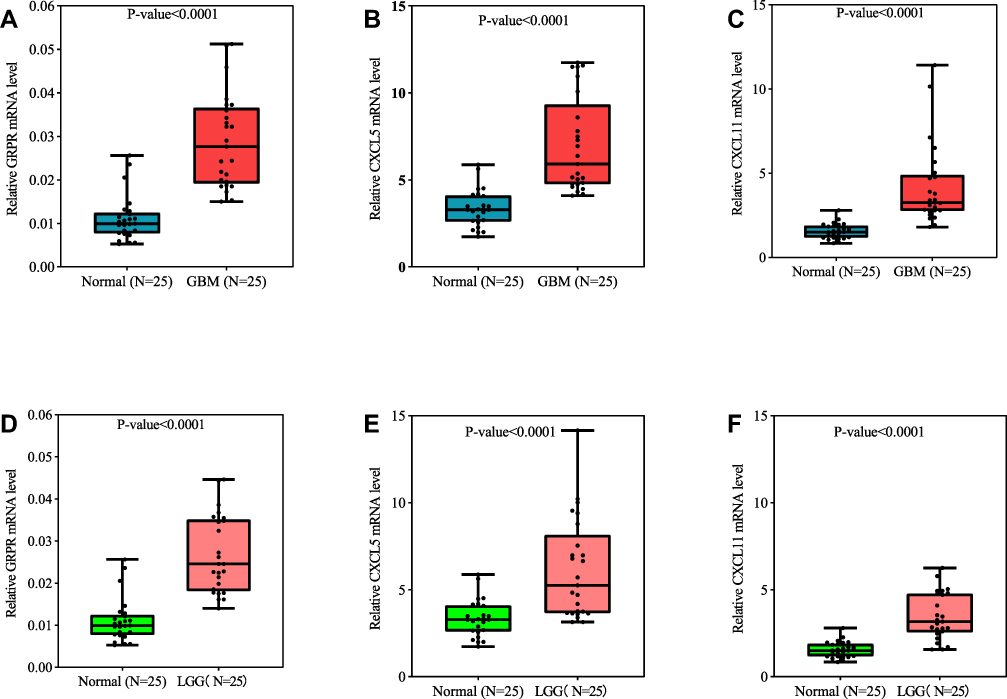 |
Figure 7 GRPR (A), CXCL5 (B), and CXCL11 (C) expression levels correlated in glioma tissue. qRT-PCR analysis of GRPR (A and D), CXCL5 (B and E), and CXCL11 (C and F) in GBM (n=25), LGG (n=25), and control brain tissues (n=25). P-value was tested by t-test. |
Discussion
Glioblastoma multiforme (GBM) is a common aggressive form of primary brain tumor, characterized by rapid cell proliferation, resistance to apoptosis, and extensive invasion.27 Due to resistance to currently available therapeutic regimens, the prognosis for patients with GBM is remarkably poor. As a key factor of glioma classification, glioma grade is involved in metastasis and tumor relapse while usually estimated by tumor imaging and biopsy.28 To be a supplement to existing techniques, molecular biomarker analysis has a wide application perspective. Although there are several published studies using WGCNA on glioma, most of them has focused on the relationship between module and traits like age, gender, overall survival, IDH mutation, and so on.21,29–31 In this case, our study paid more attention to identify genes which are clustered with primary and recurrent types of four WHO grade I to IV. Similarly, Mukherjee’s work has analyzed relationship between module and WHO grade II to IV.32 The enriched GO terms in above previous research contain negative regulation of response to cytokine stimulus, fall in line with our findings about chemokines.
Chemokines, a multifunctional type of small-conserved proteins, are reported to be essential for many biological processes, especially tumor cell proliferation, migration and invasion.33,34 Chemokines and its receptors have been found to dictate cancer development and progression through epithelial-mesenchymal transition.35 Chemokines act as principal components which express at tumor site and interact with immune cells.36 For sample, CXCL11 is elevated in diverse solid tumors mediating tumor progression, metastasis, and lymphocyte infiltration.37 Inhibition of CXCL11 by neutralizing antibodies might prominently decrease the degree of morphine tolerance and attenuate the activation of astrocytes.38 As for another important chemokine CXCL5, overexpressed CXCL5 is found in various cancers and also facilitates tumor progression and metastasis.39,40 CXCL5 promotes the metastatic potential of cells by upregulation of Snail in breast cancer.41 In nasopharyngeal carcinoma, CXCL5 induces epithelial-mesenchymal transition (EMT) and activates neutrophils to promotes nasopharyngeal carcinoma, lung, and gastric cancer metastases.42,43 Furthermore, CXCL5 from cancer-related fibroblasts enhances PD-L1 expression in colorectal carcinoma and melanoma cells.26 Of note, recent studies demonstrate that CXCL chemokines play important roles in glioblastoma biology, involved in cell proliferation, death and migration.44 CXCL5 stimulates glioma cells proliferation and migration in autocrine- and paracrine-dependent ways.45
Besides, gastrin-releasing peptide receptor (GRPR) acts as proliferative and inflammatory factors in living systems.46 The activation of GRPR promotes cell proliferation, whereas GRPR antagonists induce antiproliferative effects in both in vitro and in vivo experimental GBM models. In addition, according to the knockdown of GRPR induces senescence in GBM cells, GRPR have the potential to serve as a therapeutic target in brain tumors.47
These studies implicate that GRPR, CXCL11, and CXCL5 play diverse roles in oncoma development and progression. As mentioned, GRPR, CXCL11, and CXCL5 are the centermost upregulated gene in our network analysis. Expression of GRPR, CXCL11, and CXCL5 were higher in glioma patients than health control. Thus, our findings that GRPR, CXCL11, and CXCL5 are tightly linked to glioma is consistent with above earlier reports, suggesting our analysis method is reliable and practical. Moreover, expression of CXCL11 involves in mitogen-activated protein kinase (MAPK) pathway,48 known as hyperactivated by genetic alteration in GBM. We consequently investigated the Pearson correlation between the expression of three candidate genes and that of Top 10 altered genes in GBM (Figure S6). The significant associations were observed between CXCL11 with EGFR, CXCL5 with ATRX and PTEN, as well as GRPR with FLG, NF1, TP53, and TTN. The observations implied high expression of these DEGs might mirror the existence of the oncogenic mutations frequently existed in GBM. We next tested whether these DEGs have an intrinsic relationship in glioma by analyzing the STRING database. We found that there is one significant connection between CXCL11 and CXCL5. However, there are some limitations need to be addressed in this study. Since the glioma patient samples are usually hard to get, we just checked a small cohort of 25 GBM patients in this study. Functional verification of the selected genes in large-scale patient samples would support our results better. Moreover, the knockout mouse model of each candidate DEG will facilitate a clear understanding of its role in glioma pathological mechanisms.
Abbreviations
WHO, World Health Organization; GBM, Glioblastoma multiforme; LGG, lower grade glioma; WGCNA, weighted gene co-expression network analysis; ME, module eigengene; CXCL11, chemokine (C-X-C motif) ligand 11; CXCL5, chemokine (C-X-C motif) ligand 5; GRPR, gastrin-releasing peptide receptor; CGGA, Chinese Glioma Genome Atlas; TCGA, The Cancer Genome Atlas; PPI, protein–protein interaction; EPC, Edge Percolated Component; MNC, Maximum Neighborhood Component; BN, Bottle neck; GO, Gene ontology; KEGG, Kyoto Encyclopedia of Genes and Genomes; qRT-PCR, quantitative reverse transcriptase polymerase chain reaction; GEPIA, Gene Expression Profiling Interactive Analysis; GTEx, Genotype-Tissue Expression; OS, overall survival; DFS, disease free survival; TIMER, Tumor Immune Estimation Resource; GEO, Gene Expression Omnibus; HPA, Human Protein Atlas; MAPK, mitogen-activated protein kinase.
Author Contributions
Hua Zhong conceptualized this research. Hua Zhong, Cao Fang, and Yinchun Fan performed data analyses and validation. Yunhu Yu wrote the manuscript. Guohua Yang helped in data consolidation and manuscript revision. All authors contributed to drafting or revising the article, have agreed on the journal to which the article will be submitted, gave final approval of the version to be published, and agree to be accountable for all aspects of the work.
Funding
This study was financially supported by the National Natural Science Foundation of China (81660421 and 818602460, Basic Research Project in Guizhou Province(No.[2018] 1425), and Young talents Found of Zunyi medical University (18zy-005).
Disclosure
The authors declare no conflicts of interest in this work.
References
1. Weller M, Wick W, Aldape K, et al. Glioma. Nat Rev Dis Prim. 2015.
2. Perry A, Wesseling P. Histologic classification of gliomas. In: Handbook of Clinical Neurology. 2016. ISBN 9780128029978.
3. Karsy M, Guan J, Cohen AL, Jensen RL, Colman H. New Molecular Considerations for Glioma: IDH, ATRX, BRAF, TERT, H3 K27M. Curr Neurol Neurosci Rep. 2017;17.
4. Eskilsson E, Røsland GV, Solecki G, et al. EGFR heterogeneity and implications for therapeutic intervention in glioblastoma. Neuro Oncol. 2018;20:743–752. doi:10.1093/neuonc/nox191.
5. Brennan CW, Verhaak RGW, McKenna A, et al. The somatic genomic landscape of glioblastoma. Cell. 2013;155:462. doi:10.1016/j.cell.2013.09.034.
6. Sinha S, Koul N, Dixit D, Sharma V, Sen E. IGF-1 induced HIF-1α-TLR9 cross talk regulates inflammatory responses in glioma. Cell Signal. 2011;23:1869–1875. doi:10.1016/j.cellsig.2011.06.024.
7. Ludwig K, Kornblum HI. Molecular markers in glioma. J Neurooncol. 2017;134:505–512. doi:10.1007/s11060-017-2379-y
8. Eckel-Passow JE, Lachance DH, Molinaro AM, et al. Glioma Groups Based on 1p/19q, IDH, and TERT Promoter Mutations in Tumors. N Engl J Med. 2015;372:2499–2508. doi:10.1056/nejmoa1407279.
9. Wick W, Weller M, Van Den Bent M, et al. MGMT testing - The challenges for biomarker-based glioma treatment. Nat Rev Neurol. 2014;10:372–385. doi:10.1038/nrneurol.2014.100
10. Wang Q, Hu B, Hu X, et al. Tumor Evolution of Glioma-Intrinsic Gene Expression Subtypes Associates with Immunological Changes in the Microenvironment. Cancer Cell. 2017;32(1):42–56.e6. doi:10.1016/j.ccell.2017.06.003.
11. Langfelder P, Horvath S. WGCNA: an R package for weighted correlation network analysis. BMC Bioinform. 2008;9. doi:10.1186/1471-2105-9-559.
12. Zhang Q, Zhong H, Fan Y, et al. Immune and Clinical Features of CD96 Expression in Glioma by in silico Analysis. Front Bioeng Biotechnol. 2020;8:592. doi:10.3389/fbioe.2020.00592
13. Zhang B, Horvath S. A general framework for weighted gene co-expression network analysis. Stat Appl Genet Mol Biol. 2005. doi:10.2202/1544-6115.1128.
14. Bindea G, Mlecnik B, Hackl H, et al. ClueGO: a Cytoscape plug-in to decipher functionally grouped gene ontology and pathway annotation networks. Bioinformatics. 2009;25:1091–1093. doi:10.1093/bioinformatics/btp101.
15. Szklarczyk D, Gable AL, Lyon D, et al. STRING v11: protein-protein association networks with increased coverage, supporting functional discovery in genome-wide experimental datasets. Nucleic Acids Res. 2019;47:D607–D613. doi:10.1093/nar/gky1131.
16. Chin CH, Chen SH, Wu HH, Ho CW, Ko MT, Lin CY. cytoHubba: identifying hub objects and sub-networks from complex interactome. BMC Syst Biol. 2014;8. doi:10.1186/1752-0509-8-S4-S11.
17. Tang Z, Kang B, Li C, Chen T, Zhang Z. GEPIA2: an enhanced web server for large-scale expression profiling and interactive analysis. Nucleic Acids Res. 2019;47:W556–W560. doi:10.1093/nar/gkz430
18. Carithers LJ, Moore HM. The Genotype-Tissue Expression (GTEx) Project. Biopreserv Biobank. 2015;13:307–308. doi:10.1089/bio.2015.29031.hmm
19. Cao F, Zhang Q, Chen W, et al. IL-6 increases SDCBP expression, cell proliferation, and cell invasion by activating JAK2/STAT3 in human glioma cells. Am J Transl Res. 2017;9:4617–4626.
20. Mizuno H, Kitada K, Nakai K, Sarai A. PrognoScan: a new database for meta-analysis of the prognostic value of genes. BMC Med Genomics. 2009;2. doi:10.1186/1755-8794-2-18
21. Xu P, Yang J, Liu J, et al. Identification of glioblastoma gene prognosis modules based on weighted gene co-expression network analysis 06 Biological Sciences 0604 Genetics. BMC Med Genomics. 2018. doi:10.1186/s12920-018-0407-1
22. He D, Liu ZP, Chen L. Identification of dysfunctional modules and disease genes in congenital heart disease by a network-based approach. BMC Genom. 2011. doi:10.1186/1471-2164-12-592.
23. Verhaak RGW, Hoadley KA, Purdom E, et al. Integrated Genomic Analysis Identifies Clinically Relevant Subtypes of Glioblastoma Characterized by Abnormalities in PDGFRA, IDH1, EGFR, and NF1. Cancer Cell. 2010;17:98–110. doi:10.1016/j.ccr.2009.12.020.
24. Chen B, Khodadoust MS, Liu CL, Newman AM, Alizadeh AA. Profiling tumor infiltrating immune cells with CIBERSORT. Methods Mol Biol. 2018;Vol. 1711:
25. Bouffet E, Larouche V, Campbell BB, et al. Immune checkpoint inhibition for hypermutant glioblastoma multiforme resulting from germline biallelic mismatch repair deficiency. J Clin Oncol. 2016;34:2206–2211. doi:10.1200/JCO.2016.66.6552.
26. Li Z, Zhou J, Zhang J, Li S, Wang H, Du J. Cancer-associated fibroblasts promote PD-L1 expression in mice cancer cells via secreting CXCL5. Int J Cancer. 2019;145:1946–1957. doi:10.1002/ijc.32278.
27. Batash R, Asna N, Schaffer P, Francis N, Schaffer M. Glioblastoma Multiforme, Diagnosis and Treatment; Recent Literature Review. Curr Med Chem. 2017;24. doi:10.2174/0929867324666170516123206.
28. Shergalis A, Bankhead A, Luesakul U, Muangsin N, Neamati N. Current challenges and opportunities in treating glioblastomas. Pharmacol Rev. 2018. doi:10.1124/pr.117.014944.
29. Lin S, Xu H, Zhang A, et al. Prognosis Analysis and Validation of m6A Signature and Tumor Immune Microenvironment in Glioma. Front Oncol. 2020. doi:10.3389/fonc.2020.541401.
30. Yang Q, Wang R, Wei B, et al. Candidate Biomarkers and Molecular Mechanism Investigation for Glioblastoma Multiforme Utilizing WGCNA. Biomed Res Int. 2018. doi:10.1155/2018/4246703.
31. Xiang Y, Zhang CQ, Huang K. Predicting glioblastoma prognosis networks using weighted gene co-expression network analysis on TCGA data. BMC Bioinform. 2012. doi:10.1186/1471-2105-13-s2-s12.
32. Mukherjee S. Quiescent stem cell marker genes in glioma gene networks are sufficient to distinguish between normal and glioblastoma (GBM) samples. Sci Rep. 2020. doi:10.1038/s41598-020-67753-5.
33. Griffith JW, Sokol CL, Luster AD. Chemokines and chemokine receptors: positioning cells for host defense and immunity. Annu Rev Immunol. 2014;32:659–702. doi:10.1146/annurev-immunol-032713-120145
34. Poeta VM, Massara M, Capucetti A, Bonecchi R. Chemokines and chemokine receptors: new targets for cancer immunotherapy. Front Immunol. 2019;10.
35. Nagarsheth N, Wicha MS, Zou W. Chemokines in the cancer microenvironment and their relevance in cancer immunotherapy. Nat Rev Immunol. 2017;17:559–572.
36. Sjöberg E, Meyrath M, Milde L, et al. A novel ACKR2-Dependent role of fibroblast-derived CXCL14 in epithelial-to-mesenchymal transition and metastasis of breast cancer. Clin Cancer Res. 2019;25:3702–3717. doi:10.1158/1078-0432.CCR-18-1294.
37. Puchert M, Obst J, Koch C, Zieger K, Engele J. CXCL11 promotes tumor progression by the biased use of the chemokine receptors CXCR3 and CXCR7. Cytokine. 2020;125:154809. doi:10.1016/j.cyto.2019.154809.
38. Guo G, Peng Y, Xiong B, et al. Involvement of chemokine CXCL11 in the development of morphine tolerance in rats with cancer-induced bone pain. J Neurochem. 2017;141:553–564. doi:10.1111/jnc.13919.
39. Kawamura M, Toiyama Y, Tanaka K, et al. CXCL5, a promoter of cell proliferation, migration and invasion, is a novel serum prognostic marker in patients with colorectal cancer. Eur J Cancer. 2012;48:2244–2251. doi:10.1016/j.ejca.2011.11.032.
40. Zhou SL, Zhou ZJ, Hu ZQ, et al. CXCR2/CXCL5 axis contributes to epithelial-mesenchymal transition of HCC cells through activating PI3K/Akt/GSK-3β/Snail signaling. Cancer Lett. 2015;358:124–135. doi:10.1016/j.canlet.2014.11.044.
41. Hsu YL, Hou MF, Kuo PL, Huang YF, Tsai EM. Breast tumor-associated osteoblast-derived CXCL5 increases cancer progression by ERK/MSK1/Elk-1/Snail signaling pathway. Oncogene. 2013;32:4436–4447. doi:10.1038/onc.2012.444.
42. Qiu WZ, Zhang HB, Xia WX, et al. The CXCL5/CXCR2 axis contributes to the epithelial-mesenchymal transition of nasopharyngeal carcinoma cells by activating ERK/GSK-3β/snail signalling. J Exp Clin Cancer Res. 2018;37. doi:10.1186/s13046-018-0722-6.
43. Mao Z, Zhang J, Shi Y, et al. CXCL5 promotes gastric cancer metastasis by inducing epithelial-mesenchymal transition and activating neutrophils. Oncogenesis. 2020;9. doi:10.1038/s41389-020-00249-z.
44. Bruyère C, Mijatovic T, Lonez C, et al. Temozolomide-induced modification of the CXC chemokine network in experimental gliomas. Int J Oncol. 2011;38:1453–1464. doi:10.3892/ijo.2011.964.
45. Dai Z, Wu J, Chen F, et al. CXCL5 promotes the proliferation and migration of glioma cells in autocrine- and paracrine-dependent manners. Oncol Rep. 2016;36:3303–3310. doi:10.3892/or.2016.5155.
46. Wang W, Wu KJ, Vellaisamy K, Leung CH, Ma DL. Peptide-Conjugated Long-Lived Theranostic Imaging for Targeting GRPr in Cancer and Immune Cells. Angew Chemie - Int Ed. 2020;59:17897–17902. doi:10.1002/anie.202007920.
47. Flores DG, Meurer L, Uberti AF, et al. Gastrin-releasing peptide receptor content in human glioma and normal brain. Brain Res Bull. 2010;82:95–98. doi:10.1016/j.brainresbull.2010.02.014.
48. Hueso L, Ortega R, Selles F, et al. Upregulation of angiostatic chemokines IP-10/CXCL10 and I-TAC/CXCL11 in human obesity and their implication for adipose tissue angiogenesis. Int J Obes. 2018;42. doi:10.1038/s41366-018-0102-5.
 © 2021 The Author(s). This work is published and licensed by Dove Medical Press Limited. The full terms of this license are available at https://www.dovepress.com/terms.php and incorporate the Creative Commons Attribution - Non Commercial (unported, v3.0) License.
By accessing the work you hereby accept the Terms. Non-commercial uses of the work are permitted without any further permission from Dove Medical Press Limited, provided the work is properly attributed. For permission for commercial use of this work, please see paragraphs 4.2 and 5 of our Terms.
© 2021 The Author(s). This work is published and licensed by Dove Medical Press Limited. The full terms of this license are available at https://www.dovepress.com/terms.php and incorporate the Creative Commons Attribution - Non Commercial (unported, v3.0) License.
By accessing the work you hereby accept the Terms. Non-commercial uses of the work are permitted without any further permission from Dove Medical Press Limited, provided the work is properly attributed. For permission for commercial use of this work, please see paragraphs 4.2 and 5 of our Terms.