")
Back to Journals » ClinicoEconomics and Outcomes Research » Volume 12
Disparities in Emergency Transport of Women with a Preterm Labor Diagnosis in Urban vs Rural Areas in the US
Authors Vilalta A , Troeger KA
Received 16 April 2020
Accepted for publication 29 May 2020
Published 22 June 2020 Volume 2020:12 Pages 327—332
DOI https://doi.org/10.2147/CEOR.S257390
Checked for plagiarism Yes
Review by Single anonymous peer review
Peer reviewer comments 2
Editor who approved publication: Dr Samer Hamidi
Video abstract presented by Adrian Vilalta.
Views: 128
Adrian Vilalta,1 Kathleen A Troeger2
1Market Access Department, Hologic, Inc., San Diego, CA, USA; 2Market Access Department, Hologic, Inc., Marlborough, MA, USA
Correspondence: Adrian Vilalta Email [email protected]
Objective: This study evaluated patterns of utilization and costs of emergency transport among women with a diagnosis of preterm labor in the US.
Methods: The IBM® Treatment Pathways® tool was used to interrogate a cohort randomly selected from the IBM’s MarketScan® dataset. Differences in costs and utilization patterns were assessed by the type of emergency transport service and geography.
Results: A cohort of 12,995 women between the ages of 16 and 45 met the inclusion criteria. About 1,029 (7.9%) of these women had evidence of emergency transport within a day of the preterm labor diagnosis. In this cohort, the median cost of emergency ground transportation was US$834; air transport had a median cost of US$22,922. Additionally, 3.1% (284) women out of a cohort of 8,728 women ages of 16 and 45 with a diagnosis of false labor required emergency transport within 7 days suggesting that they were discharged too soon.
Discussion: The prevalence of emergency transport for preterm labor in rural areas is significantly higher compared to non-rural areas. In addition, the disproportionate use of air transport in rural areas increases the costs of the preterm labor event. Moreover, disparities in both utilization rates and costs were identified for different parts of the country.
Keywords: preterm labor, emergency transport, cost, rural, urban, disparities
Introduction
Preterm birth, defined as birth before 37 weeks of gestation, is a significant health care concern. According to recent statistics from the Centers for Disease Control and Prevention (CDC), approximately 1 in 10 infants are born prematurely.1 Premature infants are at an increased risk of acute and long-term health issues and therefore require increased medical expenses compared with infants born at term.2,3 In the United States, it is estimated that preterm births result in an estimated economic burden in excess of US$26 billion per year.4 All costs are expressed in US$.
Predicting which women will deliver prematurely is difficult which often results in the onset of delivery under suboptimal circumstances.5 In addition, according to a recent analysis, about 76% of women with symptoms of preterm labor (PTL) are discharged home after their first encounter with the emergency department. Of these, close to 20% go on and deliver within 3 days.6
Given the imperative for transport of women with symptoms of PTL to facilities capable of providing adequate care for a premature infant, understanding the utilization and associated costs of emergency transport (ET) of these women is important to both improve clinical outcomes and contain rising health costs.7–11 This is particularly important to patients living in rural areas given the reported increase in rural hospital closures.12
Methods
Data presented here were obtained through a retrospective, observational claims-based analysis using a de-identified database to describe the patterns of emergency transfer utilization and associated costs of patients with a diagnosis of PTL.
Patient Selection
Women aged 16–45 years with a diagnosis of PTL and continuous enrollment in either a Commercial or Medicaid insurance plan from 2012 to 2019 were identified through the IBM® MarketScan® Treatment Pathways® database and analytical interface. The database contains the de-identified annual-pooled health care data of 10 million individuals insured commercially, or as part of the national Medicare and Medicaid programs throughout the entire United States. The database also includes details on whether patients live in urban or rural areas. The database can be freely accessed through IBM. This study is an analysis of existing de-identified data. No IRB approval was required.
Study Measures
Women 16–45 years of age with a diagnosis of PTL were identified using International Classification of Diseases (ICD-9 and ICD-10) codes. ICD codes are created by the World Health Organization and contain codes for diseases, signs and symptoms, abnormal findings, complaints, social circumstances, and external causes of injury or diseases.13 The study cohort was created by requiring continuous enrollment 30 days post PTL diagnosis. ET rates were evaluated using procedure and test codes (CPT) for land and air ET. The CPT code set is maintained by the American Medical Association.14 Evidence of birth was obtained using ICD-9 and ICD-10 and Diagnostic Related Group (DRG) codes as defined by the US Centers for Medicare and Medicaid Services (CMS).15 Details on codes used can be found in Supplement 1.
Limitations
As with other claims-based studies, the findings may be impacted by the sensitivity of the claims data. Claims data may underestimate health care utilization among low-income women including Medicaid-insured and the non-insured population.
Study Results
Country Averages
Analysis identified 12,995 women between the ages of 16 and 45 with a diagnosis of PTL and continuous enrollment 30 days post-diagnosis. The data show evidence of infant delivery for 12,235 (94%) of these patients with a median PTL cost of $11,189 ($14,975 mean cost) within 30 days of transport. This number climbs to a median of $18,640 ($31,470 mean cost) within the first year of the PTL event.
Our analysis identified 1,029 (8% of the total cohort) women in the cohort that required ET at the time of the PTL diagnosis. Of these, 977 (7.5% of the total cohort) were transported by ground and 68 (0.5% of the total cohort) by air. The median cost of emergency ground transportation was $834 (mean $1,598); air transport, primarily rotary wing, had a median cost of $22,922 ($25,918 mean cost), Figure 1.
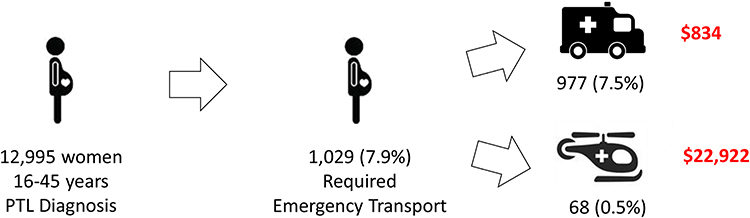 |
Figure 1 Proportion of women in the preterm labor cohort that required emergency transport and associated costs (US$) by transport type (ground or air). PTL stands for preterm labor diagnosis. |
Close to 75% of the women with a diagnosis of PTL delivered within a day of the diagnosis. Of the women that received ET, close to 78% of the patients that were transported by ground and 81% of those transported by air delivered within a day of the diagnosis. The differences in time to delivery for women that received emergency transport were found to be statistically significant when compared to the PTL cohort at large (p=0.0103 and p=2x10⁻⁴ for ground and air transport, respectively), Figure 2.
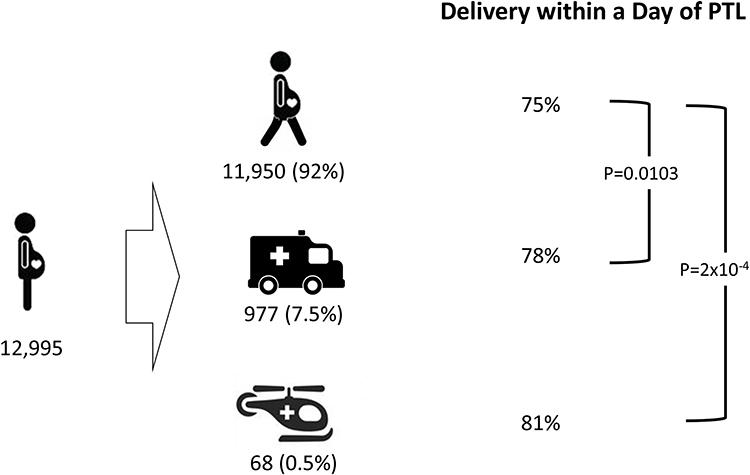 |
Figure 2 Proportion of births within a day of preterm labor diagnosis by transport type. Walking woman icon indicates ambulatory patient. PTL stands for preterm labor diagnosis. |
Urban vs Rural
Our analysis indicated that 11,215 (86.3%) of the women in the cohort lived in urban areas, 1,575 (12.1%) lived in rural areas and 205 (1.6%) in undesignated geographical areas. The urban and rural areas were identified based on the US Census Bureau definition.16 This study identified significant differences in ET utilization between urban and rural areas. Our data indicate that 14% of the women living in rural areas required emergency ground transport in contrast to 7% of those living in urban areas. This disparity is even more apparent when evaluating utilization of emergency air transport; 31 (0.3%) of women in urban areas received emergency air transport while 35 (2.2%) of women in rural areas did. Data also indicate a higher cost of transfer of women in rural areas vs those in urban environments for both ground ($996 vs $820 median cost, respectively) and air transport ($23,700 vs $21,300 median cost, respectively), Figure 3. Although to our knowledge, no recent analysis of emergency transport disparities has been published, there are parallels with recent findings on rural-urban disparities in pregnancy intentions, births, and abortions.17
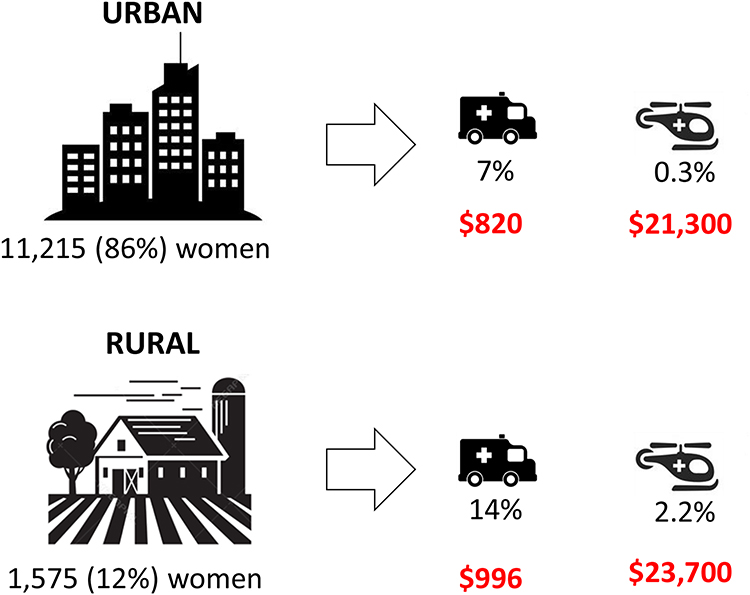 |
Figure 3 Urban vs rural patterns of emergency transport utilization and associated median costs (US$) for women with a preterm labor diagnosis (PTL). Note: Two hundred five women of the original 12,995 cohort lived in undesignated geographical areas and were therefore not included in the urban vs rural analysis. |
Interestingly, the analysis revealed that close to 86% of the women receiving air transport in urban areas delivered within a day of diagnosis compared to 76% of those living in rural areas. No differences in times to delivery were identified in women receiving ground transport in urban vs rural areas.
False Labor Transport
In a complementary analysis, 3.1% (272) women out of a cohort of 8,728 with an original diagnosis of false labor required ground ET within 30 days of the diagnosis. Of these women 71.6% delivered within 7 days of transport. In contrast, 77% of women with a diagnosis of false labor delivered within 7 days.
Regional Differences
Our data also indicate that there are disparities in both utilization and cost of ET for PTL across the country. Utilization of emergency ground transportation rates in the PTL cohort ranged from 11% (New England) to 5% (Pacific); median costs ranged from $1,663 (Pacific) to $694 (East North Central). In this analysis, regions of the country were consistent with the definitions used by the US Census Bureau.18 These findings are summarized in Figure 4.
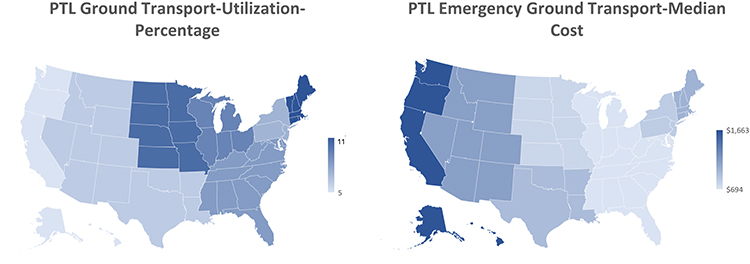 |
Figure 4 Regional differences in utilization and associated median cost of ground emergency transportation of women with a preterm labor diagnosis across the United States. PTL stands for preterm labor diagnosis. |
Discussion
According to a 2007 report from the Institute of Medicine, the average first year medical costs, including both inpatient and outpatient care were about 10 times greater for preterm ($32,325) than for full term infants ($3,325).4 Our analysis indicates a mean first-year cost after PTL of $31,470, is in good agreement with the published figure. Our data also show that almost 30% of this cost is incurred with 30 days of the PTL event.
A 2012 report from the Government Accountability Office (GAO) revealed that ground ambulance costs vary widely. In their sample, the median cost was $429, ranging from $224 to $2,204. In their analysis, the GAO identified the volume and intensity of transports, and proportion of government subsidies as key factors influencing the cost.19 The median cost of ground transfer in our analysis is $834 ($1,598 mean), close to double that reported by the GAO. This likely reflects the intensity of the services provided during transport.
A recent analysis of emergency air transport charges indicates the increasing cost of these services.10 According to this analysis, the median charge increased by approximately 60%, from $24,000 to $39,000, for both types of air ambulances (rotary and fixed wing). Interestingly, the authors also report an increase of 21% in the utilization of rotary wing transport between 2012 and 2016. Data presented here show a median cost of air transfer of $22,922 ($25,918 mean). Although these figures are in good agreement with those of Bai et al for earlier in the time frame they studied, they are significantly lower than the $39,000 costs they estimated for 2016. These differences may reflect differences in methodology and datasets. In addition, the number of patients that received air transport in our study is much smaller than that analyzed by Bai et al, which also contributes to the uncertainty in our estimate.
Data presented here suggest that women receiving transport have a more acute need for high-level neonatal services given that a higher proportion of them end up delivering soon after transport. Perhaps not surprisingly, women living in rural areas require ET at much higher rates than those in urban areas. The median cost for ground transfer for women in rural areas is close to 20% higher than that in urban areas, most likely reflecting an increase in the mileage charges.
Our analysis of transport patterns in women with a diagnosis of false labor indicate that 3.1% of them required ET within four weeks of the diagnosis and almost 72% delivered within a week of the transport event. Our analysis indicates that the proportion of women that deliver within a week of false labor diagnosis is approximately the same regardless of whether they required ET. These facts highlight that many women that receive a diagnosis of false labor are likely to have to return to the health care facility soon after the diagnosis. These finding is in line with previous reports to this effect.6
Regional differences in utilization are multi-factorial with likely key factors including proportion of urban vs rural population, number and location of high-level prenatal care facilities and median cost of the transport service. Our data indicate a marked inverse correlation between cost of transport and utilization across the country. However, a deeper analysis will be required to fully understand the contribution of each factor to the PTL ET rates.
Conclusions
Approximately one in ten women with a diagnosis of PTL requires ET; for women living in rural areas this number nearly doubles. In addition, PTL women tend to deliver their babies soon after transport highlighting the acute medical need.
Given the current trend of hospital consolidations and closures in rural areas of the country, it is expected that utilization of ET of women with symptoms of PTL will increase. These facts suggest that preterm neonatal outcomes and containing health care costs would greatly benefit from improved PTL triage practices.
Disclosure
Both Adrian Vilalta and Kathleen A Troeger are employees of Hologic Inc. The authors report no other conflicts of interest in this work.
References
1. Centers for Disease Control and Prevention. Preterm Birth. Available from: https://www.cdc.gov/reproductivehealth/MaternalInfantHealth/PretermBirth.htm.
2. Bird TM, Bronstein JM, Hall RW, Lowery CL, Nugent R, Mays GP. Late preterm infants: birth outcomes and health care utilization in the first year. Pediatrics. 2010;126(2):e311–9. doi:10.1542/peds.2009-2869
3. Jacob J, Lehne M, Mischker A, Klinger N, Zickermann C, Walker J. Cost effects of preterm birth: a comparison of health care costs associated with early preterm, late preterm, and full-term birth in the first 3 years after birth. Eur J Health Econ. 2017;18(8):1041–1046. doi:10.1007/s10198-016-0850-x
4. Behrman REBA. Societal Costs of Preterm Birth. Preterm Birth: Causes, Consequences, and Prevention. Washington, DC: Institute of Medicine (US) Committee on Understanding Premature Birth and Assuring Healthy Outcomes; 2007.
5. Slattery MM, Morrison JJ. Preterm delivery. Lancet. 2002;360(9344):1489–1497. doi:10.1016/S0140-6736(02)11476-0
6. Blackwell SC, Sullivan EM, Petrilla AA, Shen X, Troeger KA, Byrne JD. Utilization of fetal fibronectin testing and pregnancy outcomes among women with symptoms of preterm labor. Clinicoecon Outcomes Res. 2017;9:585–594. doi:10.2147/CEOR.S141061
7. Hankins GD, Clark SL, Pacheco LD, O’Keeffe D, D’Alton M, Saade GR. Maternal mortality, near misses, and severe morbidity: lowering rates through designated levels of maternity care. Obstet Gynecol. 2012;120:929–934. doi:10.1097/AOG.0b013e31826af878
8. Hohlagschwandtner M, Husslein P, Klebermass K, Weninger M, Nardi A, Langer M. Perinatal mortality and morbidity. Comparison between maternal transport, neonatal transport and inpatient antenatal treatment. Arch Gynecol Obstet. 2001;265(3):113–118. doi:10.1007/s004040100197
9. Chien LY, Whyte R, Aziz K, et al. Improved outcome of preterm infants when delivered in tertiary care centers. Obstet Gynecol. 2001;98:247–252. doi:10.1016/s0029-7844(01)01438-7
10. Bai G, Chanmugam A, Suslow VY, Anderson GF. Air ambulances with sky-high charges. Health Aff (Millwood). 2019;38(7):1195–1200. doi:10.1377/hlthaff.2018.05375
11. Delgado MK, Staudenmayer KL, Wang NE, et al. Cost-effectiveness of helicopter versus ground emergency medical services for trauma scene transport in the United States. Ann Emerg Med. 2013;62(4):351–64 e19. doi:10.1016/j.annemergmed.2013.02.025
12. Center for American Progress. Rural hospital closures reduce access to emergency care. Available from: https://www.americanprogress.org/issues/healthcare/reports/2019/09/09/474001/rural-hospital-closures-reduce-access-emergency-care/.
13. The World Health Organization. International Classification of Diseases (ICD) Information Sheet. Available from: https://www.who.int/classifications/icd/factsheet/en/.
14. American Medical Association. CPT (Current Procedural Terminology). Available from: https://www.ama-assn.org/amaone/cpt-current-procedural-terminology.
15. Centers for Medicare and Medicaid Services. Design and development of the Diagnosis Related Group (DRG). Available from: https://www.cms.gov/icd10m/version37-fullcode-cms/fullcode_cms/Design_and_development_of_the_Diagnosis_Related_Group_(DRGs).pdf.
16. US Census Bureau. 2010 census urban and rural classification and urban area criteria. Available from: https://www.census.gov/programs-surveys/geography/guidance/geo-areas/urban-rural/2010-urban-rural.html.
17. Sutton A, Lichter DT, Sassler S. Rural-urban disparities in pregnancy intentions, births, and abortions among us adolescent and young women, 1995–2017. Am J Public Health. 2019;109:1762–1769. doi:10.2105/AJPH.2019.305318
18. US Census Bureau. Census regions and divisions of the United States. Available from: https://www2.census.gov/geo/pdfs/maps-data/maps/reference/us_regdiv.pdf.
19. US Government Accountability Office. Ambulance providers-costs and medicare margins varied widely; transports of beneficiaries have increased. 2012. Available from: https://www.gao.gov/assets/650/649018.pdf.
 © 2020 The Author(s). This work is published and licensed by Dove Medical Press Limited. The full terms of this license are available at https://www.dovepress.com/terms.php and incorporate the Creative Commons Attribution - Non Commercial (unported, v3.0) License.
By accessing the work you hereby accept the Terms. Non-commercial uses of the work are permitted without any further permission from Dove Medical Press Limited, provided the work is properly attributed. For permission for commercial use of this work, please see paragraphs 4.2 and 5 of our Terms.
© 2020 The Author(s). This work is published and licensed by Dove Medical Press Limited. The full terms of this license are available at https://www.dovepress.com/terms.php and incorporate the Creative Commons Attribution - Non Commercial (unported, v3.0) License.
By accessing the work you hereby accept the Terms. Non-commercial uses of the work are permitted without any further permission from Dove Medical Press Limited, provided the work is properly attributed. For permission for commercial use of this work, please see paragraphs 4.2 and 5 of our Terms.