")
Back to Journals » OncoTargets and Therapy » Volume 10
Discrimination of serous cystadenoma from mucinous cystadenoma in the pancreas with contrast-enhanced ultrasonography: a prospective study in 61 patients
Authors Sun Y, Zhou F, Liu F, Hu Y , Tan S, Liang P , Linghu EQ, Yu X
Received 23 October 2016
Accepted for publication 16 January 2017
Published 28 February 2017 Volume 2017:10 Pages 1285—1294
DOI https://doi.org/10.2147/OTT.S125497
Checked for plagiarism Yes
Review by Single anonymous peer review
Peer reviewer comments 2
Editor who approved publication: Dr Tohru Yamada
Ya Sun,1,* Fubo Zhou,1,* Fangyi Liu,1 Yanyan Hu,1 Shuilian Tan,1 Ping Liang,1 Enqiang Linghu,2 Xiaoling Yu1
1Department of Interventional Ultrasound, 2Department of Gastroenterology, Chinese PLA General Hospital, Beijing, People’s Republic of China
*These authors contributed equally to this work
Objectives: The preoperative diagnosis between serous cystadenomas (SCAs) and mucinous cystadenomas (MCAs) in pancreas is significant due to their completely different biological behaviors. The purpose of our study was to examine and compare detailed contrast-enhanced ultrasonography (CEUS) images of SCAs and MCAs and to determine whether there are significant findings that can contribute to the discrimination between these two diseases.
Methods: From April 2015 to June 2016, 61 patients (35 patients with SCAs and 26 patients with MCAs) were enrolled in this study. Forty-three cases were confirmed by surgical pathology and 18 by comprehensive clinical diagnoses. All of the CEUS characteristics of these lesions were recorded: size, location, echogenicity, shape, wall characteristics, septa characteristics, and the presence of a honeycomb pattern or nodules. CEUS examinations were performed by two ultrasound physicians.
Results: Location (P=0.003), shape (P=0.000), thickness of the wall (P=0.005), the number of septa (P=0.001), and the honeycomb pattern (P=0.001) were statistically significantly different. A head–neck location, a lobulated shape, an inner regular honeycomb pattern, and a thin wall (<3 mm thick) were significant in diagnosing patients with SCAs. When two of these four findings were combined, we could achieve a sensitivity of 71.4% and a specificity of 80.8% to diagnose SCA; when three of these four findings were combined, the specificity was 100%. A body–tail location, a round/oval shape, 0–2 septa, and a thick wall (≥3 mm thick) were most often detected in patients with MCAs. When two of these four findings were combined, we could achieve a sensitivity of 88.5% and a specificity of 65.7% to diagnose MCA; when three of these four findings were combined, the area under the curve (Az) was highest at 0.832, with a sensitivity of 80.8% and a specificity of 85.7%.
Conclusions: The characteristics of tumor location, shape, thickness of the wall, the number of septa, and the honeycomb pattern by CEUS play an important role in the diagnosis of SCAs and MCAs. A combination of these findings can provide better diagnostic performance in the discrimination of SCAs from MCAs.
Keywords: contrast-enhanced sonography, ultrasound, pancreatic cystic tumor, serous cystadenoma, mucinous cystadenoma, diagnosis
Introduction
Cystic pancreatic lesions (CPLs) have been discovered more frequently due to a large number of high-quality cross-sectional imaging examinations. A radiologist could detect a CPL anywhere from 1 to 2 or 14 to 20 times per 100 patients with computed tomography (CT) or magnetic resonance imaging (MRI) examinations.1 In some institutions, the detection of a CPL has been a daily occurrence, with detection rates of ~25% during an autopsy.2 The common CPLs include pancreatic pseudocysts (PPSs), serous cystadenomas (SCAs), mucinous cystadenomas (MCAs), mucinous cystcarcinomas, intraductal papillary mucinous neoplasms (IPMNs), and solid pseudopapillary neoplasms, which are relatively less common.3,4 The old data suggest that pseudocysts, pancreatic nonneoplasms, are the most common CPLs, accounting for 75%–90% of cases,4,5 whereas the recent data reveal that pseudocysts drop to ~30%, and the cystic pancreatic neoplasms (CPNs) account for up to 60% of all CPLs.6 Among the CPNs, SCAs account for 16%–39%7–9 and MCAs represent 10%–50%.4,7
SCAs and MCAs are the most common types of CPNs but exhibit completely different biological behaviors. Although malignant serous cystadenocarcinomas have been reported,10 SCA is generally considered to be a benign lesion, and asymptomatic SCAs could be safely monitored during follow-up visits for many years. An MCA is an acknowledged neoplasm that could be malignant and should be surgically resected.5 The latest American Gastroenterological Association guidelines list “size” as a surgical reference criteria, asymptomatic patients with small size lesions can be followed-up and do not recommend surgery for all patients with MCA.4 However, an increase in cyst size was not found to predict malignancy, and specific guidelines as to when surgery should be considered has not been provided.11 Thus, the ability to distinguish between SCAs and MCAs is of great importance.
Conventional ultrasonography (US) is a widely available imaging modality with good diagnostic performance in the detection of CPLs.12 However, a US image is not adequate for the differentiation of types of CPLs due to its limited resolution.13 The development of contrast-enhanced ultrasonography (CEUS) has greatly increased the diagnostic capabilities of US and been used to better characterize CPLs already visible with US.14,15 A series of studies has described different features of SCAs and MCAs discernible with CT and MRI.11,16–18 However, the studies about CEUS that have demonstrated the advantages of different aspects of diagnosing CPLs with CEUS have not discussed detailed imaging differences between these two diseases.19–23 Therefore, the purpose of our study was to examine the detailed appearance of SCA and MCA on CEUS images and to determine whether there are significant findings that can contribute to the discrimination of these two diseases.
Materials and methods
This was a single-center multi-disciplinary prospective study. The ethics committee at the General Hospital of the Chinese People’s Liberation Army approved this prospective study.
Patients
Undetermined pancreatic cystic lesions detected by conventional ultrasound or contrast-enhanced CT (CE-CT)/contrast-enhanced MRI (CE-MRI) were prospectively included in our study. Patients were enrolled after signing an informed consent form before receiving the CEUS examinations. The exclusion criteria were as follows: patients were allergic to the intravenous contrast agent and the ultrasonic image had inadequate quality or was lack of precision because of out-of-plane movements. Patients with acute pancreatitis were also excluded.
From April 2015 to June 2016, 61 patients (48 women and 13 men; mean age 46.9±14.5 years; 16–76 years) were finally evaluated for the presence of a pancreatic cystadenoma. Of these patients, 43 cases (22 SCA and 21 MCA) were confirmed by surgical pathology and 18 cases (13 SCA and 5 MCA) were identified with a comprehensive clinical evaluation. All of the 18 patients with clinical diagnoses had been evaluated with contrast-enhanced CE-CT and CE-MRI less than a week before the CEUS examination and underwent endoscopic ultrasonography (EUS) with EUS-guided fine needle aspiration after the CEUS examination. The standards and results for these comprehensive diagnoses were as follows: 11 patients with lesions received a consensus diagnosis (8 SCA and 3 MCA) based on the results of >3 imaging methods (CE-CT, CE-MRI, EUS, and CEUS); among the remaining 7 patients with lesions diagnosed as cystic adenomas, cyst fluid analysis demonstrated that 5 lesions had a very low CEA level (0.2, 0.2, 0.3, 0.4, and 1.6 ng/mL) and these patients were diagnosed as having SCA. Three lesions had the “string sign” and a high CEA level (535, 722, and 900 ng/mL) and were diagnosed as MCA.24 In all, there was a total of 35 patients with SCA and 26 patients with MCA.
CEUS examination
Patients fasted for at least 8 h before the examination. The ultrasound instrument used was Sequoia 512 (Siemens Ultrasound, Mountain View, CA, USA) equipped with a 1–4 MHz 4 V1 vector transducer, in which a contrast pulse sequence software program was installed, and the mechanical index was <0.12. The pancreatic lesion was first scanned by conventional US with an optimized instrument setting; if the lesion was determined to be obscure, the patient was told to drink 800–1,000 mL of water and then the CEUS examination was performed using SonoVue (Bracco, Milan, Italy), a sulfur hexafluoride contrast agent. A bolus of 2.4 mL of contrast agent (5 mg/mL) was injected via a 20 gauge cannula into the antecubital vein, followed by a flush of 5 mL of physiologic saline solution. A second dose of contrast agent was needed when the lesion was too small or when a suspicious septum or nodules were present. After the examination of the pancreatic lesion for 2 min, the entire liver was thoroughly checked. All of the CEUS examinations were performed by two ultrasound physicians with >20 years (Prof XY) and >10 years (Dr FL) of experience with CEUS diagnoses, who were blinded to CT and MRI results and aware of our study design.
Imaging analysis
All of the CEUS characteristics of the CPNs were recorded: size (the longest axis); location (head–neck or body–tail); echogenicity (anechoic and mix-echoic); shape (round/oval, lobulated, and irregular); characteristics of the wall (thickness and enhancement pattern of the wall), the largest thickness of the wall was considered thin if it was <3 mm thick and thick if it was 3 mm or thicker, and subjective visual criteria were used to judge if there was wall enhancement during the phase; characteristics of septa (thickness and the number of septa), and the cut-off value of the largest thickness was 2 mm; honeycomb pattern (positive/negative); and nodule (positive/negative). All of the data were recorded immediately after the examination.
Statistical analysis
Differences in numbers between the two diseases were compared by using the Fisher’s exact test or chi-square test. The relative sensitivity, specificity, and area under the receiver operating characteristic curves (Az) of the CEUS criteria were calculated to compare the diagnostic performance of the techniques. A two-tailed P-value of <0.05 was considered to indicate a significant difference. All of the data were analyzed by using the Statistical Package for the Social Sciences 17.0 software package (SPSS, Chicago, IL, USA).
Results
Patient information
The clinical characteristics of the 61 patients enrolled in this study are summarized in Table 1. A total of 27/35 patients with SCAs were female with an age of 47.89±15.58 (range: 16–76) years; four lesions were detected because of abdominal pain, two were detected due to abdominal distension, and 29 patients had no symptoms. A total of 21/26 patients with MCAs were female with an age of 45.46±13.18 (range: 19–67) years; six lesions were discovered because of abdominal pain, three were detected due to abdominal distension, one of the patients had nausea, and 16 had no symptoms. There were no significant differences in gender, age, or symptoms between the two groups. However, a difference in the “positive/negative symptom” parameter approached statistical significance (P=0.061).
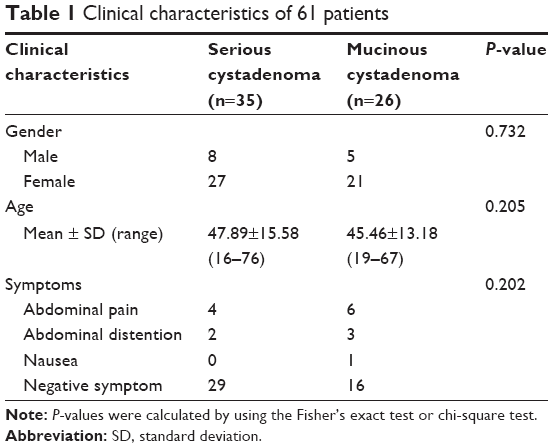 | Table 1 Clinical characteristics of 61 patients |
Imaging characteristics
The comparisons of the image characteristics between SCAs and MCAs observed with CEUS are listed in Table 2.
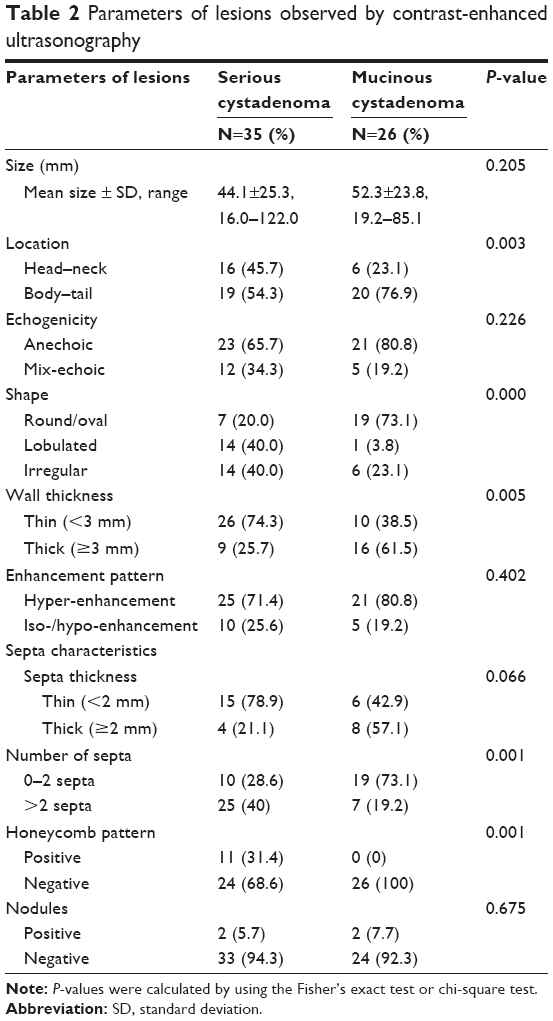 | Table 2 Parameters of lesions observed by contrast-enhanced ultrasonography |
SCAs (n=35) exhibited the widest range in size (16–122 mm) with a mean size of 44.1 mm. The cysts were detected in a head–neck location in 16/35 patients with SCA (Figure 1), and in a body–tail location in 19/35 patients with SCA (Figure 2). A total of 23/35 of SCAs were anechoic, and 12/35 were mix-echoic (Figures 1 and 2). A round/oval shape was evident in 7/35 of the cases, a lobulated shape was detected in 14/35 patients (Figure 2), and an irregular shape was apparent in 14/35 patients (Figure 1). Thin walls were detected in 26/35 of SCAs (Figures 1 and 2) and thick walls (Figure 1) were detected in 9/35 cases. A hyper-enhancement pattern of the wall was discovered in 25/35 SCAs (Figures 1 and 2), whereas an iso-/hypo-enhancement pattern of the wall was present in 10/35 cases (Figure 1). Concerning the characteristics of septa, thin septa were found in 15/35 of the SCAs (Figure 1) and thick septa were present in 4/35 of cases (Figures 1 and 2). Zero to two septa were present in 10/35 cases (Figure 1), and >2 septa were detected in 25/35 cases (Figures 1 and 2). There were 11/35 cases that displayed the classical honeycomb pattern (Figure 1). Two of 35 cases of SCAs exhibited nodules.
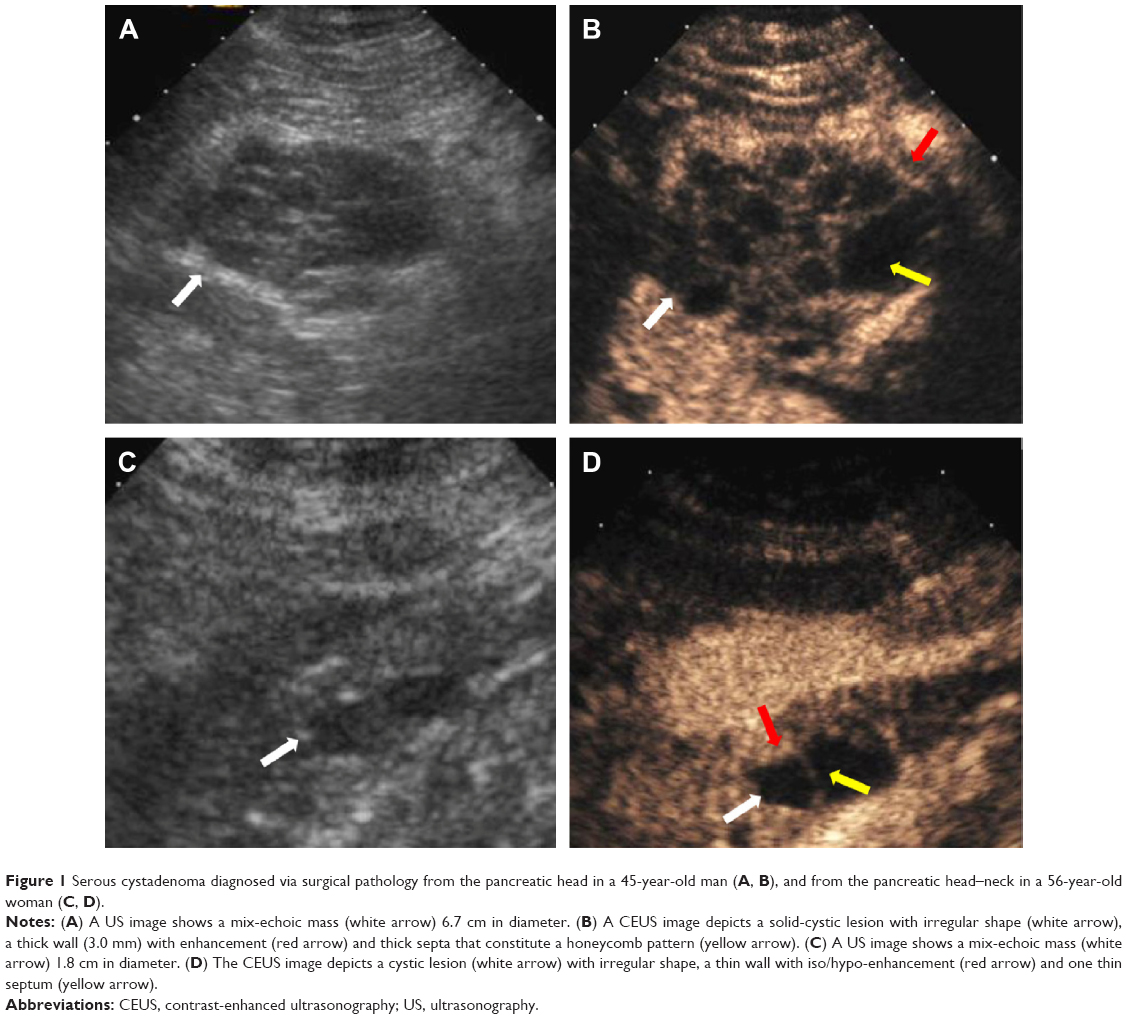 | Figure 1 Serous cystadenoma diagnosed via surgical pathology from the pancreatic head in a 45-year-old man (A, B), and from the pancreatic head–neck in a 56-year-old woman (C, D). |
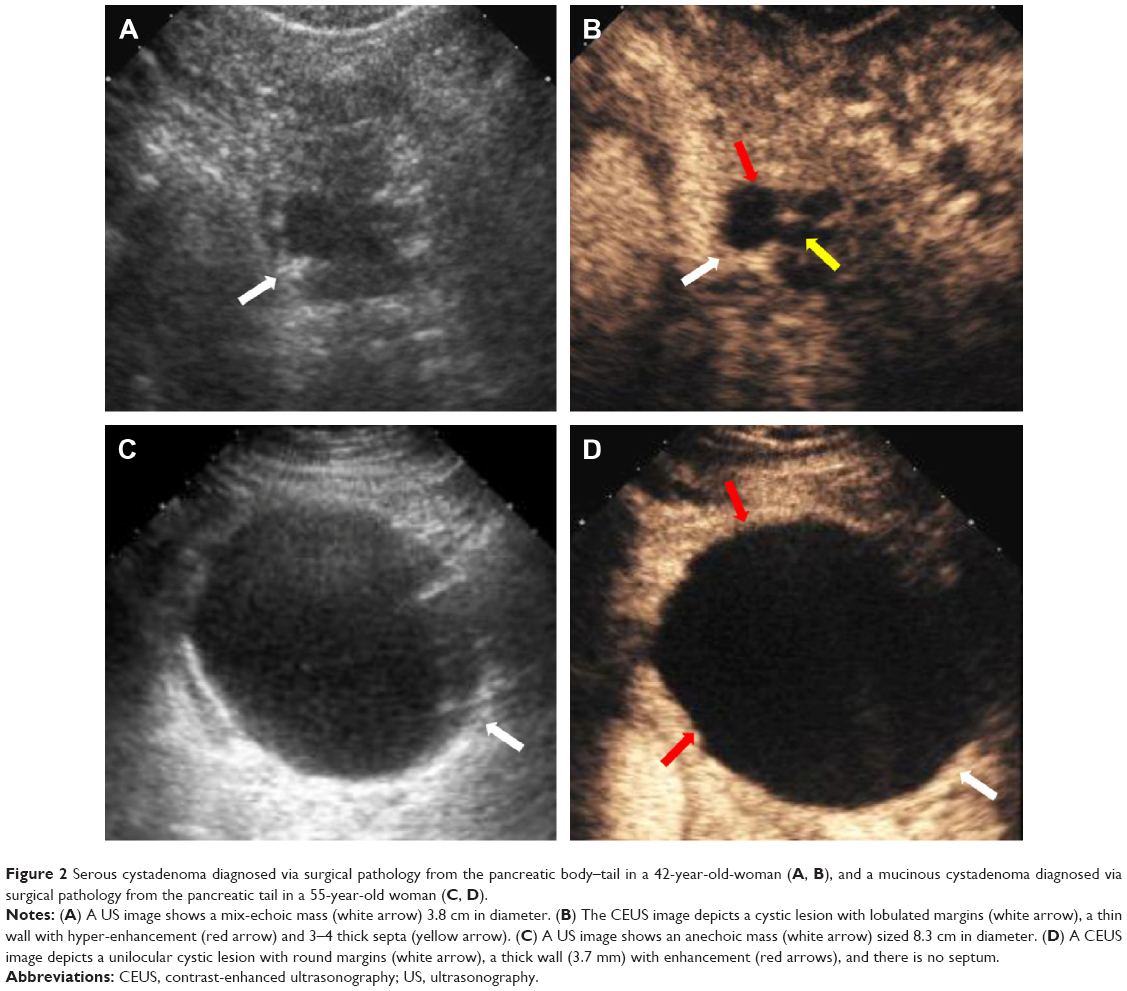 | Figure 2 Serous cystadenoma diagnosed via surgical pathology from the pancreatic body–tail in a 42-year-old-woman (A, B), and a mucinous cystadenoma diagnosed via surgical pathology from the pancreatic tail in a 55-year-old woman (C, D). |
MCAs (n=26) ranged in size from 19.2 to 85.1 mm with a mean size of 52.3 mm. The cyst was located in the head–neck region in 6/26 patients, and in the body–tail region in 20/26 patients (Figures 2 and 3). A total of 21/26 MCAs were anechoic (Figures 2 and 3), 5/26 were mix-echoic. A round/oval shape was found in 19/26 of the cases (Figure 2), a lobulated shape was apparent in 1/26 patients and an irregular shape was found in 6/26 patients (Figure 3). Thin walls were detected in 10/26 of MCAs and thick walls were apparent in 16/26 cases (Figures 2 and 3). A hyper-enhancement pattern of the wall was discovered in 21/26 MCAs (Figures 2 and 3), and an iso-/hypo-enhancement pattern of the wall was evident in 5/26 cases. Regarding the septa, thin septa were present in 6/14 cases (Figure 3), and thick septa were present in 8/14; 0–2 septa occurred in 19/26 patients (Figure 3), and >2 septa were detected in 7/26 cases. Nodules were displayed in 2/26 MCAs (Figure 3).
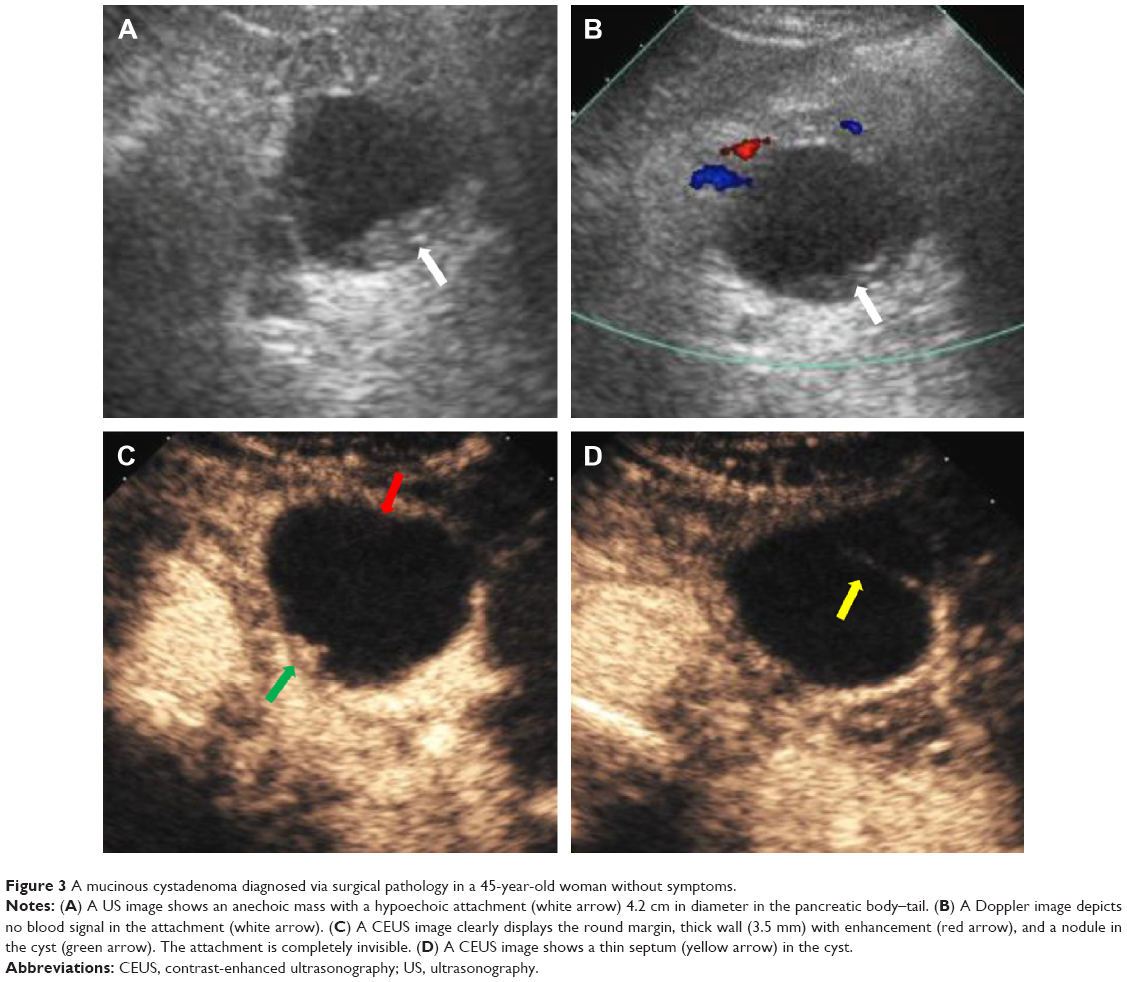 | Figure 3 A mucinous cystadenoma diagnosed via surgical pathology in a 45-year-old woman without symptoms. |
There was a statistically significant difference in the following criteria between these two diseases: location (P=0.003), shape (P=0.000), thickness of the wall (P=0.005), number of septa (P=0.001), and honeycomb pattern (P=0.001). The differences in the other features did not reach statistical significance.
Findings combination
Table 3 summarizes the sensitivity, specificity, and Az values of the different criteria that were statistically significant in Table 2. Head/neck location, lobulated shape (P=0.003), honeycomb pattern, and thin wall (<3 mm) were findings that were independently specific for SCA. Among them, the lobulated shape and the honeycomb pattern had the highest specificities with 96.2% (25/26) and 100% (26/26), respectively, although the Az values were similar (0.613–0.679). When two of these four findings were combined, we could identify 25 SCAs and 21 MCAs with a sensitivity of 71.4% (25/35), a specificity of 80.8% (21/26), and an Az value of 0.76 for the diagnosis of SCA; when three of these four findings were combined, a specificity of 100% (26/26) was achieved and the Az value was 0.771. When four of the CEUS findings were combined, there was no diagnostic significance (Az =0.500; Figure 4). The body/tail location, round/oval shape (P=0.000), 0–2 septa, thick wall (≥3 mm) were findings independently specific for MCA. Body/tail location had the highest sensitivity of 76.9% (20/26), and the round/oval shape had the highest specificity of 80% (28/35) with an Az value of 0.765. When two of these four findings were combined, we could identify 12 SCAs and 23 MCAs with a sensitivity of 88.5% (23/26), a specificity of 65.7% (23/35), and an Az value of 0.771 to diagnose MCA. When three of these four findings were combined, the Az value was highest at 0.832, with a sensitivity of 80.8% (21/26) and a specificity of 85.7% (30/35); when 4 of the CEUS findings were combined, a specificity of 97.1% (34/35) was achieved and the Az value was 0.771 (Figure 5).
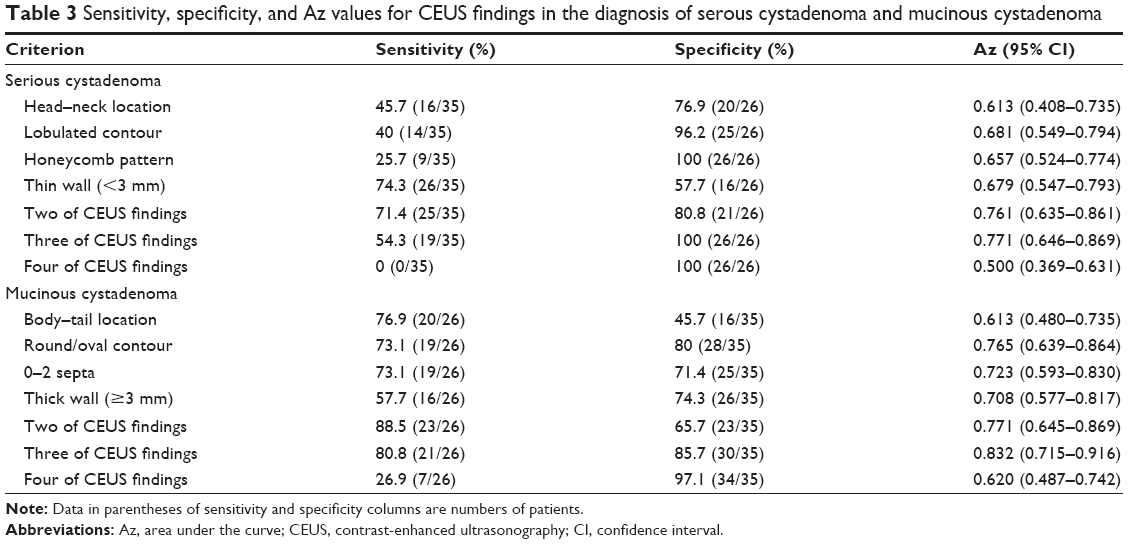 | Table 3 Sensitivity, specificity, and Az values for CEUS findings in the diagnosis of serous cystadenoma and mucinous cystadenoma |
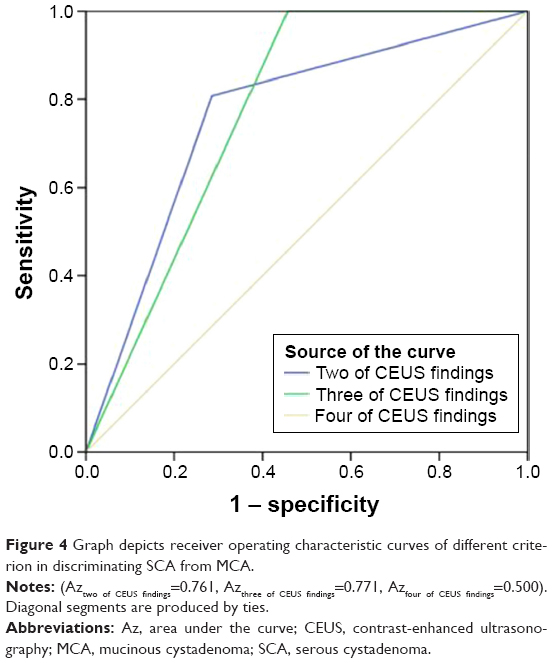 | Figure 4 Graph depicts receiver operating characteristic curves of different criterion in discriminating SCA from MCA. |
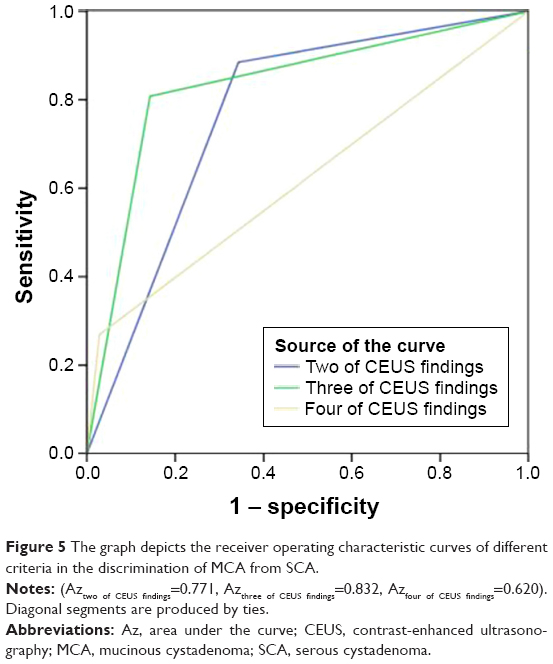 | Figure 5 The graph depicts the receiver operating characteristic curves of different criteria in the discrimination of MCA from SCA. |
Discussion
Although they are the most common types of CPLs, SCAs, and MCAs exhibit distinctly different biological behaviors. SCAs are benign cystic tumors composed of cuboidal epithelium that produce serous fluid and require clinical follow-up, whereas MCAs are composed of columnar mucin-producing epithelium and require surgical resection due to the potential for malignancy.1,5 Once a CPL has been detected, an immediate and correct diagnosis is necessary to guide appropriate management.
Authors have reported that although the clinical, radiologic, and pathologic features of CPLs are well known, an accurate preoperative diagnosis remains difficult.25,26 CEUS can provide dynamic information concerning circulation in focal lesions and in normal parenchyma during a real-time examination. Although the applications of this technique in the pancreas are relatively new compared with the liver, a large number of papers about the usefulness of CEUS in the pancreas, including in the diagnosis of pancreatic cystic lesions, has been published. CEUS is generally acknowledged to be able to detect the inner structure of the CPLs, such as septa, nodules, and clearer wall characteristics.14,15,18,27 Many studies have demonstrated the superior performance of CEUS over conventional US for the diagnosis of CPLs,21 the usefulness of qualitative and quantitative CEUS analysis,19 the substantial agreement with CECT,20,23 the value in characterizing different pancreatic pathologies and the agreement with MRI images.22,28 Nevertheless, no study has discussed the detailed features of these two diseases and whether the features or their combinations were of any value in the discrimination of SCAs and MCAs using CEUS.
In our study, the population of patients with SCA and MCA were primarily women of middle age, and positive symptoms occurred in 17.1% (6/35) of patients with SCAs, and in 38.5% (10/26) of patients with MCAs, in accordance with a previous report.4
There were several CEUS imaging criteria that were significantly different between SCAs and MCAs that could be helpful in the diagnosis procedure: location, shape, the thickness of the wall (the cut-off value of the thickness was 3 mm), the number of the septa, and the presence of a honeycomb pattern.
In our study, most of the MCAs were body–tail cases, which was different from SCAs. The lobulated shape had a high specificity of 96.2%, and it had the same diagnostic value as the honeycomb pattern, which accounted for 31.4% of cases of SCA, higher than the 20% reported in the literature.3 Regarding septa, the 0–2 septa pattern, also called an “oligo-cystic pattern” was found in 28.6% of SCAs and in 73.1% of MCAs, which led to great difficulty in differentiating between oligocystic SCA and MCA.1,15–17 The median wall of SCAs in this study was thinner compared to MCAs, as reported in other studies,17 and the cut-off value in this study was 3 mm. The following criteria were not statistically significantly different between SCAs and MCAs: size, echogenicity, enhancement pattern of the wall, nodules, and thickness of the septum (the cut-off value of the thickness was 2 mm). The different echogenicity characteristics are influenced by septa, a hemorrhage, mucin, and sometimes, when chambers are extremely small, the tumor may appear solid.21 The enhancement pattern of the wall assessed by objective judgment cannot be a useful criterion because a large number of the walls were hyper enhanced and sometimes the enhancement pattern was difficult to discern in thin walls. In this study, nodules were not significant features, as all of the cases were benign and the thickened septa may be visualized as an inconspicuous nodule, and vice versa.29 Regarding the septa thickness, studies indicate that the thickness of the septa in SCAs is thinner than in MCAs,15 but no significant difference has been detected in septa thickness regardless of the use of a 2 mm thickness or any other thickness as the criterion. In our research, what is different from previous studies is that we evaluated various combinations of CEUS criterion that could contribute to the improvement of the diagnostic discrimination of these two diseases.
In previous reports,1,30,31 calcification was considered to occur more frequent in SCAs, however, in our study, calcification was only found in two SCAs and in one MCA, which might be due to our small population. In addition, one SCA and one MCA with a mild dilation of the pancreatic duct, and no cystadenomas that communicated with the pancreatic duct were detected in CEUS images.
In clinical practice, it is of vital importance to differentiate SCAs and MCAs from other common cystic lesions, especially pseudocysts (PPSs) and IPMNs. As the most common type of CPL, PPs mostly form after inflammation, necrosis or hemorrhage related to pancreatitis or trauma and are enclosed by a wall with fibrous tissue absent in the epithelial cell lining. Unenhanced US usually shows a PPS as a round or oval anechoic lesion together with the features of acute and/or chronic pancreatitis.30 On a CEUS image, the intralesional debris and blood clots seen in a conventional US are completely invisible.15,28 Unfortunately, an overlap exists between the imaging features of CPNs and PPSs.3,5 IPMNs, a research focus in recent years, can be divided into adenomas, borderline tumors, and intraductal carcinomas.5 IPMNs can be classified as a main pancreatic duct type IPMN or a branch pancreatic duct type (BD-IPMN) with CEUS, and the diffuse pattern of pancreatic ductal dilatation or the segmental cystic appearance, especially the vegetations, can be more visible.3,31 IPMNs and PPSs occur more frequently in men than in women and occur more frequently in individuals with a history of pancreatitis.
The prospective design is one advantage of our research. US is different from other cross-sectional imaging modalities; the imaging quality and quantity of US depends entirely on the operators. Therefore, a prospective study performed according to a set process influences the validity of the research.
Limitations
Several limitations should be emphasized. First, this study would have been more dependable if we had changed the subjective visual assessment of wall enhancement to an objective region-of-interest technique, which we will do in our next study. Second, 18 lesions in our study were not surgically resected but were diagnosed by comprehensive analysis, a combination of imaging diagnosis and cytologic findings. Among them, MCA sometimes was difficult to be differentiated from BD-IPMN, which also has a high CEA level in the fluid, and appears with a single cyst of the side branch, which is usually not easy to detect the communication with the branch duct. Third, the number of enrolled patients was small, and an additional study in a larger population with CEUS is warranted.
Conclusion
On the basis of the results of this study, a head–neck location, a lobulated shape, a honeycomb pattern, and a thin wall (<3 mm thick) are significant features that can be used to diagnose SCAs. A body/tail location, a round/oval shape, the presence of 0–2 septa, and a thick wall (≥3 mm) are most often detected in patients with MCAs. The discovery of a combination of CEUS findings can assist practitioners in the discrimination of SCAs from MCAs.
Acknowledgment
This work was supported by Chinese National Nature Science Foundations (81471683 and 81671710).
Disclosure
The authors report no conflicts of interest in this work.
References
Megibow AJ, Baker ME, Gore RM, Taylor A. The incidental pancreatic cyst. Radiol Clin North Am. 2011;49(2):349–359. | ||
Kimura W, Nagai H, Kuroda A, Muto T, Esaki Y. Analysis of small cystic lesions of the pancreas. Int J Pancreatol. 1995;18(3):197–206. | ||
Khan A, Khosa F, Eisenberg RL. Cystic lesions of the pancreas. AJR. 2011;196(6):W668–W677. | ||
Scheiman JM, Hwang JH, Moayyedi P. American gastroenterological association technical review on the diagnosis and management of asymptomatic neoplastic pancreatic cysts. Gastroenterology. 2015;148(4):824 e822e822–848e822. | ||
Kloppel G, Kosmahl M. Cystic lesions and neoplasms of the pancreas. The features are becoming clearer. Pancreatology. 2001;1(6):648–655. | ||
Basturk O, Coban I, Adsay NV. Pancreatic cysts: pathologic classification, differential diagnosis, and clinical implications. Arch Pathol Lab Med. 2009;133(3):423–438. | ||
Yoon WJ, Brugge WR. Pancreatic cystic neoplasms: diagnosis and management. Gastroenterol Clin North Am. 2012;41(1):103–118. | ||
Valsangkar NP, Morales-Oyarvide V, Thayer SP, et al. 851 resected cystic tumors of the pancreas: a 33-year experience at the Massachusetts General Hospital. Surgery. 2012;152(3 Suppl 1):S4–S12. | ||
Jais B, Rebours V, Malleo G, et al. Serous cystic neoplasm of the pancreas: a multinational study of 2622 patients under the auspices of the International Association of Pancreatology and European Pancreatic Club (European study group on cystic tumors of the pancreas). Gut. 2016;65(2):305–312. | ||
Khashab MA, Shin EJ, Amateau S, et al. Tumor size and location correlate with behavior of pancreatic serous cystic neoplasms. Am J Gastroenterol. 2011;106(8):1521–1526. | ||
Ketwaroo GA, Mortele KJ, Sawhney MS. Pancreatic cystic neoplasms: an update. Gastroenterol Clin North Am. 2016;45(1):67–81. | ||
Gandolfi L, Torresan F, Solmi L, Puccetti A. The role of ultrasound in biliary and pancreatic diseases. Eur J Ultrasound. 2003;16(3):141–159. | ||
Recaldini C, Carrafiello G, Bertolotti E, Angeretti MG, Fugazzola C. Contrast-enhanced ultrasonograpic findings in pancreatic tumors. Int J Med Sci. 2008;5(4):203–208. | ||
D’Onofrio M, Barbi E, Dietrich CF, et al. Pancreatic multicenter ultrasound study (PAMUS). Eur J Radiol. 2012;81(4):630–638. | ||
D’Onofrio M, Zamboni G, Faccioli N, Capelli P, Pozzi Mucelli R. Ultrasonography of the pancreas. 4. Contrast-enhanced imaging. Abdom Imaging. 2007;32(2):171–181. | ||
Kim SY, Lee JM, Kim SH, et al. Macrocystic neoplasms of the pancreas: CT differentiation of serous oligocystic adenoma from mucinous cystadenoma and intraductal papillary mucinous tumor. AJR Am J Roentgenol. 2006;187(5):1192–1198. | ||
Goh BK, Tan YM, Yap WM, et al. Pancreatic serous oligocystic adenomas: clinicopathologic features and a comparison with serous microcystic adenomas and mucinous cystic neoplasms. World J Surg. 2006;30(8):1553–1559. | ||
Schraibman V, Goldman SM, Ardengh JC, et al. New trends in diffusion-weighted magnetic resonance imaging as a tool in differentiation of serous cystadenoma and mucinous cystic tumor: a prospective study. Pancreatology. 2011;11(1):43–51. | ||
Vasile TA, Socaciu M, Stan Iuga R, et al. Added value of intravenous contrast-enhanced ultrasound for characterization of cystic pancreatic masses: a prospective study on 37 patients. Med Ultrason. 2012;14(2):108–114. | ||
Vasile TA, Feier D, Socaciu M, et al. Contrast enhanced ultrasound and computer tomography diagnosis of solid and mixed pancreatic tumors – analysis of confounders. J Gastrointestin Liver Dis. 2012;21(3):285–292. | ||
Xu M, Xie XY, Liu GJ, et al. The application value of contrast-enhanced ultrasound in the differential diagnosis of pancreatic solid-cystic lesions. Eur J Radiol. 2012;81(7):1432–1437. | ||
Ardelean M, Sirli R, Sporea I, et al. Contrast enhanced ultrasound in the pathology of the pancreas – a monocentric experience. Med Ultrason. 2014;16(4):325–331. | ||
Fan Z, Yan K, Wang Y, et al. Application of contrast-enhanced ultrasound in cystic pancreatic lesions using a simplified classification diagnostic criterion. Biomed Res Int. 2015;2015:974621. | ||
Martin AK, Zhou Z. Endoscopic ultrasound-guided fine-needle aspiration for the diagnosis of pancreatic cysts by combined cytopathology and cystic content analysis. World J Gastrointest Endosc. 2015;7(15):1157–1169. | ||
Kim YH, Saini S, Sahani D, Hahn PF, Mueller PR, Auh YH. Imaging diagnosis of cystic pancreatic lesions: pseudocyst versus nonpseudocyst. Radiographics. 2005;25(3):671–685. | ||
Dewhurst CE, Mortele KJ. Cystic tumors of the pancreas: imaging and management. Radiol Clin North Am. 2012;50(3):467–486. | ||
Buscarini E, Pezzilli R, Cannizzaro R, et al. Italian Association of Hospital G, Endoscopists, Italian Association for the Study of the P. Italian consensus guidelines for the diagnostic work-up and follow-up of cystic pancreatic neoplasms. Dig Liver Dis. 2014;46(6):479–493. | ||
D’Onofrio M, Megibow AJ, Faccioli N, et al. Comparison of contrast-enhanced sonography and MRI in displaying anatomic features of cystic pancreatic masses. AJR Am J Roentgenol. 2007;189(6):1435–1442. | ||
Itoh T, Hirooka Y, Itoh A, et al. Usefulness of contrast-enhanced transabdominal ultrasonography in the diagnosis of intraductal papillary mucinous tumors of the pancreas. Am J Gastroenterol. 2005;100(1):144–152. | ||
Rickes S, Wermke W. Differentiation of cystic pancreatic neoplasms and pseudocysts by conventional and echo-enhanced ultrasound. J Gastroenterol Hepatol. 2004;19(7):761–766. | ||
Zamboni GA, Ambrosetti MC, D’Onofrio M, Pozzi Mucelli R. Ultrasonography of the pancreas. Radiol Clin North Am. 2012;50(3):395–406. |
 © 2017 The Author(s). This work is published and licensed by Dove Medical Press Limited. The full terms of this license are available at https://www.dovepress.com/terms.php and incorporate the Creative Commons Attribution - Non Commercial (unported, v3.0) License.
By accessing the work you hereby accept the Terms. Non-commercial uses of the work are permitted without any further permission from Dove Medical Press Limited, provided the work is properly attributed. For permission for commercial use of this work, please see paragraphs 4.2 and 5 of our Terms.
© 2017 The Author(s). This work is published and licensed by Dove Medical Press Limited. The full terms of this license are available at https://www.dovepress.com/terms.php and incorporate the Creative Commons Attribution - Non Commercial (unported, v3.0) License.
By accessing the work you hereby accept the Terms. Non-commercial uses of the work are permitted without any further permission from Dove Medical Press Limited, provided the work is properly attributed. For permission for commercial use of this work, please see paragraphs 4.2 and 5 of our Terms.