")
Back to Journals » Diabetes, Metabolic Syndrome and Obesity » Volume 13
Discrimination of Chronic Kidney Disease and Diabetic Nephropathy and Analysis of Their Related Influencing Factors
Authors Liu X, Guo Y, Wu J, Yao N, Wang H, Li B
Received 4 August 2020
Accepted for publication 25 November 2020
Published 30 December 2020 Volume 2020:13 Pages 5085—5096
DOI https://doi.org/10.2147/DMSO.S275398
Checked for plagiarism Yes
Review by Single anonymous peer review
Peer reviewer comments 2
Editor who approved publication: Prof. Dr. Antonio Brunetti
Xiumin Liu,1 Yinpei Guo,2 Jing Wu,1 Nan Yao,2 Han Wang,2 Bo Li2
1Department of Clinical Laboratory, The Second Affiliated Hospital of Jilin University, Changchun, People’s Republic of China; 2Department of Epidemiology and Biostatistics, School of Public Health, Jilin University, Changchun, People’s Republic of China
Correspondence: Bo Li
Department of Epidemiology and Biostatistics, School of Public Health, Jilin University, No. 1163 Xinmin Street, Chaoyang District, Changchun City, Jilin Province, People’s Republic of China
Tel/Fax +8643185619451
Email [email protected]
Purpose: Clinically there are not many clinical indicators to differentiate diabetic kidney disease (DKD) and chronic kidney disease (CKD). Data from laboratory inspections on admission of clinical patients were used to complete the relationship and discrimination analysis of the two diseases.
Patients and Methods: All subjects were taken from the Department of Nephrology of the Second Hospital of Jilin University from January 2019 to September 2020 with clinical diagnosis of CKD or diabetic nephropathy and no other diseases. After querying the hospital’s medical record system, the basic demographic information was obtained, and data on cardiovascular, metabolism, renal function, blood function, and other relevant indicators were extracted as well. IBM SPSS 24.0 software was used for data collation and analysis.
Results: A total of 1726 inpatients (986 males and 740 females) over 18 years old were included, 1407 were CKD patients, 319 were DKD patients. Female accounted for 55.4% in CKD patients, 64.6% in DKD patients. Compared to men, women may be more susceptible to DKD (OR=2.234). DKD patients were more likely to be have higher DP, GLU, eGFR, TCHO, and abnormal TVU (OR=1.746, 3.404, 1.107, 3.004, 14.03) while VB12 was the relative risk factor for CKD; thus, low VB12 level is more likely to happen in CKD patients (OR=0.054, OR95%CI: 0.005– 0.552, P=0.014) compared with DKD patients. The stepwise discriminant analysis was completed, only 11 of the 34 variables had discriminative significance. The discriminant score (DS) was set to explore its test efficiency of DKD prediction by drawing ROC curve. Discriminant formula used for CKD and DN identification was given in the study.
Conclusion: Female, higher DP, fasting blood GLU and TCHO level seemed to be more indicative for DKD, while lower eGFR level and VB12 deficiency were more likely to point to CKD. Doctors can refer to the discriminant formula to assist in the differential diagnosis of the two diseases after completing the detection of DP, fasting blood GLU, Cys-C, eGFR, TVU, TCHO, FA, VB12, CK, and CK–Mb.
Keywords: chronic kidney disease, diabetic kidney disease, multivariate logistic regression, ROC curve, discriminant analysis
Plain Language Summary
Clinically there are not enough specific indicators for differentiating diabetic kidney disease (DKD) and chronic kidney disease (CKD) except for blood-glucose-related indicators which can be auxiliary. The prevalence of DKD is increasing significantly, while many patients have already developed symptoms without reaching the traditional standard of more than 10 years of diabetic history. Therefore, our group used the various data of biochemical examination of inpatients from the Department of Nephrology of the Second Affiliated Hospital to make a differential analysis of the two diseases. We found that women are more likely to suffer from DKD, and DP, fasting blood GLU and TCHO seem to be the more indicative indicators for DKD compared to CKD, while worse performances of eGFR and VB12 levels are more likely to point to CKD. We also gave the specific discriminant of both CKD and DKD after stepwise discriminant analysis, including 11 indicators gender, DP, fasting blood GLU, Cys-C, eGFR, TVU, TCHO, FA, VB12, CK, and CK–Mb in it, which can help doctors to identify DKD and CKD more accurately.
Introduction
Nephropathy can damage human health to varying degrees due to changes in kidney function or organ function. According to the developing speed, nephropathy can be divided into chronic kidney disease (CKD) and acute kidney disease. As one of the most common diseases in CKD, diabetic kidney disease (DKD) has the characteristics of high incidence, long duration, hard to heal and easy to progress.
There are not many clinical indicators for differentially diagnosing DKD and CKD. Kidney biopsy, as the gold standard for DKD, however, cannot be carried out extensively for its invasive particularity. Thus, traditionally, doctors mostly focus on the patient’s diabetes history to assist diagnosis. Under these circumstances, only patients with a history of diabetes for more than 10 years would be considered having DKD. Besides, doctors could also refer to pathological manifestations or biochemical indicators such as whether there is diabetic retinopathy or abnormal changes in urine protein within the range of kidney disease to complete the diagnosis,1 but these all need certain conditions. Therefore, without a long history of diabetes, no characteristic pathological changes or obvious biochemical indicators to assist diagnosing, the identification ofr DKD is difficult and inefficient. Therefore, it is meaningful to use the various test indicators completed at the time of admission to effectively distinguish DKD patients from patients with different manifestations of CKD.
Homocysteine, Insulin and Folic Acid
Homocysteine (hcy) is an important intermediate produced during methionine and cysteine metabolism.2 The level of hcy in the blood is related to a variety of adverse reactions, which can affect the body's system and cells directly,3 especially damage blood vessels4,5 or cause metabolic diseases.6–9 For patients with kidney disease, the increase of hcy may affect the normal function of vascular endothelial cells and platelets, cause atherosclerosis and thrombosis.10–13 Recent research shows that severe insulin resistance can also lead to elevated homocysteine in the blood.14–16 Serum folic acid (FA) content is also closely related to blood homocysteine level essential for the conversion of homocysteine to methionine.17–19
Blood, Urine Routine and Renal Function Indicators
Abnormalities of white blood cells (WBC), red blood cells (RBC), and hemoglobin (Hb) in routine blood tests may be related to kidney functional damage,20 such as decreased hemoglobin may indicate renal anemia. The clinical significance of activated partial thromboplastin time (APTT) is to detect the lack of endogenous coagulation factors, reduced blood anticoagulant activity may be a red flag for kidney disease.21
The abnormal changes of urine protein, glucose in urine routine represent damage in kidney function, and the elevation of blood urea nitrogen (BUN) not only specifically represents the occurrence of kidney disease, but also may increase the risk of insulin resistance.22,23 However, in the early stages of renal impairment, BUN can be in the normal range. Clinically, the increase in serum creatinine (Scr) indicates damage to renal function as well.24 The level of cysteine protease inhibitor C (Cys-C) is determined by glomerular filtration, not affected by any external factors (gender, age, diet).25 Slightly elevated of Cys-C level may indicate renal insufficiency, but its low level can also happen in early kidney damage.26–28
Cardiovascular Related Indicators
Cardiovascular disease is the leading cause of death in CKD, patients with kidney disease should pay more attention to relevant indicators in long-term treatment and prognosis, such as serum triglycerides (TG), cholesterol (TCHO), low-density lipoprotein (LDL) and high-density lipoprotein (HDL).29,30
In this study, the above indicators were analyzed both among CKD and DKD patients from the department of nephrology in the Second Affiliated Hospital of Jilin University to finish the description of the basic situation, ROC curve for exploring the test efficiency of each factor and discriminant formula writing.
Materials and Methods
Subjects and Data Source
The subjects of this study were taken from the department of nephrology, the Second Affiliated Hospital of Jilin University. All adult inpatients with a clinical diagnosis of CKD or DKD and no other diseases from January 2019 to June 2020 were included, and having received a kidney biopsy to confirm the disease was the inclusion criterion of our study. In particular, patients with specific complications of diabetic nephropathy were excluded, such as diabetic foot, diabetic eye diseases, and other diseases that can be diagnosed intuitively. After excluding subjects with missing information or pregnancy state, 1726 inpatients (986 males and 740 females) over 18 years old were included, among them, 1407 inpatients were CKD patients, 319 inpatients were DKD patients.
A total of 34 indicators were included—demographic information was obtained from the hospital’s medical record system. Data of cardiocerebral blood vessels, metabolism, renal function, blood function indicators was extracted based on blood, urine samples, and other clinical examinations at the time of admission to the hospital. The measurement was completed by the Laboratory of the Second Affiliated Hospital of Jilin University, and no subsequent collection and supplementation were performed.
Specific Indicators
The assignment of gender is 1 for male and 2 for female. BMI <18.5 kg/m2 means wasting; BMI between 18.5 and 24.9 kg/m2 means normal; BMI ≥25kg/m2 means overweight; BM1 >30.0 means obesity. Systolic blood pressure (SP) between 90~139 mmHg, diastolic blood pressure (DP) between 60 and approximately 89 mmHg are normal. Normal hcy level is below 15 μmol/L. The normal range of fasting blood glucose (GLU) is 3.89 to approximately 6.1 mmol/L, and 4–6% for glycated hemoglobin (GHb). The normal range of Hb for males is 120–160 g/L, and for females is 110–150 g/L. The RBC normal reference range is 4.5–5.5×10¹²/L for males, 4.0–5.0×10¹²/L for females. The normal range of WBC is 4.0–10.0×10⁹/L. The normal platelet count (PLT) for adult ranges from 100–300×109/L. The normal range of adult prothrombin time (PT) is 11.0–13.0 seconds, while exceeding the upper limit of normal for three seconds is abnormal. The normal APTT range is 25.1–35.0 seconds, exceeding the upper limit of the normal reference value for more than 10 seconds has clinical significance. Urine routine tests includes urine protein (urine PRO) and urine glucose (urine GLU) should both be negative under normal circumstances. Renal function related indicators: normal range for BUN is 8–21 mg/dL, for Scr is 44~133 μmol/L, and for Cys-C is 0.54–1.25. The normal value of eGFR is 80–120 mL/min. UACR should be <30 mg/g under normal circumstances. TVU should be between 1000 and 2000 mL. The normal range for TG is 0.56–1.71 mmol/L. TCHO should be less than 5.2 mmol/L. LDL should be lower than 3.12 mmol/L, HDL has the normal range 0.7–2.0 mmol/L. FA is 4.5–34.0 nmol/L in normal status. Serum vitamin B12 (VB12) should be above 150.0 ng/dl. Cardiovascular related indicators: the normal range of serum creatine kinase (CK) is 30–135 U/L, and hybrid creatine kinase isoenzymes (CK–MB) should be lower than 16 U/L. The quantification of troponin I (TnI) should be lower than 0.012 ng/mL. The normal range of myoglobin (Mb) is 19–92 μg/L for men and 12–76 μg/L for women. B-natriuretic peptide (BNP) should be 0–300 pg/mL.
Statistical Analysis
IBM SPSS 24.0 was used for data analysis. X ±SD or M (P25, P75) was used for the description of continuous variable, and t-test or Wilcoxon's rank sum test was used for difference analysis. Chi-squared test was used to analyze the difference distribution of categorical variables. The logistic regression model was used to analyzethe relationship between factors and dependent variable. Stepwise discriminant analysis was used to find the appropriate variables to write the discriminant formula of the two diseases on basis of Wilks’ lambda statistic. In general, the F value was set at Fentry=3.84 and Fremoval=2.71. Then, the ROC curve analysis was used for testing efficiency of the formula and significant variables after stepwise discriminant analysis, α=0.05.
Results
Basic Information
As it shown in Table 1, according to the clinical diagnosis stage, among the 1407 CKD patients, there were 3, 7, 21, 45 and 1331 patients from stage 1 to stage 5. There was no significant difference in the average age of patients with DKD and CKD. In CKD patients, the proportion of females was 55.4%, however, in DKD patients, females accounted for 64.6%, while the gender difference between the two groups was statistically significant (P<0.05). The comparison of BMI value and BMI distribution in two groups showed positive results— among CKD patients, the proportion of normal BMI is 54.4%, higher than that among DKD patients, 36.4% (P<0.05). Pathological indices hcy, PT, BUN, Scr, Cys-C, UACR, CK–MB, TnI, MB, BNP levels of CKD patients are higher that of DKD patients. While SP, DP, FBG, GHb, RBC, PLT, eGFR, TVU, TG, TCHO, LDL, HDL, FA, VB12, CK levels of CKD patients are lower than DKD patients (P<0.05). The comorbidities of the two groups are as follows: among them, SHPT represents secondary hyperparathyroidism and CC represents cardiovascular complications. The distribution difference showed not statistically significant between the two groups.
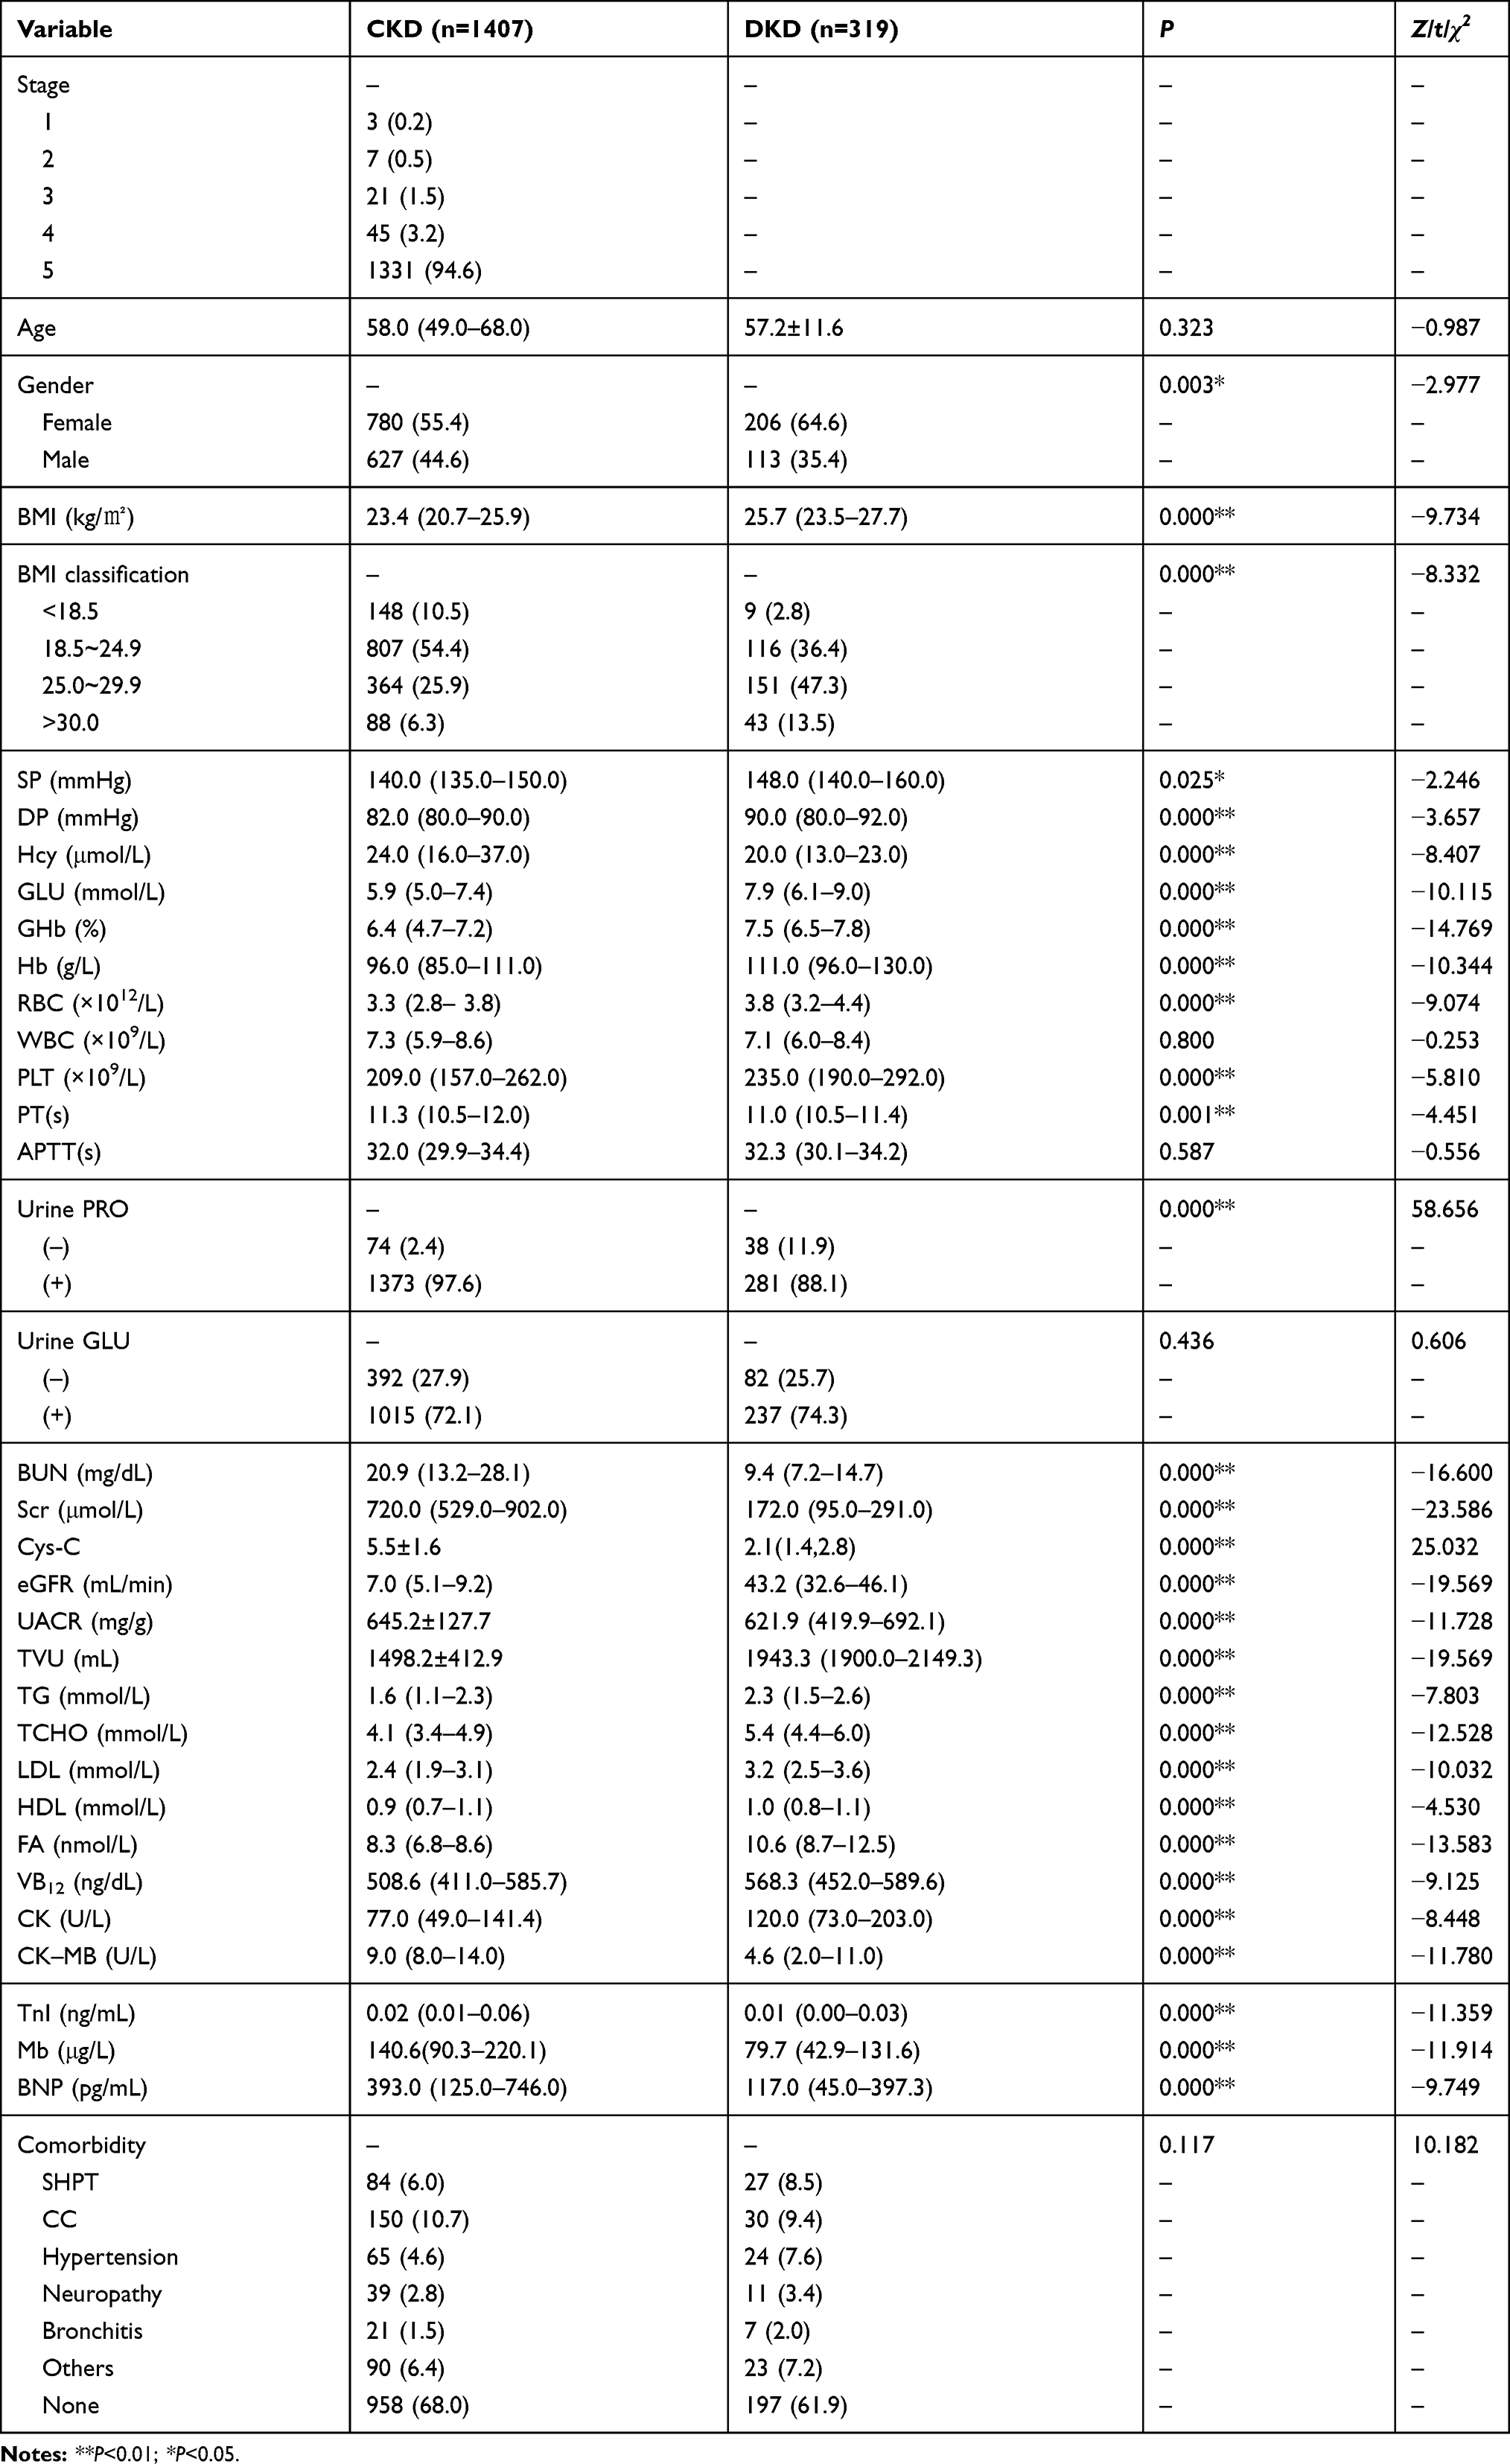 |
Table 1 Basic Situation of Research Subjects [X±SD/M (P25, P75)/n (%)] |
Multivariate Logistic Regression Results
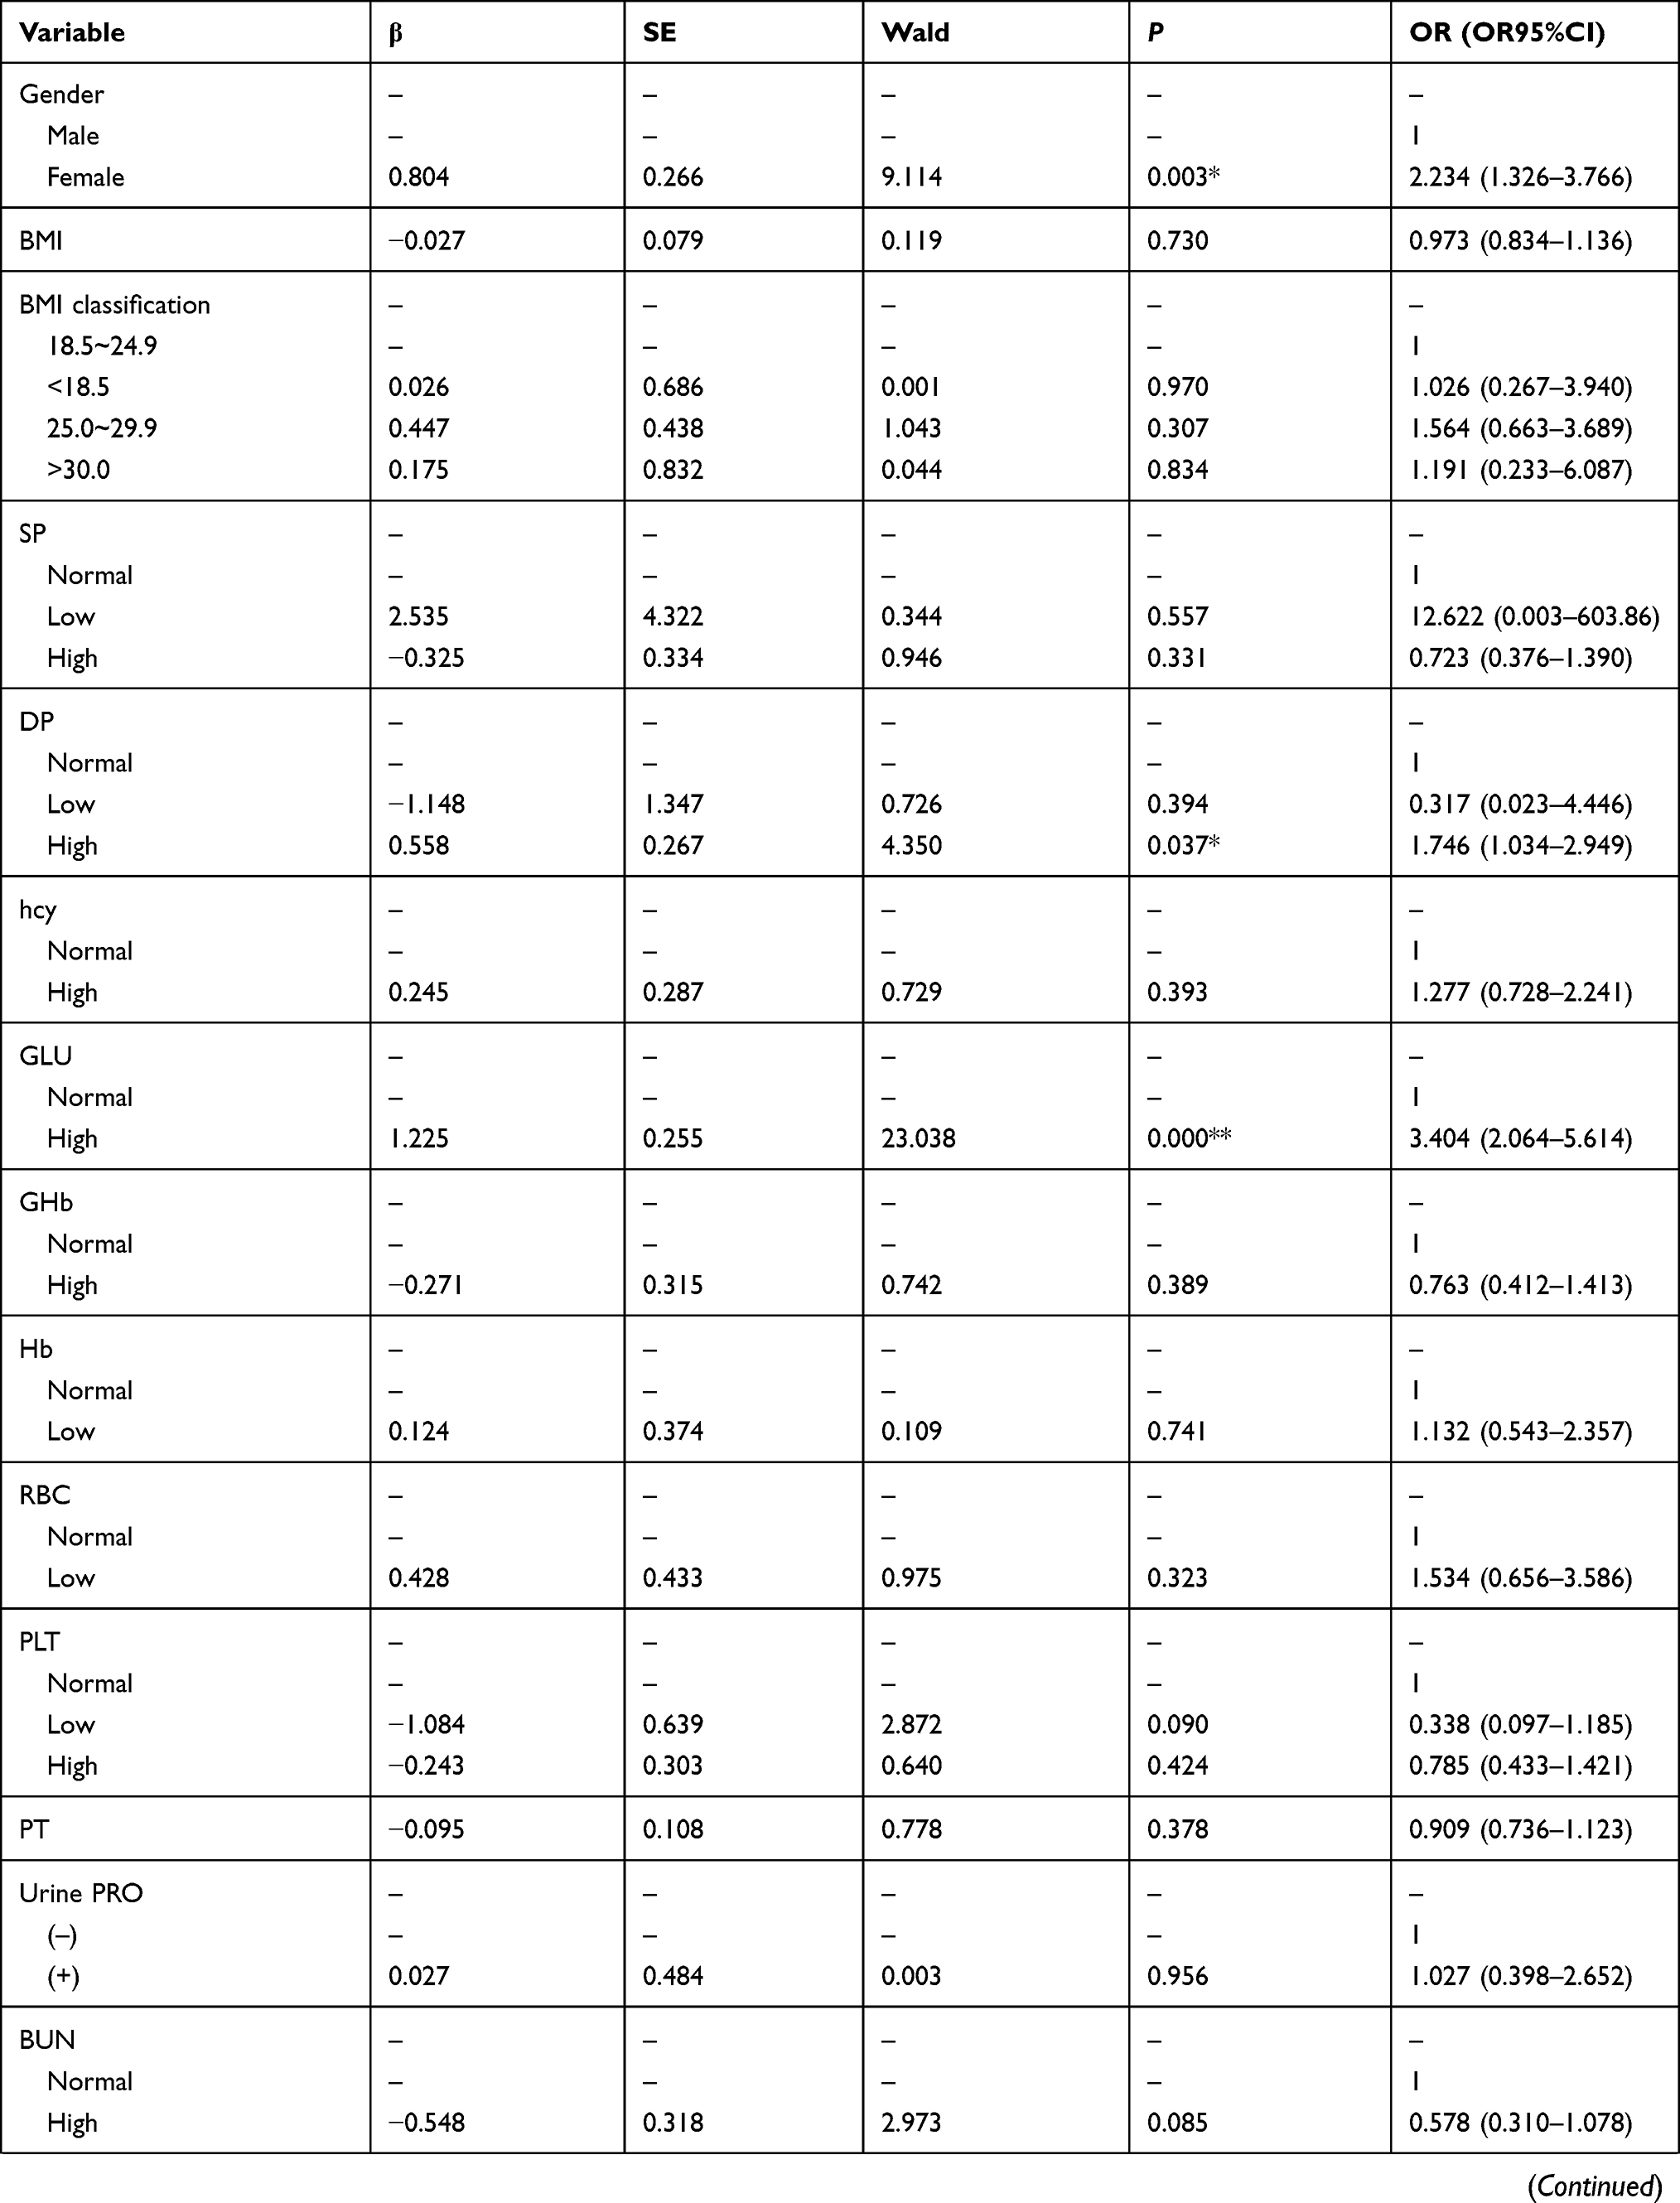
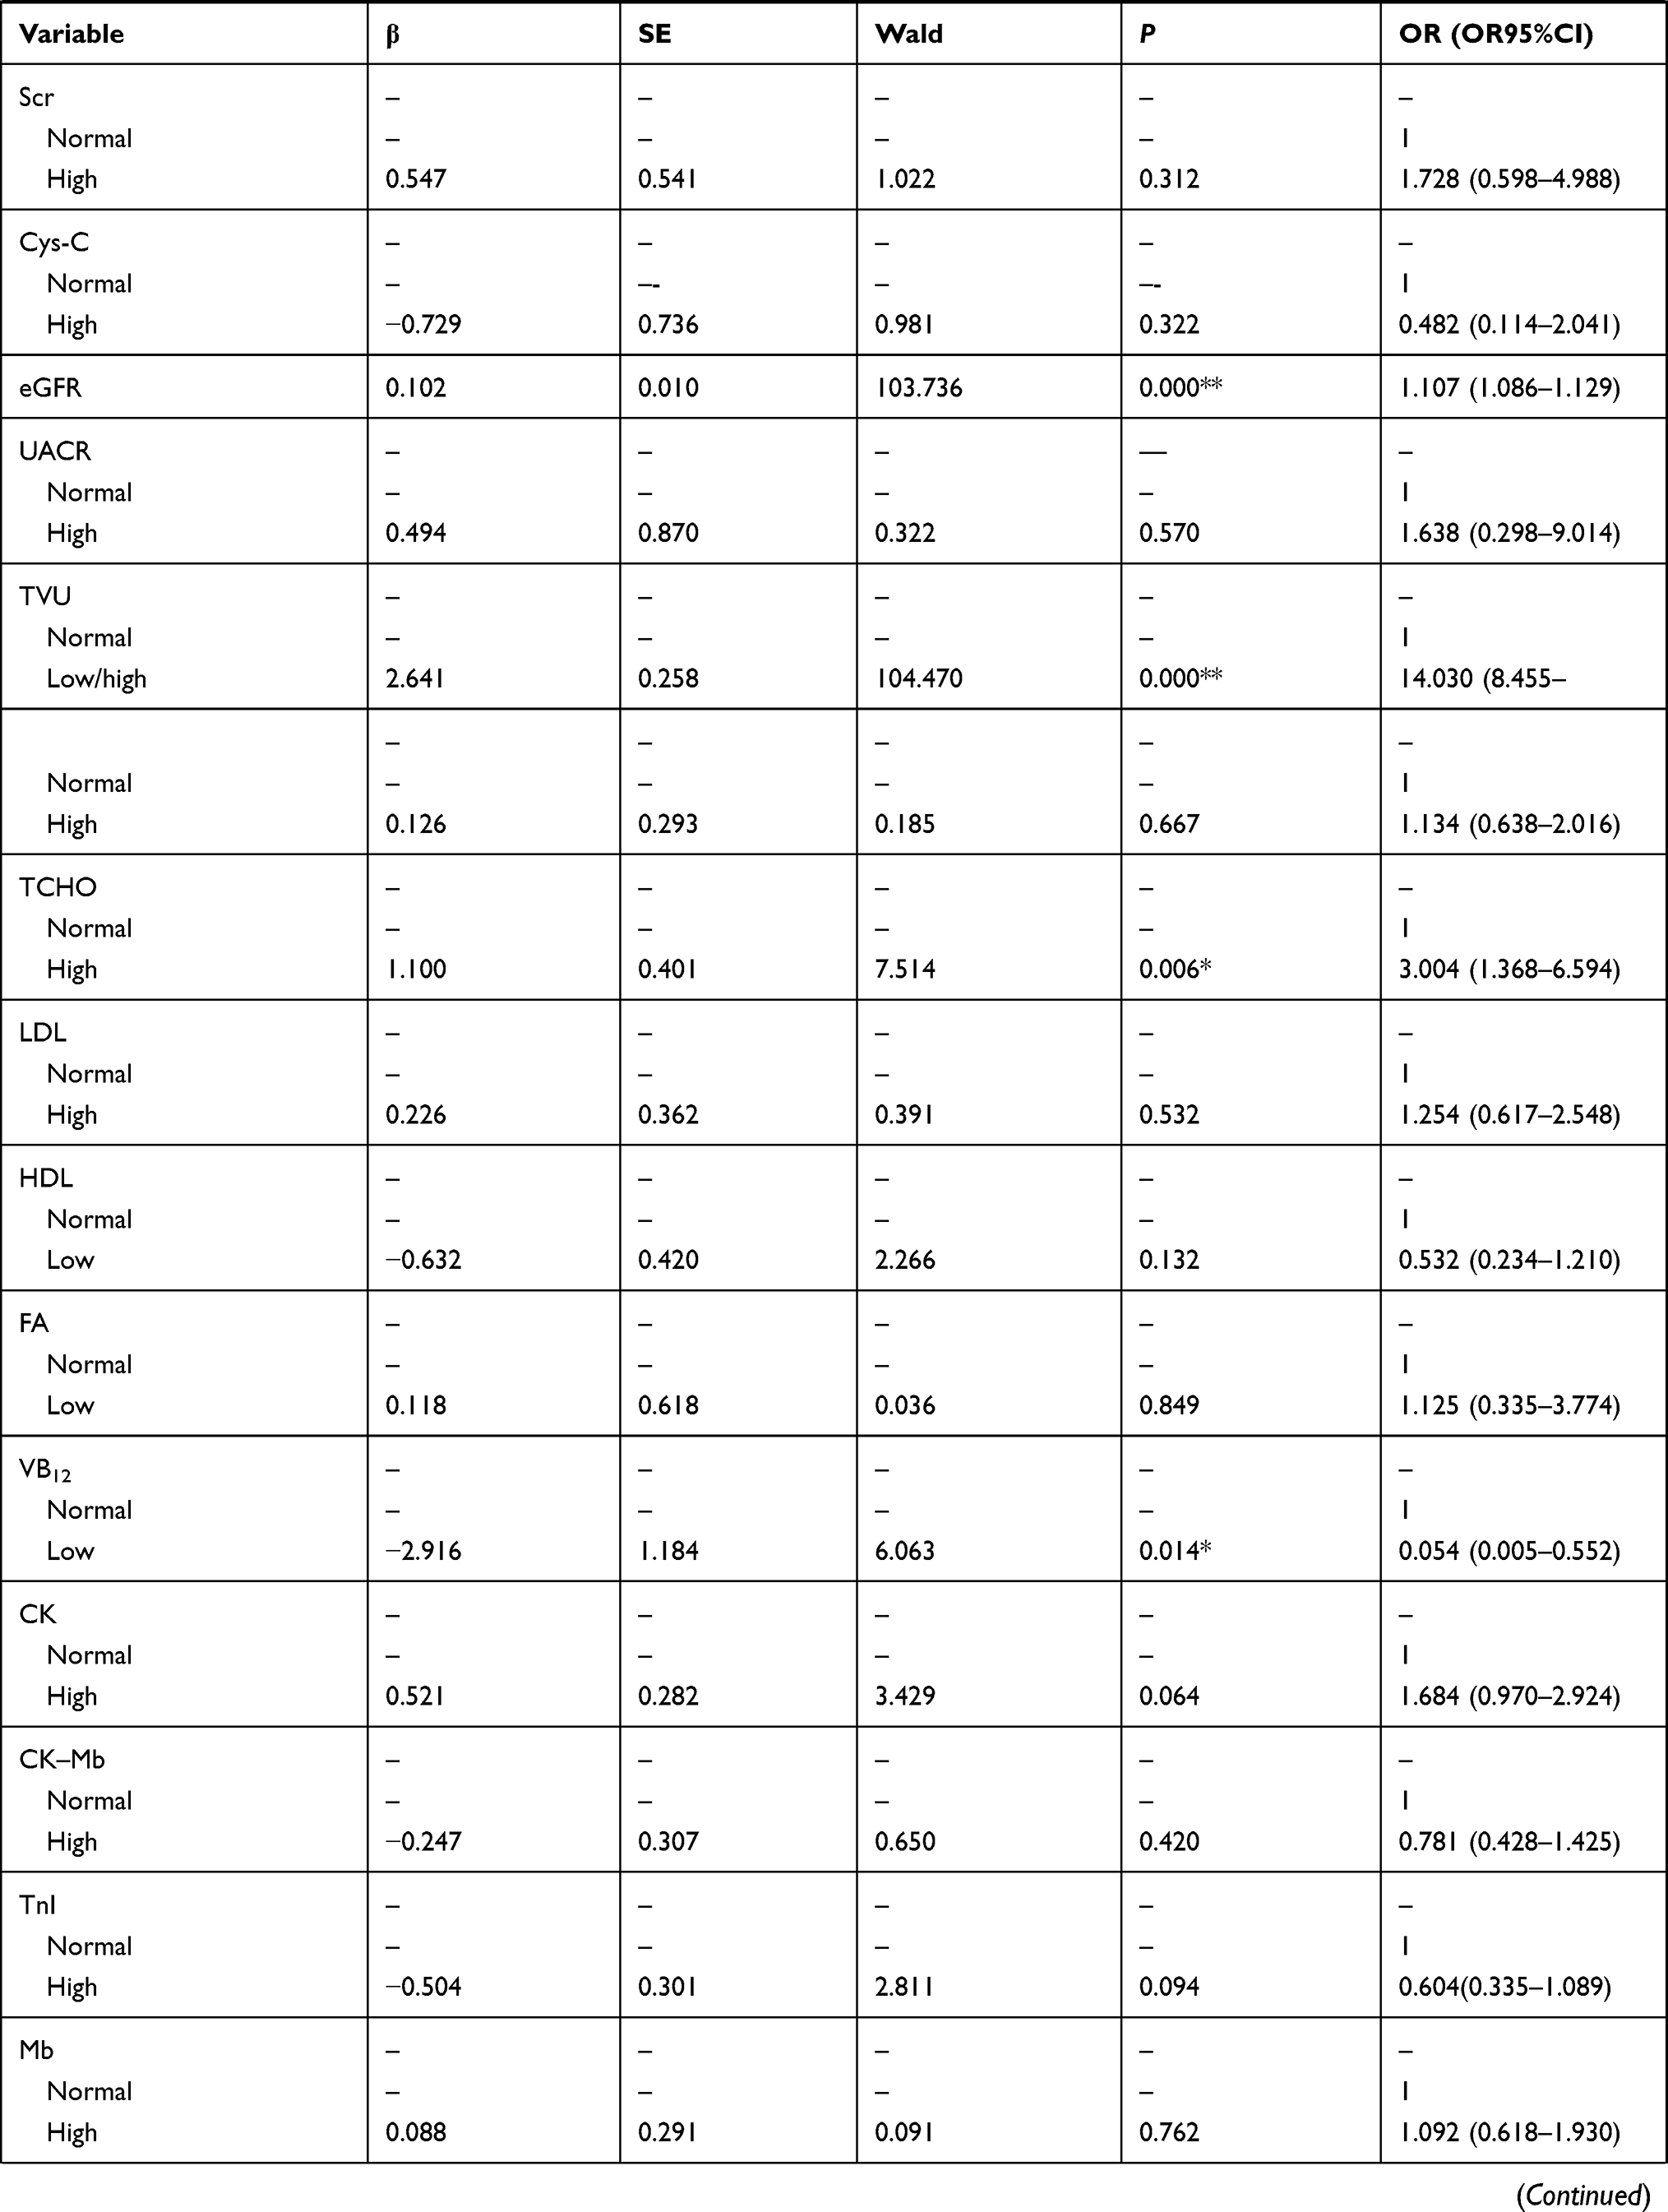
Taking the above variables which were statistically different into multivariate logistic regression model to explore the risk factors of DKD relative to CKD. The results are shown in Table 2.
 |
 |
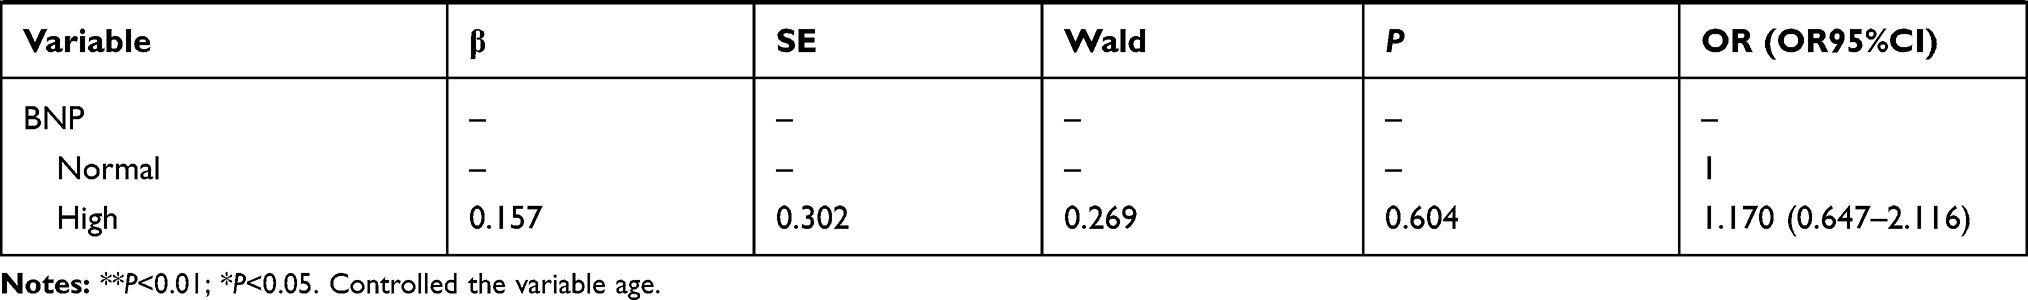 |
Table 2 Multivariate Logistic Regression Results of Factors for DKD |
Compared to men, women may be more susceptible to DKD (OR=2.234, OR95%CI: 1.326–3.776, P=0.003). DKD patients were more likely to have higher DP, GLU, eGFR, TCHO and abnormal TVU, they may be the risk factors for DKD (OR=1.746, 3.404, 1.107, 3.004, 14.03. OR95%CI: 1.034–2.949, 2.064–5.614, 1.086–1.129, 1.368–6.594, 8.455–23.282. P=0.037, 0.000, 0.000, 0.006, 0.000), while VB12 was the relative risk factor for CKD, thus, low VB12 level was more likely to happen in CKD patients (OR=0.054. OR95%CI: 0.005–0.552. P=0.014).
Discriminant for CKD and DKD
The stepwise discriminant analysis was completed using variables with significant difference between the two groups (Table 2). Based on the results, only 11 of the 34 variables had discriminative significance with the Wilks’ lambda=0.390, χ2=1616.494, df=11, and P<0.001. The discriminant score (DS) was set to be used as a new variable to explore its test efficiency of DKD prediction.
DS = Gender×0.240 + DP×0.006 + GLU×0.232 - Cys-C×0.208 + eGFR×0.050 + TVU×0.0003 + TCHO×0.139 + FA×0.065 + VB12×0.0004 + CK×0.00029 – CK–Mb×0.013–4.041.
According to the results of classification statistics, the success rate of discriminating the research object is as high as 94.1% (Table 3), so the discriminant model has high accuracy. Thus, the discriminant formula for CKD patients can be written as Y = Gender×7.4253 + DP×0.6730 + GLU×7.0761 + Cys-C×4.3697 + eGFR×0.2075 + TVU×0.0069 + TCHO×2.7027 + FA×1.0751 + VB12×0.0089 + CK×0.0005 +CK–Mb × 0.1020–89.0257.
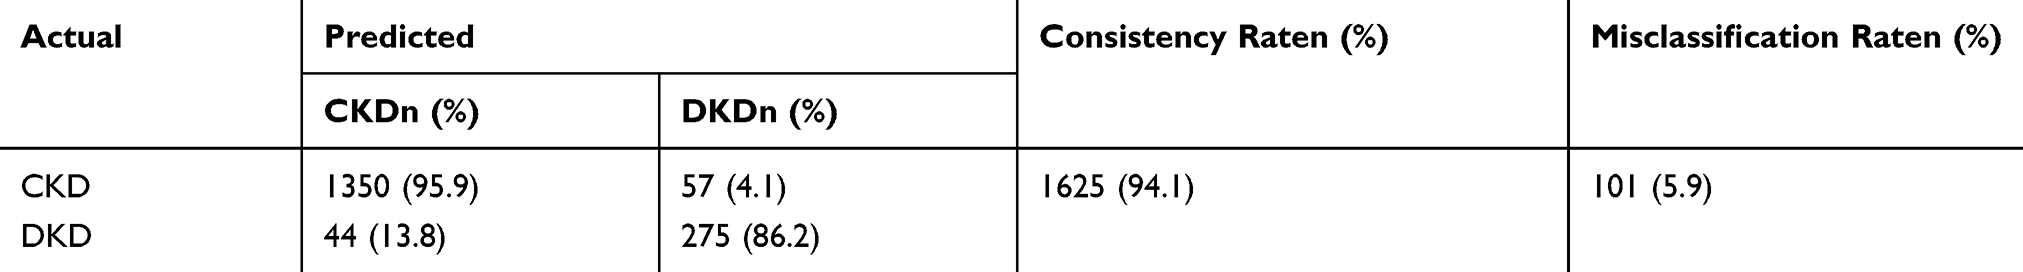 |
Table 3 Classification Results of Original and Cross-validated Method |
For DKD patients, Y = Gender×8.1960 + DP×0.6930 + GLU×7.8239 + Cys-C×3.7010 + eGFR×0.3693 + TVU×0.0080 + TCHO×3.1511 + FA×1.2849 + VB12×0.0101 + CK×0.0014 +CK–Mb × 0.0594–105.2924 (Table 4).
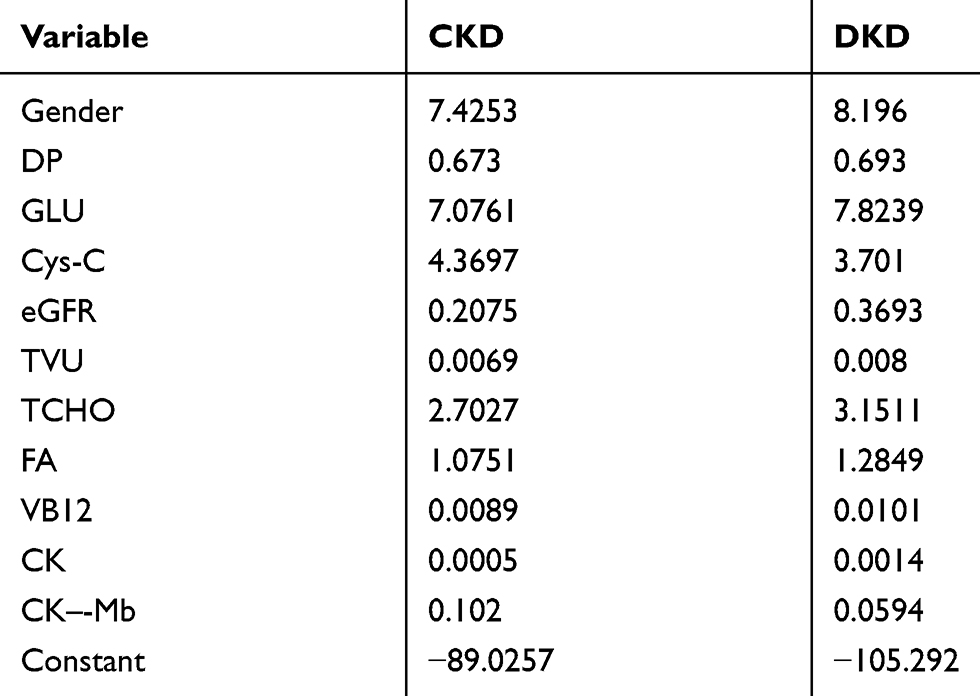 |
Table 4 CKD and DKD Classification Function Coefficients |
ROC Curve of Indicators
Eleven variables which showed significant effect for discrimination (Table 4) and new variable DS were included in ROC curve to analyze specificity and sensitivity. The results are shown in Figure 1 and Table 5.
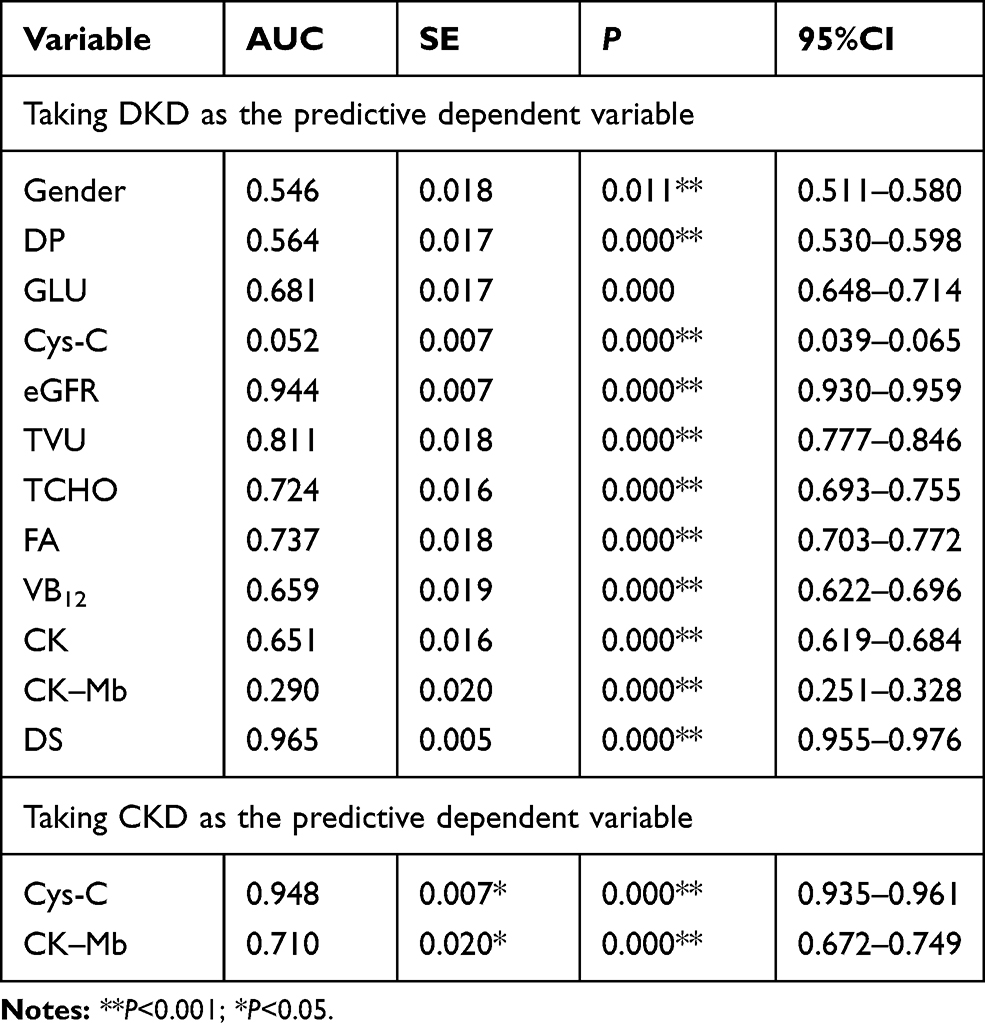 |
Table 5 Area Under the ROC Curves of Risk Factors |
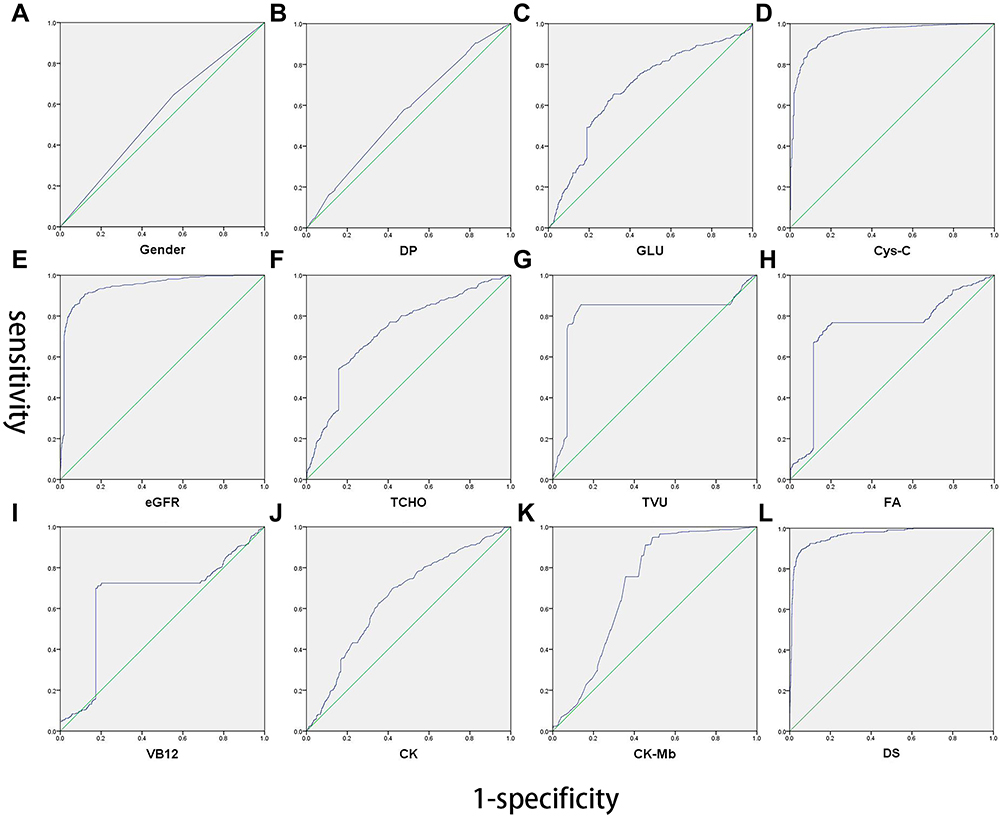 |
Figure 1 ROC curve of risk factors (A–L). |
The area under the curve (AUC) of indicator Gender, DP, GLU, eGFR, TVU, TCHO, FA, VB12 and CK respectively equals 0.546, 0.564, 0.743, 0.944, 0.811, 0.724, 0.737, 0.659, and 0.651, while eGFR had best efficacy for its AUC is approaching 1. However, the AUC of indicator Cys-C, and CK–Mb only equals 0.025 and 0.290. Thus, the predictive dependent variable was changed from DKD to CKD then the above analysis was repeated. Cys-C and CK–Mb showed positive test efficiency for CKD for their area under curve was 0.948, 0.710 (Figure 1D and K, Table 3). Indicator Cys-C had very good efficacy for CKD. For the DS, the AUC equals 0.965, indicating that this prediction model had the highest efficacy among all variables.
Discussion
In this study, all study subjects were divided into CKD group or DKD group, after comparing the differences of indicator levels between the two groups, relative statistically significant risk factors were also explored to indicate the occurrence of DKD compared to CKD. Then the stepwise discriminant analysis method was used to establish a new variable—DS to predict the occurrence of DKD. Finally, the test efficiency of each of the valuable indicators and the new variable DS was analyzed by drawing the ROC curve, providing basic data and theoretical support for the clinical application of DKD diagnosis.
The final result showed that female patients were more likely to develop DN than male patients, with OR=2.438. Moreover, no matter in all the study subjects, or in the CKD group and DN group, the proportion of women was higher than that of men, suggesting that women are more susceptible to kidney disease. Most previous studies have shown that women are a risk factor for CKD and DKD, and even women with diabetes have a greater prevalence of DKD compared to men.31,32 Besides, the high prevalence of diseases among women from this study also suggested that women may not pay attention to their health, while kidney disease is accompanied by a large number of secondary complications and poor prognosis, thus, we should focus more on diagnosis of female CKD and DKD in time. Gender was also used as one of the 11 discriminant variables with statistical significance between the two groups for the establishment of a new variable DS, with the corresponding model had high test efficiency for disease discrimination.
More DKD patients were apparently to have an abnormal BMI value (Table 1), even if this factor did not show positive relationship towards DKD after multivariate logistic regression— indicating that doctors also should pay more attention to their diet, hidden obesity and dietary control.
The blood pressure values of both groups were close to or exceeded the upper limit of blood pressure, but there were very few cases of extreme hypertension. The SP and DP level of DKD patients were higher than those of CKD patients, and the logistic regression results also suggested that high DP may be a risk factor—the risk to suffer from DKD of people with high DP was 1.746 times that of normal population. Fasting blood GLU as an obvious characteristic indicator of DKD, was consistent with the risk of patients with higher GLU more easily to suffer from DKD (OR=3.404) in this study. And it was also used as one of the 11 indicators establishing DS score and played a role in the prediction of DKD.
eGFR, as one of the most common indicators for renal function, has a very special significance in this study. First of all, the eGFR level both of CKD and DKD patients was lower than the normal value. By contrast, patients with DKD have a relatively small reduction in eGFR. Because there was no DKD patient classified into the normal group of eGFR level, we directly included eGFR as a continuous variable into the multivariate regression model. The results showed that based on CKD, the eGFR level was a relative risk factor for DKD (OR=1.107), that is, for every 1 mL/min further to the level of CKD patients, which means 1 mL/min closer to normal value, the risk of DKD could be relatively increased by 0.107. However, since both diseases had abnormal eGFR, it may be inferred that excessive reduction in eGFR was a characteristic manifestation of CKD. To a certain extent, the increase of eGFR (less than normal value) may increase the prevalence of DKD. eGFR had also contained in DS score, suggesting a significant effect for discriminating DKD from CKD. TVU of most subjects was in the normal range, the abnormality of TVU (less or more) in the results of multivariate regression analysis was more directed to the occurrence of DKD, OR=14.030. After considering the TVU value of each subject, although the results of stepwise discriminant analysis also suggest that there existed a significant difference between the two groups, it had little effect on the discriminant score. Therefore, the OR value of regression analysis only had a limited reference value.
TCHO of CKD patients were basically normal, while DKD patients showed a significant difference to it. After multivariate logistic regression analysis, the risk of suffering from DKD in people with abnormally elevated levels of TCHO was 3.004 times that of the normal population. Elevated total cholesterol can be commonly seen in nephrotic syndrome and diabetes. The results of our study may suggest that TCHO could be a more meaningful indicator for DKD, which echoes the results of using TCHO in DS scores. Most of subjects showed no deficiency of VB12, however, after classifying them into normal and abnormal level groups, the low level of VB12 was analyzed to be a protective factor for DKD, in other words, deficiency of VB12 may be happened in CKD patients more easily.
Although Cys-C, FA, CK and CK–Mb did not show positive results in a logistic regression model, they had been included into DS score establishment and showed very significant effect. This may be due to the value of each subject not being used in the regression model of categorical variables, the hazard risk analysis of Cys-C, FA, CK and CK–Mb for DKD or CKD was underestimated.
Based on the results of stepwise discriminant analysis, the DS score was established and its test efficiency is higher than that of any 11 variable which is statistically significant between the two groups. Thus, discriminant formula used for CKD and DN identification is more intuitive than accurate (Table 4). After completing the detection of DP, fasting blood GLU, Cys-C, eGFR, TVU, TCHO, FA, VB12, CK, and CK–Mb, doctor’s diagnosis can be assisted by substituting the indicator values into the discriminant. If the value of DKD calculated by the above formula is higher, this patient may be more likely to suffer from DKD than CKD, specifically.
Conclusion
Female, higher SP, fasting blood GLU and TCHO level were seen to be more indicative for DKD, while lower eGFR level and VB12 deficiency were more likely to point to CKD. Doctors can refer to the discriminant formula to assist in the differential diagnosis of the two diseases after completing the detection of DP, fasting blood GLU, Cys-C, eGFR, TVU, TCHO, FA, VB12, CK, and CK–Mb.
Data Sharing Statement
Our research data comes from the database of the Second Affiliated Hospital of Jilin University. The kidney disease-related data we extracted from this database has not been used in similar studies. Because the data in the database is the real data of inpatients, it is not available to the public.
Ethics Approval and Informed Consent
This study was approved by the Ethics Committee of the Second Affiliated Hospital of Jilin University, and the 2020 batch number is 055.
According to the regulations of the Ethics Committee of the Second Affiliated Hospital of Jilin University, we can omit the step of obtaining patient informed consent when applying for ethical approval, and directly consult the patient’s medical record for research. First, the reason is as follows: data on the laboratory test report of the patient’s first admission diagnosis extracted from the hospital medical record system was used in this study. No serum samples were taken from patients and no interventional clinical trials were performed on patients for research needs, at the same time, our study did not ask the patients to complete the laboratory test again to obtain complete information. Therefore, the Ethics Committee of the Second Affiliated Hospital of Jilin University approved our study to review the patient’s medical history without the patient’s consents. Second, we declare: The members of this research team guarantee to strictly abide by the statement of the Declaration of Helsinki when using the data, and keep all the patient data strictly confidential. The original data will not be disclosed or provided for download.
Consent for Publication
We confirm that the details of any images can be published, and that the persons providing consent have been shown the article contents to be published.
Acknowledgments
The data used in this study came from the Second Affiliated Hospital of Jilin University, so we would like to thank the Department of Nephrology for providing it. The authors acknowledge Xiumin Liu for her assistance with data extraction and handling, Yinpei Guo’s assistance with statistical analyses and writing assistance, Jing Wu’s assistance with data extraction, Nan Yao’s and Han Wang’s assistance with statistical analyses. Besides, the authors also thank mentor Professor Li for her guidance and quality assurance for this study.
Author Contributions
All authors made substantial contributions to conception and design, acquisition of data, or analysis and interpretation of data, and took part in drafting the article or revising it critically for important intellectual content; all of them agreed to submit to the current journal and gave final approval of the version to be published, agree to be accountable for all aspects of the work as well.
Disclosure
The authors report no conflicts of interest in this work.
References
1. Yang Z, Feng L, Huang Y, Xia N. A differential diagnosis model for diabetic nephropathy and non-diabetic renal disease in patients with type 2 diabetes complicated with chronic kidney disease. Diabetes Metab Syndr Obes. 2019;12:1963–1972. doi:10.2147/DMSO.S223144
2. Yan L. Relationship between plasma hyperhomocysteinemia and cerebral infarction and intervention measures. Shanxi Med J. 2012;041(014):697–698.
3. Jing S, Peng W, Jicai Z. Determination of plasma homocysteine in patients with gastrointestinal tumors. J Hubei Univ Med. 2003;22(2):95–96.
4. Jakubowski H. Molecular basis of homocysteine toxicity in humans. Cell Mol Life Sci. 2004;61(4):470–487. doi:10.1007/s00018-003-3204-7
5. McDowell IF, Lang D. Homocysteine and endothelial dysfunction: a link with cardiovascular disease. J Nutr. 2000;130(2S suppl):369S–372S. doi:10.1093/jn/130.2.369S
6. Selhub J. Folate, vitamin B12 and vitamin B6 and one carbon metabolism. J Nutr Health Aging. 2002;6(1):39–42.
7. Finer S, Saravanan P, Hitman G, Yajnik C. The role of the one-carbon cycle in the developmental origins of type 2 diabetes and obesity. Diabet Med. 2014;31(3):263–272. doi:10.1111/dme.12390
8. Friso S, Choi SW. Gene-nutrient interactions in one-carbon metabolism. Curr Drug Metab. 2005;6(1):37–46. doi:10.2174/1389200052997339
9. Tessari P, Vettore M, Puricelli L, et al. Decreased homocysteine trans-sulfuration in hypertension with hyperhomocysteinemia: relationship with insulin resistance. J Clin Endocrinol Metab. 2018;103(1):56–63.
10. Yiqun L, Lujin G, Wancang J, et al. Determination and significance of homocysteine and asymmetric dimethylarginine in patients with chronic kidney disease. Health Vocational Educ. 2019;37(02):135–137.
11. Jiapeng S, Huijie X, Jie D. Homocysteine: one of the common signs of heart and kidney injury. Chin J Appl Clin Pediatr. 2015;30(17):1355–1357.
12. Chao M-C, Hu S-L, Hsu H-S, et al. Serum homocysteine level is positively associated with chronic kidney disease in a Taiwan Chinese population. J Nephrol. 2014;27(3):299–305. doi:10.1007/s40620-013-0037-9
13. Ganguly P, Alam SF. Role of homocysteine in the development of cardiovascular disease. Nutr J. 2015;14:6. doi:10.1186/1475-2891-14-6
14. Ebrahimpour A, Vaghari-Tabari M, Qujeq D, et al. Direct correlation between serum homocysteine level and insulin resistance index in patients with subclinical hypothyroidism: does subclinical hypothyroidism increase the risk of diabetes and cardio vascular disease together? Diabetes Metab Syndr. 2018;12(6):863–867. doi:10.1016/j.dsx.2018.05.002
15. Movassat J, Delangre E, Liu J, et al. Hypothesis and theory: circulating Alzheimer’s-related biomarkers in type 2 diabetes. Insight from the Goto-Kakizaki rat. Front Neurol. 2019;10:649.
16. Ala OA, Akintunde AA, Ikem RT, et al. Association between insulin resistance and total plasma homocysteine levels in type 2 diabetes mellitus patients in south west Nigeria. Diabetes Metab Syndr. 2017;S1871402117301649.
17. Cianciolo G, De Pascalis A, Di Lullo L, et al. Folic acid and homocysteine in chronic kidney disease and cardiovascular disease progression: which comes first? Cardiorenal Med. 2017;7(4):255–266. doi:10.1159/000471813
18. Bostom AG, Carpenter MA, Kusek JW, et al. Homocysteine-lowering and cardiovascular disease outcomes in kidney transplant recipients: primary results from the folic acid for vascular outcome reduction in transplantation trial. Circulation. 2011;123(16):1763–1770. doi:10.1161/CIRCULATIONAHA.110.000588
19. Jardine MJ, Kang A, Zoungas S, et al. The effect of folic acid based homocysteine lowering on cardiovascular events in people with kidney disease: systematic review and meta-analysis. BMJ. 2012;344(jun13 2):e3533. doi:10.1136/bmj.e3533
20. George C, Matsha TE, Erasmus RT, et al. Haematological profile of chronic kidney disease in a mixed-ancestry South African population: a cross-sectional study. BMJ Open. 2018;8(11):e025694. doi:10.1136/bmjopen-2018-025694
21. Jiang YY, Zou YC, Qi J, et al. Observation and analysis of plasma coagulation results in patients with nephropathy.
22. Palazzuoli A, Ruocco G, Pellicori P, et al. The prognostic role of different renal function phenotypes in patients with acute heart failure. Int J Cardiol. 2019;276:198–203. doi:10.1016/j.ijcard.2018.11.108
23. Xie Y, Bowe B, Li T, et al. Higher blood urea nitrogen is associated with increased risk of incident diabetes mellitus. Kidney Int. 2018;93(3):741–752.
24. Han QX, Zhang D, Zhao YL, et al. Analysis of chronic kidney disease staging with different estimated glomerular filtration rate equations in Chinese centenarians. Chin Med J. 2019;132(5):512–518. doi:10.1097/CM9.0000000000000079
25. Wallace A, Price A, Fleischer E, et al. Estimation of GFR in patients with cystic fibrosis: a Cross-Sectional Study. Can J Kidney Health Dis. 2020;7:2054358119899312.
26. Ying P, Yang C, Wu X, et al. Effect of hydrocortisone on the 28-day mortality of patients with septic acute kidney injury. Ren Fail. 2019;41(1):794–799. doi:10.1080/0886022X.2019.1658605
27. Takahashi M, Takayama S, Suga H, et al. Factors resulting correlation and differences in renal function evaluation index using the serum cystatin c and creatinine as measured by an enzymatic method. Yakugaku Zasshi. 2020;140(1):81–90. doi:10.1248/yakushi.18-00225
28. Khosravi N, Zadkarami M, Chobdar F, et al. The value of urinary cystatin C level to predict neonatal kidney injury. Curr Pharm Des. 2018;24(25):3002–3004. doi:10.2174/1381612824666180918100819
29. Liu ZX, Hong Q, Peng DH, et al. Evaluation of serum free fatty acids in chronic renal failure: evidence from a rare case with undetectable serum free fatty acids and population data. Lipids Health Dis. 2019;18(1):151. doi:10.1186/s12944-019-1093-5
30. Zhang H, Shi S, Zhao XJ, et al. Association between the lipid profile and renal dysfunction in the heart failure patients. Kidney Blood Press Res. 2019;44(1):52–61. doi:10.1159/000498834
31. Narayan KM, Boyle JP, Thompson TJ, Sorensen SW, Williamson DF. Lifetime risk for diabetes mellitus in the United States. JAMA. 2003;290(14):1884–1890. doi:10.1001/jama.290.14.1884
32. Yu MK, Lyles CR, Bent-Shaw LA, Young BA, Pathways Authors. Risk factor, age and sex differences in chronic kidney disease prevalence in a diabetic cohort: the pathways study. Am J Nephrol. 2012;36(3):245–251. doi:10.1159/000342210
 © 2020 The Author(s). This work is published and licensed by Dove Medical Press Limited. The full terms of this license are available at https://www.dovepress.com/terms.php and incorporate the Creative Commons Attribution - Non Commercial (unported, v3.0) License.
By accessing the work you hereby accept the Terms. Non-commercial uses of the work are permitted without any further permission from Dove Medical Press Limited, provided the work is properly attributed. For permission for commercial use of this work, please see paragraphs 4.2 and 5 of our Terms.
© 2020 The Author(s). This work is published and licensed by Dove Medical Press Limited. The full terms of this license are available at https://www.dovepress.com/terms.php and incorporate the Creative Commons Attribution - Non Commercial (unported, v3.0) License.
By accessing the work you hereby accept the Terms. Non-commercial uses of the work are permitted without any further permission from Dove Medical Press Limited, provided the work is properly attributed. For permission for commercial use of this work, please see paragraphs 4.2 and 5 of our Terms.