")
Back to Journals » Infection and Drug Resistance » Volume 13
Discovery of Potential Plasma Biomarkers for Tuberculosis in HIV-Infected Patients by Data-Independent Acquisition-Based Quantitative Proteomics
Authors Shen Y , Xun J, Song W, Wang Z, Wang J, Liu L, Zhang R, Qi T, Tang Y, Chen J, Sun J, Lu H
Received 9 January 2020
Accepted for publication 7 April 2020
Published 24 April 2020 Volume 2020:13 Pages 1185—1196
DOI https://doi.org/10.2147/IDR.S245460
Checked for plagiarism Yes
Review by Single anonymous peer review
Peer reviewer comments 2
Editor who approved publication: Dr Joachim Wink
Yinzhong Shen, Jingna Xun, Wei Song, Zhenyan Wang, Jiangrong Wang, Li Liu, Renfang Zhang, Tangkai Qi, Yang Tang, Jun Chen, Jianjun Sun, Hongzhou Lu
Department of Infection and Immunity, Shanghai Public Health Clinical Center, Fudan University, Shanghai 201508, People’s Republic of China
Correspondence: Hongzhou Lu Email [email protected]
Purpose: Tuberculosis (TB) is the leading cause of mortality in individuals infected with human immunodeficiency virus (HIV), yet the methods for detecting Mycobacterium tuberculosis at an early stage remain insensitive or ineffective. This study aimed to discover plasma biomarkers for distinguishing HIV-TB coinfected individuals from HIV individuals without TB (HIV-nonTB).
Patients and Methods: A total of 200 Chinese HIV-positive patients were recruited, 100 each for HIV-nonTB group and HIV-TB group. Plasma proteomic profiles were analyzed for 50 patients each in both groups, using data-independent acquisition (DIA)-mass spectrometry-based proteomics. Differently expressed proteins were revealed with ridge regression analysis. Enzyme-linked immunosorbent assay (ELISA) analyses were performed for further validation in other 100 patients.
Results: DIA-mass spectrometry revealed 13 upregulated and 33 downregulated proteins in the HIV-TB group. AMACR (α-methylacyl-CoA racemase), LDHB (L-lactate dehydrogenase B chain), and RAP1B (Ras-related protein Rap-1b) were selected for building a diagnostic model, for which the receiver operation characteristic curve had under areas of 0.99 and 0.89 testing with proteomics data (sensitivity = 92%, specificity = 100%) and ELISA data (sensitivity = 76%, specificity = 92%), respectively.
Conclusion: The combination of AMACR, LDHB, and RAP1B proteins may serve as a potential marker of TB in HIV-infected patients.
Keywords: diagnosis, coinfection, AIDS-related opportunistic infections, Mycobacterium tuberculosis, ROC curve, proteome
Introduction
Tuberculosis (TB) is one of the most deadly infectious diseases worldwide and also the leading cause of mortality in HIV-positive (HIV+) population.1–3 The World Health Organization (WHO) reported an estimated 0.8 million TB cases attributable to HIV infection worldwide in 2018.3 The HIV-positive state makes people more prone to tuberculosis and can also activate the existing latent TB infection.4 Management of co-infected patients can be complicated due to multiple drug–drug interactions and compromised immune function.5 Hence, co-infection poses great challenges for both diagnoses and treatment.
Early detection of TB in the HIV+ population can reduce TB transmission, morbidity, and mortality. However, the atypical clinical manifestation due to HIV infection state makes diagnosis rather challenging. When TB occurs to an HIV+ patient, the disease tends to be disseminated tuberculosis, rather than sputum producing pulmonary tuberculosis. Unfortunately, sputum smear microscopy is still the most frequently used method for rapid TB diagnosis in HIV+ patients, with unsatisfactory sensitivity and specificity. Compared with smear, Mycobacterium tuberculosis (Mtb) culture or nucleic acid detection assays are more sensitive. The result waiting time for the former test can be several weeks, which largely undermines its usage in early diagnosis. And both tests require either sputum or tissue samples, for which the collection process is of great difficulty. Besides, they are not usually affordable and available in resource-limited settings.6,7 All these factors necessitate an urgency to develop a simple, inexpensive, rapid, non-traumatic and accurate test for TB.
Recent works revealed that serum proteins secreted by various cells (the secretomes) can reflect the physiological and pathological status of cells, and thus are promising biomarkers for different disease states.8,9 Methods using mass spectrometry (MS)-based proteomics for detecting biomarkers in serum are effective in diagnosing complex diseases including TB.8–12 MS-based proteomics can analyze all the proteins in serum to discover and quantify the TB-associated protein expression changes, which is independent from the detection of M. tuberculosis. Studies have already identified multiple potential TB biomarkers using MS-based proteomics, including iTRAQ-based proteomics, and surface-enhanced laser desorption ionization time of flight mass spectrometry (SELDITOF-MS).10–12 However, only a few studies have focused on examining the serum proteomic profiles in HIV+ patients co-infected with TB, which are more complicated than in those of TB individuals without HIV infection.10,12–14 Among these studies, only Chen et al concentrated on the Chinese population, from which endoglin was identified as a potential biomarker based on iTRAQ-based proteomics.12 Due to the limited size of the total samples used in iTRAQ-based proteomics, additional true biomarkers could be missed. Moreover, the study did not establish a simple visual model, especially one with high diagnostic performance in a blind testing set, to discriminate HIV-TB coinfected from HIV-nonTB individuals.
SWATH-like data-independent acquisition-mass spectrometry (DIA-MS) becomes a promising tool that combines deep proteome coverage capabilities with quantitative consistency and accuracy.15 This label-free proteomics technique overcomes multiple shortages of traditional proteomics data-dependent acquisition (DDA) method and is increasingly used in targeted proteomics analysis.15 Here, we focused on Chinese HIV-TB coinfected and HIV-nonTB cohorts, which is difficult to diagnose at an early stage using traditional detection methods, such as sputum culture. Using the DIA-MS proteomics technique, we generated a new proteomic profile for distinguishing HIV-TB from HIV-nonTB. Furthermore, we constructed and validated an effective diagnostic model with higher accuracy for discriminating HIV-TB from HIV-nonTB.
Patients and Methods
Patient Recruitment
TB cases were defined as any form of TB in HIV-infected patients, with or without microbiological confirmation. TB diagnosis was based on comprehensive clinical features, including radiological and laboratory exams such as chest X-ray, sputum acid-fast bacilli (AFB) smear and culture and pathological examination.
On enrollment, patients were interviewed with structured questionnaires and then received physical examination along with TB screening tests. Demographic and risk-behavior information, medical histories, clinical presentation, chest radiologic findings, and laboratory test results were collected at the point of diagnosis.
The diagnosis of HIV infection was confirmed by Western blot tests for HIV antibody according to the national HIV/AIDS diagnostic criteria. A total of 200 HIV-infected individuals were enrolled, 100 each for TB group (HIV-TB) and non-TB group (HIV-nonTB).
The study was conducted in accordance with the declaration of Helsinki. Both the study protocol and the informed consent procedure were approved by the Shanghai Public Health Clinical Center Ethics Committee. All participants signed the consent form before enrollment. The dataset used for analysis did not include patient identifiers.
Plasma Sample Collection and Preparation
Blood specimens were collected with ethylenediaminetetraacetic acid tubes, and then be centrifuged and separated. Plasma samples were kept in aliquots at −80°C until further testing.
Protein Sample Preparation
Fifty samples were taken from each of the two groups for proteomics analysis. Total protein was extracted according to a standard protocol. Briefly, frozen plasma samples were homogenized with SDT (4%SDS, 100mM Tris-HCl, pH 7.6). Proteins were isolated by centrifugation at 14000g for 15 min at 4°C, and their concentrations were quantified using the Bradford protein assay kit (Thermo Fisher Scientific Inc, Rockford, IL, USA).
A total of 200 μg protein of each sample was added with DTT, with a final concentration of 100 mM, and incubated in a boiling bath for 5 min. Then, the sample was added with 200 μL UA buffer and centrifuged at 12500g for 25 min. Subsequently, 100μL iodoacetamide (IAA) buffer (100mM IAA in UA) was added at room temperature. The samples were kept in darkness for 30 min to facilitate the alkylation reaction. Then, 100uL UA buffer was added and centrifuged at 12500g for 15 min. Next, 100μL 40mM NH4HCO3 buffer was added and centrifuged at 12500g for 15 min. The proteins were digested for 16–18 h at 37°C by adding 40μL trypsin (Promega, Madison, WI, USA). The released peptides were desalted using C18 Cartridge (Thermo, USA). Finally, the samples were dried and resuspended in 40 μL 0.1% formic acid.
Mass Spectrometry (MS) of the Samples
Samples were analyzed on an Agilent 1260 Infinity II HPLC system. The combined mixtures were reconstituted in buffer A (10mM HCOONH4, 5% ACN, pH 10.0). Then, the solutions were fractionated with a reverse-phase column (XBridge Peptide BEH C18 Column, 130Å, 5 µm, 4.6 mm X 100 mm, Waters Corporation, United States). The separation gradient is linear: 0–40 min, 5–45% buffer B (10mM HCOONH4, 85% ACN, pH 10.0). A total of 36 fractions were dried by vacuum centrifugation and merged into 10 fractions. Each fraction was dissolved in 30μL 0.1% formic acid for further usage.
For both DDA and DIA, 9 µL of each fraction was spiked with 1 µL 10×iRT peptides (Biognosys), respectively, at the recommended 1:10 ratio and analyzed separately. Peptide spectral libraries were generated using nano-LC MS/MS. DIA was run using various gradient lengths and sample amounts at both nanoflow rates and capillary flow rates.
The parameters used in DDA mode analysis are as follows: (1) MS: scan range (m/z)=350–1500; resolution=60,000; AGC target=400,000; maximum injection time=50 ms; include charge states=2–6; Filter Dynamic Exclusion: exclusion duration=45 s; (2) HCD-MS/MS: Isolation window=1.6Th, resolution=50,000; AGC target=1,000,000; maximum injection time=100 ms; collision energy=35%; stepped CE=5%.
The parameters used in DIA mode analysis were as follows: (1) MS: scan range (m/z)=350–1200; resolution=60,000; AGC target=400,000; maximum injection time=50 ms; (2) HCD-MS/MS: resolution=30,000; AGC target=400,000; maximum injection time=72 ms; collision energy=35%; stepped CE=5%.
Spectral Library Generation
A spectral library was generated from the DDA data using the Spectronaut Pulsar X (version 12, Biognosys AG). The raw DDA data sets were searched against the Homo sapiens isoform SwissProt database (42,356 entries). The FASTA file of the human non-redundant protein sequence was downloaded in June 2018. Up to two missing cleavages in tryptic peptides were allowed. Carbamidomethylation of cysteine was selected as a fixed modification while oxidation of methionine and N-terminal acetylation were set as variable modifications. The data were processed with 1% False Discovery Rate (FDR) at both peptide and precursor levels.
The data generated in the DIA mode MS analysis were analyzed using Spectronaut Pulsar X with default parameters (BGS Factory Settings). The data were processed with 1% False Discovery Rate (FDR) at the precursor level.
Bioinformatics Analysis
To screen out differentially expressed proteins, the threshold of fold change difference between two groups was 1.5 (up or down) and the p-value (t-test) was set at 0.05, with the coefficient variation (CV) within-group <50% and missing values <50%.
The gene ontology (GO) annotations for those differentially expressed proteins was performed by Blast2GO.16 The significantly enriched GO terms were performed under the background of all the identified proteins using Fisher’s exact test. The KEGG pathway enrichment analysis was conducted using KAAS (KEGG Automatic Annotation Server),17 with the identified proteins as the background set.
Enzyme-Linked Immunosorbent Assay (ELISA)
To confirm the expression changes of selected proteins identified by DIA analysis, 20 proteins were selected and quantified by ELISA in a separate population consisting of 50 HIV-TB coinfected and 50 HIV-nonTB patients. All ELISA kit catalog details were listed in Supplementary Table S2. Measurements were performed based on the kit manufacturer’s specifications. Briefly, standard or sample was incubated in microtiter wells containing antibodies of proteins for 2 h. Then, the liquid of each well was removed, and the biotinylated tracer antibody conjugated with streptavidin peroxidase was added. The plates were continued to be incubated for 1 h. After washing, signal was developed by adding substrate TMB for 30 min, followed by the addition of sulfuric acid. Within 5 min, the absorbance was read at 450 nm on an ELISA plate reader (BioTek). The data were analyzed using Excel, student’s t-test was used to compare means between two groups.
Construction of the Diagnostic Model
Before building a diagnostic model, samples were randomly divided into test (25 HIV-nonTB and 25 HIV-TB) and validation (25 HIV-nonTB and 25 HIV-TB) sets. The test set was used to select plasma protein markers and construct discriminant models whereas the validation set was used to validate discriminant models.
Initially, we calculated the coefficients for the top 20 differentially expressed proteins identified in DIA analysis using ridge regression with 10-fold cross-validation. Then, three proteins with highest coefficients (absolute value), i.e., α-methylacyl-CoA racemase (AMACR), L-lactate dehydrogenase B chain (LDHB), and Ras-related protein Rap-1b (RAP1B), were selected to construct a diagnostic model using DIA data and ELISA data, respectively. The logistic regression method was used during model construction. The diagnostic sensitivity, specificity, accuracy, and ROC curves were calculated for each model in the validation sets.
Results
Protein Identification and Relative Quantification
DIA MS requires an assay library containing the spectra of all the peptides to be quantified. DDA analysis was conducted to generate a spectral library. A total of 5278 peptides representing 1449 proteins were identified. Principal-component analysis (PCA) showed substantial variability in the distribution of protein abundance between sample conditions (Figure 1A). To determine significant differences in abundance between these two groups, t-tests were initially performed on these proteins as shown in the volcano plot using -log10(P-value) vs. log2(fold change of two groups) (Figure 1B). In addition to fold change (|FC|>1.5) and p-value (<0.05), more rigorous criteria regarding coefficient of variation (CV<0.5) and percentage of missing value (<50%) within groups were considered to reduce false-positive rates. Finally, a total of 46 proteins were identified significantly differentially expressed between two groups, of which 13 were upregulated and 33 were downregulated in HIV-TB group (Supplementary Table S1). Hierarchical clustering showed that these proteins well distinguished the two groups, indicating them to be potential biomarkers (Figure 1C).
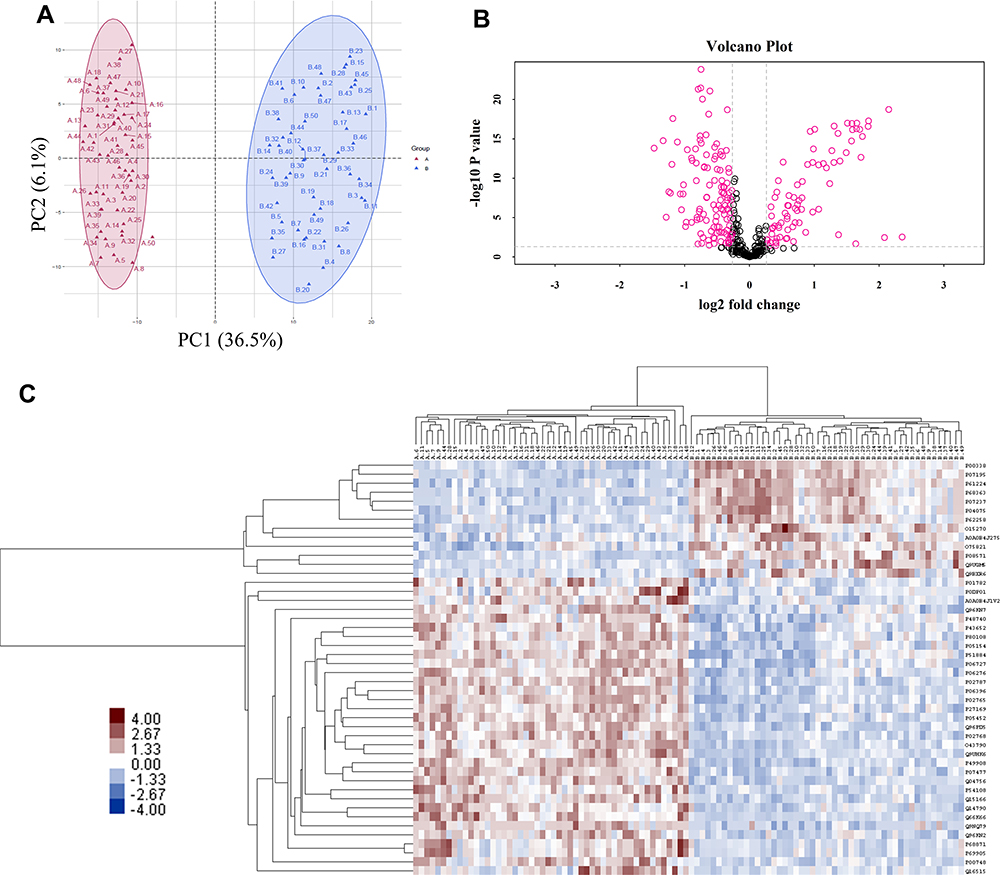 |
Figure 1 Features of the plasma proteome dataset from label-free quantitative proteomics analysis. (A) The PCA plot was used to check and distinguish the 5278 peptide fragment ions between the two groups. A represents individuals in HIV-nonTB group and B denotes individuals in HIV-TB group; (B) a volcano plot of proteins in HIV-TB relative to HIV-nonTB group; (C) hierarchical cluster analysis of the 46 differentially expressed proteins. |
Gene Ontology (GO) Analysis
The Blast2GO was employed to retrieve GO terms associated with the hits obtained after a BLAST search of a total of 992 GO terms associated with the sequences of 46 differentially expressed proteins were extracted (Figure 2). Organelle proteins, cell part proteins, and cell proteins were the majority among 46 differentially expressed proteins in terms of cellular components; binding proteins were dominant in terms of molecular functions; proteins were mainly involved in cellular process, single-organism process, biological regulation, regulation of biological process, metabolic process, and response to stimulus in terms of cellular process.
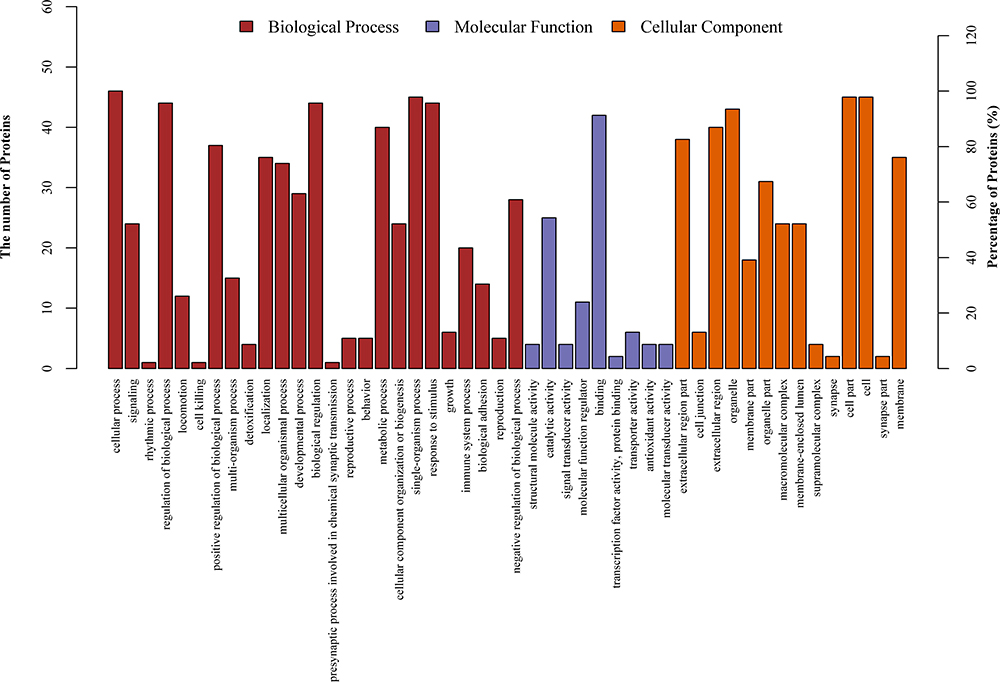 |
Figure 2 GO annotation terms of differentially expressed proteins at GO level 2. |
GO Enrichment Analysis for Differentially Expressed Proteins
The identification of significantly enriched GO terms was performed under the background of all the identified proteins using Fisher’s exact test. The results indicated that the differentially expressed proteins in two patient groups were mainly involved in the catabolic process, respondence of inorganic substance, and single-organism catabolic process (Figure 3).
 |
Figure 3 Significantly enriched GO terms for the differentially expressed proteins. |
KEGG Pathway Enrichment Analysis of Differentially Expressed Proteins
Like GO enrichment analysis, KEGG pathway enrichment analysis of the 46 proteins was also analyzed under the background of identified proteins set by Fisher’s exact test. As a result, 105 relevant KEGG signaling/metabolic pathways were obtained, among which the top 8 significantly enriched pathways were associated with metabolism and immune processes (Figure 4).
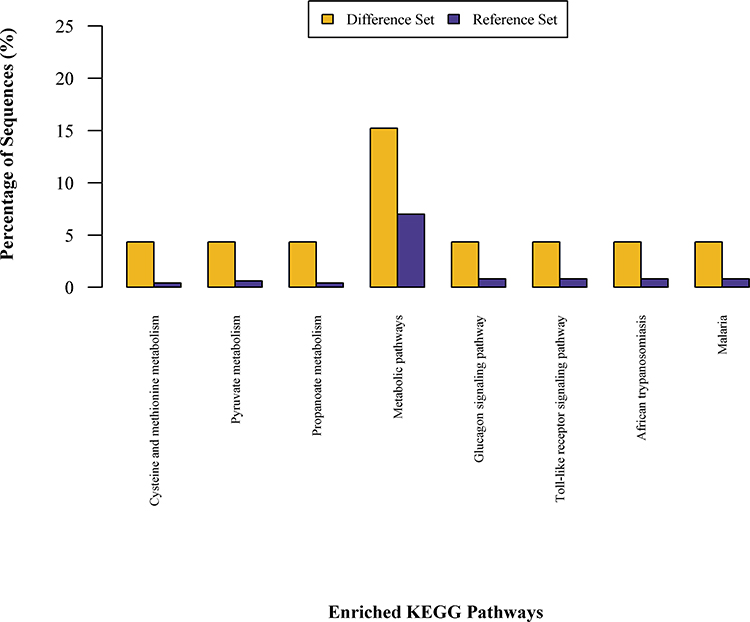 |
Figure 4 KEGG pathway enrichment analysis for the 46 differentially expressed proteins. |
Validation of DIA Results by ELISA
In order to validate the dysregulated proteins based on DIA results, the 20 most differentially expressed proteins based on ridge regression coefficients between two patient cohorts were further measured by ELISA. The detailed information on these 20 proteins is listed in Supplementary Table S2. The ELISA results showed that 10 of them were consistent with DIA results, which showed statistically significant differences in protein level. For example, CLEC3B, CNDP1, SELENOP, PON3, AMACR, PGLYRP2, and BCHE were significantly downregulated in HIV-TB cohort in comparison with HIV-nonTB cohort, while LDHB, RAP1B, and CD14 were upregulated in HIV-TB cohort compared with HIV-nonTB cohort (Figure 5). The fold changes in CASP8, GSN, LDHA, PON1, and TUBA1B proteins between two cohorts detected by ELISA were inconsistent with DIA results in terms of direction. The ELISA results from other proteins failed to reach a statistical difference between the two groups.
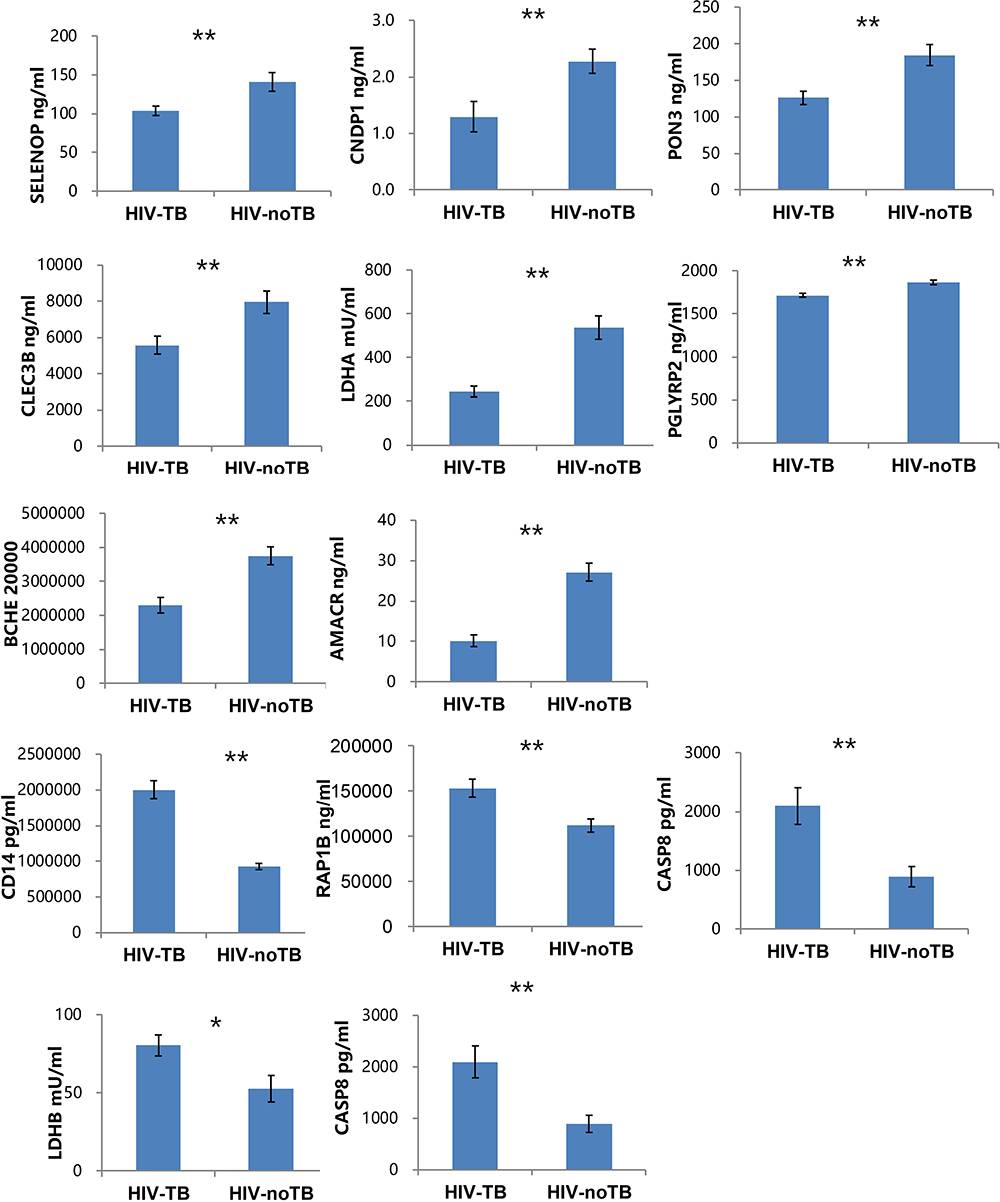 |
Figure 5 Levels of candidate biomarkers (mean±SEM) were measured by ELISA in plasma of HIV-TB (n = 50) and HIV-nonTB patients (n = 50). Notes: Only 12 proteins are shown, and the details of all 20 proteins are listed in Table S2. The p-values were calculated with the two-tailed t-test. *p < 0.05; **p < 0.001. |
Diagnostic Value of the Model
To develop a model for discriminating the two cohorts, 50 HIV-nonTB and 50 HIV-TB samples were equally assigned into the test set and validation set. First, we ranked the top 20 differentially expressed proteins identified in DIA result based on ridge regression coefficients (Supplementary Table S3). Then, we chose three proteins with highest coefficients and validated by ELISA, i.e., AMACR, LDHB, and RAP1B, to build a predictive model using DIA data and ELISA data, respectively. For DIA data (Figure 6A), the area under the receiver operator characteristic curve (AUC) of the combined model (AMACR, LDHB, and RAP1B) in validation set to distinguish HIV-TB from HIV-nonTB was 0.99, which was higher than that of the single factor models (0.97 for AMACR; 0.87 for LDHB; 0.83 for RAP1B). The sensitivity and specificity of the single factor models were 90% and 94%, 77% and 90%, and 88% and 72%, respectively. The combined model showed better performance in sensitivity (92%) and specificity (100%).
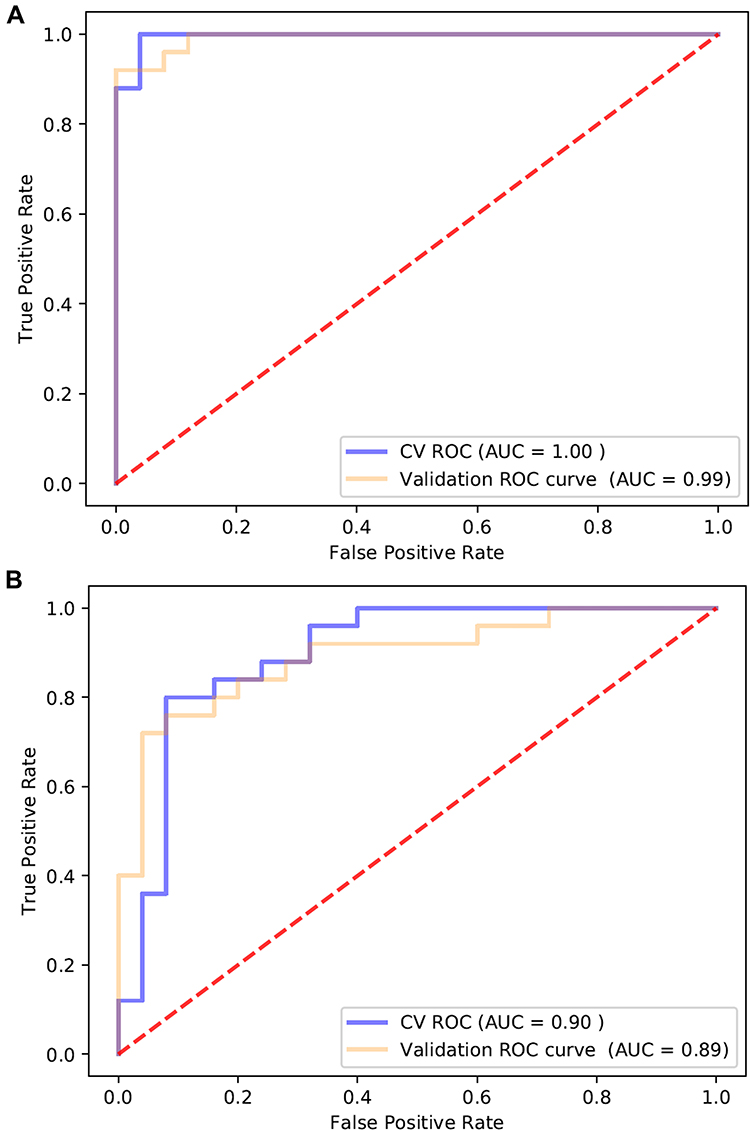 |
Figure 6 ROC curve analysis of AMACR, LDHB, and RAP1B combination using (A) proteomics data and (B) ELISA data to discriminate HIV-TB from HIV-nonTB individuals. |
For ELISA data (Figure 6B), the AUC of the combined model was 0.89. The sensitivity and specificity were 76% and 92%, respectively. Altogether, our results suggest that the proteins AMACR, LDHB, and RAP1B can serve as potential biomarkers to differentiate both cohorts with sensitivity and specificity.
Discussion
Currently, individuals with co-infected TB and HIV are at high risk of death.1–3 The treatment and diagnosis of co-infection remain a major global public health challenge. Moreover, multidrug-resistant tuberculosis (MDR-TB) has recently increased annually by over 20%, which is much harder to treat and leads to elevated mortality.18 Due to the poor performance of the current diagnostic methods, such as sputum smear microscopy, for diagnosing TB in HIV-infected patients, an easy, sensitive, and specific test is urgently needed in remote and resource-constrained settings.
Identifying the TB-associated proteins in HIV patients will facilitate early diagnosis and understanding of the pathogenesis of TB in HIV-positive patients. Here, a label-free quantitative proteomics technique was used for the comparison of plasma proteomic profiles between HIV-TB co-infected patients and HIV-infected patients. Although several studies have explored potential biomarkers for HIV-TB coinfection in serum from different populations by proteomics,10,12–14 only one study paid attention to Chinese populations, and one protein, endoglin, was detected between HIV-TB and HIV-nonTB using iTRAQ-based proteomics analysis and confirmed by ELISA.12 However, this protein was not detected in our study, possibly due to the difference in sample size and techniques used in proteomics.
Label-free DIA removes the requirement for protein staining or peptide labeling and fragments every single peptide in a sample. Hence, it is a powerful technique for discovering proteomics with a high capacity for multiplexing, a modest need for sample volume per analyte, and increased depth and reproducibility compared with other proteomic technologies.15,19,20 This method has been applied to detect potential biomarkers in different diseases.21,22 Through DIA-based quantitative proteomics, here we identified a total of 46 differentially expressed proteins in HIV patients with or without TB. Among these candidate proteins, 13 were upregulated and 33 were downregulated in HIV-TB group, compared with nonTB group. These dynamically changing proteins may play essential roles in anti-TB immunity, and partially the shift may reflect the reverse manipulation by pathogens. For example, we found that CD14 (Monocyte differentiation antigen CD14), and RAP1B (Ras-related protein Rap-1b) were elevated in the plasma of HIV-TB patients, which could interact with IKK leading to NF-kB activation and pro-inflammatory cytokine expression.23,24 The upregulation of CD14 was previously reported in pulmonary TB patients,25,26 while knockout of CD14 may reduce mortality during murine tuberculosis due to reduced inflammatory response.27 Sphingolipids were found to participate in bacteria virulence promotion, and SPT (Serine palmitoyltransferase) is the rate-limiting enzyme of the de novo sphingolipid biosynthesis.28 Thus, the increased SPT expression level may favor the growth of Mtb. A recent study found that genetic knockout or inhibition of SPT could greatly reduce Mtb uptake by diverse cell types without affecting other forms of endocytosis.29 In contrast to SPT2, AMACR (α-methylacyl-CoA racemase), which is critical for β-oxidation of branched fatty acids in both mycobacteria and humans, was downregulated in HIV-TB group compared to HIV-nonTB group. Similar findings were presented by Cruz et al, who discovered that the expression of host AMACR gene in tuberculoid leprosy patients was lower than that in lepromatous leprosy individuals.30
Some studies have shown lower concentration of serum selenium in TB patients compared with healthy controls,31 while other studies revealed the association between selenium level and TB disease severity.32 Consistent with these findings, we observed that SELENOP, a major selenoenzyme in plasma, was downregulated in HIV-TB patients. Besides, level of PGLYRP2 tended to be lower in HIV-TB patients, suggesting the innate immune response to be undermined by the pathogen.33 These findings were also supported by Achkar et al10 During progression of infection by M. tuberculosis, the macrophage infection experienced a metabolic switch from mitochondrial oxidative phosphorylation to aerobic glycolysis, then went to late adaptation/resolution stage in which macrophages transitioned from glycolysis to mitochondrial oxidative metabolism, leading to impairment of macrophage proinflammatory and antimicrobial responses.34 LDHB (L-lactate dehydrogenase B chain) is a central enzyme in lactate metabolism, which preferentially converts lactate into pyruvate, fueling oxidative metabolism. Therefore, the increase of LDHB in HIV-TB individuals could erode macrophage response to TB infection.
Based on these 46 differentially expressed proteins, we successfully developed a prediction model by combining the expression levels of 3 host proteins, AMACR, LDHB, and RAP1B. Logistic regression analysis showed that the panel of these three proteins could improve the diagnostic AUC to 99% (DIA data) and 89% (ELISA data), accuracy to 88% (DIA data) and 80% (ELISA data), specificity to 100% (DIA data) and 92% (ELISA data), and sensitivity to 92% (DIA data) and 76% (ELISA data) for discriminating HIV-TB from HIV-nonTB patients.
Conclusion
In this study, we examined plasma proteomic profiles in a Chinese population of HIV-TB coinfected and HIV-nonTB cohorts and identified 46 differentially expressed proteins between them. Our results were corroborated by ELISA assay. Further, we built a new diagnostic model with combination of AMACR, LDHB, and RAP1B, which had higher diagnostic accuracy for discriminating HIV-TB individuals from HIV-nonTB population. These results may expand our knowledge of the HIV-TB coinfection.
Acknowledgments
We thank Dr. Zhihao Meng (Longtan Hospital of Guangxi, Guangxi), Dr. Xiangchan Lu (The Fourth People’s Hospital of Guangxi, Guangxi), for assistance with data and sample collection. This work was funded by Key Research grants from the Ministry of Science and Technology, the People’s Republic of China (NO: 2017ZX10202101), The Medical Guidance Support Project of Shanghai Science and Technology Commission (No: 17411969600), and “Tomorrow Star” Famous Medical Clinicians’ Cultivation Project of Fudan University (NO: RC-QT-2019-01).
Author Contributions
All authors made substantial contributions to conception and design, acquisition of data, or analysis and interpretation of data; took part in drafting the article or revising it critically for important intellectual content; gave final approval of the version to be published; and agreed to be accountable for all aspects of the work.
Disclosure
Prof. Dr. Yinzhong Shen reports grants from Program for the 13th Five-year Plan, The Medical Guidance Support Project of Shanghai Science and Technology Commission, “Tomorrow Star” Famous Medical Clinicians’ Cultivation Project of Fudan University, during the conduct of the study. Prof. Dr. Hongzhou Lu reports grants from Program for the 13th Five-year Plan, The Medical Guidance Support Project of Shanghai Science and Technology Commission, during the conduct of the study. The authors report no other conflicts of interest in this work.
References
1. Corbett EL, Watt CJ, Walker N, et al. The growing burden of tuberculosis: global trends and interactions with the HIV epidemic. Arch Intern Med. 2003;163(9):1009–1021. doi:10.1001/archinte.163.9.1009
2. Ai JW, Ruan QL, Liu QH, Zhang WH. Updates on the risk factors for latent tuberculosis reactivation and their managements. Emerg Microbes Infect. 2016;5:e10. doi:10.1038/emi.2016.10
3. World Health Organization. Global tuberculosis report. October, 2019. Available from: https://apps.who.int/iris/bitstream/handle/10665/329368/9789241565714-eng.pdf.
4. Diedrich CR, Flynn JL. HIV-1/mycobacterium tuberculosis coinfection immunology: how does HIV-1 exacerbate tuberculosis? Infect Immun. 2011;79(4):1407–1417. doi:10.1128/IAI.01126-10
5. Schutz C, Meintjes G, Almajid F, Wilkinson RJ, Pozniak A. Clinical management of tuberculosis and HIV-1 co-infection. Eur Respir J. 2010;36(6):1460–1481. doi:10.1183/09031936.00110210
6. Elliott AM, Namaambo K, Allen BW, et al. Negative sputum smear results in HIV-positive patients with pulmonary tuberculosis in Lusaka, Zambia. Tuber Lung Dis. 1993;74(3):191–194. doi:10.1016/0962-8479(93)90010-U
7. Lawson L, Yassin MA, Ramsay A, Emenyonu NE, Squire SB, Cuevas LE. Comparison of scanty AFB smears against culture in an area with high HIV prevalence. Int J Tuberc Lung Dis. 2005;9(8):933–935.
8. Hathout Y, Brody E, Clemens PR, et al. Large-scale serum protein biomarker discovery in Duchenne muscular dystrophy. Proc Natl Acad Sci U S A. 2015;112(23):7153–7158. doi:10.1073/pnas.1507719112
9. Duangkumpha K, Stoll T, Phetcharaburanin J, et al. Discovery and qualification of serum protein biomarker candidates for cholangiocarcinoma diagnosis. J Proteome Res. 2019;18(9):3305–3316. doi:10.1021/acs.jproteome.9b00242
10. Achkar JM, Cortes L, Croteau P, et al. Host protein biomarkers identify active tuberculosis in HIV uninfected and co-infected individuals. EBioMedicine. 2015;2(9):1160–1168. doi:10.1016/j.ebiom.2015.07.039
11. Xu DD, Deng DF, Li X, et al. Discovery and identification of serum potential biomarkers for pulmonary tuberculosis using iTRAQ-coupled two-dimensional LC-MS/MS. Proteomics. 2014;14(2–3):322–331. doi:10.1002/pmic.201300383
12. Chen C, Yan T, Liu L, Wang J, Jin Q. Identification of a novel serum biomarker for tuberculosis infection in Chinese HIV patients by iTRAQ-based quantitative proteomics. Front Microbiol. 2018;9:330. doi:10.3389/fmicb.2018.00330
13. Jayakumar A, Vittinghoff E, Segal MR, et al. Serum biomarkers of treatment response within a randomized clinical trial for pulmonary tuberculosis. Tuberculosis (Edinb). 2015;95(4):415–420. doi:10.1016/j.tube.2015.04.011
14. Johnson JL, Geldenhuys H, Thiel BA, et al. Effect of isoniazid therapy for latent TB infection on QuantiFERON-TB gold in-tube responses in adults with positive tuberculin skin test results in a high TB Incidence area. Chest. 2014;145(3):612–617. doi:10.1378/chest.13-1232
15. Ludwig C, Gillet L, Rosenberger G, Amon S, Collins BC, Aebersold R. Data-independent acquisition-based SWATH-MS for quantitative proteomics: a tutorial. Mol Syst Biol. 2018;14(8):e8126. doi:10.15252/msb.20178126
16. Conesa A, Gotz S, Garcia-Gomez JM, Terol J, Talon M, Robles M. Blast2GO: a universal tool for annotation, visualization and analysis in functional genomics research. Bioinformatics. 2005;21(18):3674–3676. doi:10.1093/bioinformatics/bti610
17. Moriya Y, Itoh M, Okuda S, Yoshizawa AC, Kanehisa M. KAAS: an automatic genome annotation and pathway reconstruction server. Nucleic Acids Res. 2007;35(WebServer issue):W182–W185. doi:10.1093/nar/gkm321
18. Lange C, Chesov D, Heyckendorf J, Leung CC, Udwadia Z, Dheda K. Drug-resistant tuberculosis: an update on disease burden, diagnosis and treatment. Respirology. 2018;23(7):656–673. doi:10.1111/resp.13304
19. Hu A, Noble WS, Wolf-Yadlin A. Technical advances in proteomics: new developments in data-independent acquisition. F1000Res. 2016;5:419. doi:10.12688/f1000research.7042.1
20. Bruderer R, Bernhardt OM, Gandhi T, et al. Optimization of experimental parameters in data-independent mass spectrometry significantly increases depth and reproducibility of results. Mol Cell Proteomics. 2017;16(12):2296–2309. doi:10.1074/mcp.RA117.000314
21. Liu Y, Huttenhain R, Collins B, Aebersold R. Mass spectrometric protein maps for biomarker discovery and clinical research. Expert Rev Mol Diagn. 2013;13(8):811–825. doi:10.1586/14737159.2013.845089
22. Carlyle BC, Trombetta BA, Arnold SE. Proteomic approaches for the discovery of biofluid biomarkers of neurodegenerative dementias. Proteomes. 2018;6(3):32. doi:10.3390/proteomes6030032
23. Tong L, Tergaonkar V. Rho protein GTPases and their interactions with NFkappaB: crossroads of inflammation and matrix biology. Biosci Rep. 2014;34(3). doi:10.1042/BSR20140021
24. Zanoni I, Granucci F. Role of CD14 in host protection against infections and in metabolism regulation. Front Cell Infect Microbiol. 2013;3:32. doi:10.3389/fcimb.2013.00032
25. Rosas-Taraco AG, Revol A, Salinas-Carmona MC, Rendon A, Caballero-Olin G, Arce-Mendoza AY. CD14 C(−159)T polymorphism is a risk factor for development of pulmonary tuberculosis. J Infect Dis. 2007;196(11):1698–1706. doi:10.1086/522147
26. Lawn SD, Labeta MO, Arias M, Acheampong JW, Griffin GE. Elevated serum concentrations of soluble CD14 in HIV- and HIV+ patients with tuberculosis in Africa: prolonged elevation during anti-tuberculosis treatment. Clin Exp Immunol. 2000;120(3):483–487. doi:10.1046/j.1365-2249.2000.01246.x
27. Wieland CW, van der Windt GJ, Wiersinga WJ, Florquin S, van der Poll T. CD14 contributes to pulmonary inflammation and mortality during murine tuberculosis. Immunology. 2008;125(2):272–279. doi:10.1111/j.1365-2567.2008.02840.x
28. Heung LJ, Luberto C, Del Poeta M. Role of sphingolipids in microbial pathogenesis. Infect Immun. 2006;74(1):28–39. doi:10.1128/IAI.74.1.28-39.2006
29. Niekamp P, Guzman G, Leier H, et al. Sphingomyelin biosynthesis is critical in organizing phosphoinositide turnover during phagocytic uptake of Mycobacterium tuberculosis. bioRxiv. 2019;565226.
30. Cruz D, Watson AD, Miller CS, et al. Host-derived oxidized phospholipids and HDL regulate innate immunity in human leprosy. J Clin Invest. 2008;118(8):2917–2928. doi:10.1172/JCI34189
31. Ramakrishnan K, Shenbagarathai R, Kavitha K, Thirumalaikolundusubramanian P, Rathinasabapati R. Selenium levels in persons with HIV/tuberculosis in India, Madurai City. Clin Lab. 2012;58(1–2):165–168.
32. Grobler L, Nagpal S, Sudarsanam TD, Sinclair D. Nutritional supplements for people being treated for active tuberculosis. Cochrane Database Syst Rev. 2016;6.
33. Lee J, Geddes K, Streutker C, Philpott DJ, Girardin SE. Role of mouse peptidoglycan recognition protein PGLYRP2 in the innate immune response to Salmonella enterica serovar Typhimurium infection in vivo. Infect Immun. 2012;80(8):2645–2654. doi:10.1128/IAI.00168-12
34. Shi L, Jiang Q, Bushkin Y, Subbian S, Tyagi S, Garsin DA. Biphasic dynamics of macrophage immunometabolism during Mycobacterium tuberculosis Infection. MBio. 2019;10(2):2. doi:10.1128/mBio.02550-18
 © 2020 The Author(s). This work is published and licensed by Dove Medical Press Limited. The full terms of this license are available at https://www.dovepress.com/terms.php and incorporate the Creative Commons Attribution - Non Commercial (unported, v3.0) License.
By accessing the work you hereby accept the Terms. Non-commercial uses of the work are permitted without any further permission from Dove Medical Press Limited, provided the work is properly attributed. For permission for commercial use of this work, please see paragraphs 4.2 and 5 of our Terms.
© 2020 The Author(s). This work is published and licensed by Dove Medical Press Limited. The full terms of this license are available at https://www.dovepress.com/terms.php and incorporate the Creative Commons Attribution - Non Commercial (unported, v3.0) License.
By accessing the work you hereby accept the Terms. Non-commercial uses of the work are permitted without any further permission from Dove Medical Press Limited, provided the work is properly attributed. For permission for commercial use of this work, please see paragraphs 4.2 and 5 of our Terms.