")
Back to Journals » Drug Design, Development and Therapy » Volume 8
Discovery of potential drugs for human-infecting H7N9 virus containing R294K mutation
Authors He J, Li C, Wu G, Bao J, Li J, Feng Y
Received 10 September 2014
Accepted for publication 23 October 2014
Published 1 December 2014 Volume 2014:8 Pages 2377—2390
DOI https://doi.org/10.2147/DDDT.S74061
Checked for plagiarism Yes
Review by Single anonymous peer review
Peer reviewer comments 5
Editor who approved publication: Professor Shu-Feng Zhou
Jiao-Yu He,1,* Cheng Li,2,* Guo Wu3
1College of Life Sciences and Key Laboratory for Bio-resources of Ministry of Education, Sichuan University, 2College of Agronomy, Sichuan Agricultural University, 3College of Life Sciences, Sichuan Normal University, Chengdu, People’s Republic of China
*These authors contributed equally to this work
Background: After the first epidemic wave from February through May 2013, the influenza A (H7N9) virus emerged and has followed a second epidemic wave since June 2013. As of June 27, 2014, the outbreak of H7N9 had caused 450 confirmed cases of human infection, with 165 deaths included. The case-fatality rate of all confirmed cases is about 36%, making the H7N9 virus a significant threat to people’s health. At present, neuraminidase inhibitors are the only licensed antiviral medications available to treat H7N9 infections in humans. Oseltamivir is the most commonly used inhibitor, and it is also a front-line drug for the threatening H7N9. Unfortunately, it has been reported that patients treated with oseltamivir can induce R294K (Arg294Lys) substitution in the H7N9 virus, which is a rare mutation and can reduce the antiviral efficacy of inhibitors. Even worse, deaths caused by such mutation after oseltamivir treatment have already been reported, indicating that the need to find substitutive neuraminidase inhibitors for currently available drugs to treat drug-resistant H7N9 is really pressing.
Materials and methods: First, the structure of H7N9 containing the R294K substitution was downloaded from the Protein Data Bank, and structural information of approved drugs was downloaded from the ZINC (ZINC Is Not Commercial) database. Taking oseltamivir carboxylate as a reference drug, we then filtered these molecules through virtual screening to find out potential inhibitors targeting the mutated H7N9 virus. For further evaluation, we carried out a 14 ns molecular dynamic simulation for each H7N9–drug complex and calculated the binding energy for each candidate drug.
Results: We found five inhibitors that could be candidate drugs for treating the mutated H7N9 virus. Docking poses showed these drugs could bind to the virus effectively, with the contribution of hydrogen bonds and hydrophobic interactions. With regard to the molecular dynamic simulations, receptor–ligand complexes formed by these candidate drugs were more stable than the one formed by oseltamivir carboxylate. The binding energy of oseltamivir carboxylate was -122.4 kJ/mol, while those for these potential inhibitors were -417.5, -404.7, -372.2, -304.3, and -289.9 kJ/mol, much better than the reference drug.
Conclusion: Given the current and future threat of the mutated H7N9 virus, it is urgent that potent drugs and effective antiviral therapeutics be found. Our study therefore is able to complement currently available drugs for influenza A infectors and helps to prevent the ongoing threat of H7N9 virus.
Keywords: H7N9, neuraminidase, mutation, virtual screening, inhibitor
Introduction
Following the first epidemic wave (n=133) of influenza A (H7N9) infection from February to May 2013, the second epidemic wave has been occurring since June 2013.1 As of June 27, 2014, both epidemic waves had caused a total of 450 laboratory-confirmed human infections, including 165 deaths.1 Since then, to September 4, another two laboratory-confirmed cases including one death had been reported in the newly issued World Health Organization (WHO) outbreak news.2 Apart from reported infections from mainland People’s Republic of China, the WHO has also received reports from Hong Kong, Taiwan, and Malaysia. Infected patients present with fever at the beginning, and rapidly develop to progressive pneumonia, which then leads to acute respiratory distress syndrome and multiorgan failure, such as impaired liver or renal function.3 The case-fatality rate of H7N9 infection seems to be roughly 36%, threatening the whole world.
Influenza A viruses are divided into subtypes based on two surface glycoproteins – hemagglutinin (HA) and neuraminidase (NA) – and there are 18 different HA subtypes and eleven different NA subtypes.4 For the H7N9 virus, the designation of “H7N9” identifies it as having HA of the H7 subtype and NA of the N9 subtype.5 HA binds to the sialic acid-containing receptor on the host cell and facilitates the initial viral fusion.6 NA cleaves the terminal linkage of the cell-receptor sialic acid, resulting in the release of newly formed progeny virions from the infected cells.7 The NA-induced cleavage releases new viruses that can infect new cells. Without NA, the influenza A virus would be limited to one round of replication in the human body, rarely sufficient to cause new cases of infection.8 Therefore, as an essential enzyme presented on the surface of the virus, NA has been widely used as an ideal target for anti-influenza drugs.9
The WHO has recommended anti-NA inhibitors as the only class of antivirals for prophylaxis of influenza A and B infections since 2010.10 Accordingly, four inhibitors – oseltamivir, zanamivir, peramivir, and laninamivir – are currently approved for treatment in various countries.11–13 H7N9 viruses have been found to be sensitive to these drugs, which are effective in reducing severe illness and deaths.14,15 To date, oseltamivir is regarded as a first-line drug and is widely used for treatment, due to its potency and high bioavailability.14 However, drug-resistant H7N9 strains have emerged owing to the fast evolution of the virus. Some clinical cases of H7N9 infection treated with oseltamivir have induced an NA-carrying R294(292)K substitution (Arg294Lys, hereafter referred to as “N9_R294K”).14,16 The mutation is known to confer resistance to multiple NA inhibitors in N9 subtype viruses, leading to deaths and great concern in the public.16–18
In order to find antiviral inhibitors efficiently targeting N9_R294K of H7N9, we used the three-dimensional crystal structure of N9_R294K, solved by Wu et al.14 We first downloaded commercially available approved drugs from the ZINC (ZINC Is Not Commercial) database. Subsequently, we performed virtual screening to filter these molecules to seek candidate drugs. Finally, we implemented molecular dynamic (MD) simulation and binding-energy calculation to evaluate these selected compounds for the discovery of promising anti-N9_R294K inhibitors for the H7N9 virus.
Materials and methods
Data preparation
The crystal structure of N9_R294K in complex with oseltamivir carboxylate was downloaded from the Research Collaboratory for Structural Bioinformatics Protein Data Bank (PDB; code 4MWW), and residues of the N9 protein were numbered according to the 4MWW numbering.14,19 The Chimera system was then used for preparing the receptor (N9_R294K) and oseltamivir carboxylate for the following docking process.20
ZINC is a free database of commercially available compounds for virtual screening, and the ZINC Drug Database is a ready-to-download special subset containing all drugs that have been approved for use in humans worldwide in ready-to-dock, three-dimensional format.21 Last updated on February 23, 2013, the ZINC Drug Database contains 2,924 small molecule drugs, which were downloaded on February 22, 2014 for screening in our study.
Molecular docking and virtual screening
The virtual screening strategy is intended to efficiently and reliably find potential drugs in a database containing a large number of molecules. Taking the cocrystallized oseltamivir carboxylate within the 4MWW structure as a reference drug, we implemented virtual screening via UCSF DOCK (version 6.5).22 The molecular surface of the target was generated with a probe radius of 1.0 Å. Spheres that ligand atoms would occupy were then generated. The maximum sphere radius was 3.0 Å, and the minimum sphere radius was 1.0 Å. Subset spheres representing the binding site for N9_R294K were identified by the location of cocrystallized oseltamivir carboxylate, within 5.0 Å of root-mean-square deviation (RMSD) from every atom of the crystal structure of oseltamivir carboxylate. Afterward, a grid box enclosing 1.0 Å extra margin in all six directions was defined. To create necessary grid files for rapid score evaluation in DOCK, the grid-based energy-scoring function was used to calculate molecular mechanic interaction energies (van der Waals and electrostatic energy) to complete energy and bump calculations. The docking process comprised two steps: a ligand-flexible docking with grid-based scoring, and a bilaterally flexible docking with Assisted Model Building with Energy Refinement (AMBER) scoring function. The first case allows the ligand to be flexible, while in the second case both the ligand and the active site(s) of the receptor can be flexible.
MD simulation
MD simulation provides dynamic and atomic insights for the understanding of complicated protein–ligand system during a specific period of time.23,24 All the MD simulations in our study were carried out with the Gromacs 4.5 package.25 With the TIP3P water model and AMBER99sb force field,26,27 coordinates and topology files of receptor proteins were generated. Ligand topology was created by Acpype based on the AMBERff99sb force field.28,29 Then, we constructed the system topology and reconstructed our protein–ligand complex by editing these topology files of proteins and ligands. We defined a rhombic dodecahedron box filled with simple-point-charge water molecules by setting a minimal distance of 1.0 between the solute and the box.30 To neutralize the system, we added Na+ and Cl− to specify the salt concentration as 0.15 mol/L.
Before the simulation is run, it must be established that the solvated, electroneutral system has no steric clashes or inappropriate geometry. We relaxed the system through a process called energy minimization using steepest-descent minimization algorithm for all atoms so that the maximum force was no greater than 1,000 kJ/mol/nm. In order to start real dynamics simulation, we equilibrated the ions and solvent around the protein with two-phase equilibration. The first phase was conducted under an NVT (constant number of particles, volume, and temperature) ensemble within 100 ps (picosecond, or 10−12 of a second) to stabilize the temperature of the system at 300 K. The second 100 ps NPT (constant number of particles, pressure, and temperature) equilibration used a coupling reference pressure of 1 bar to stabilize the system. Upon the completion of the two-step equilibration, the system was well equilibrated at the desired temperature and pressure. Then, we ran a 14 ns (nanosecond, or 10−9 of a second) MD simulation with a time step of 2 fs (femtosecond, or 10−15 of a second). During the simulation, the leapfrog algorithm integrating Newton’s equations of motion was used for pressure control,31 long-range electrostatics were calculated by the particle-mesh Ewald method,32 all bond lengths were constrained by LINCS (Linear Constraint Solver) algorithm,33 and the energy information and trajectory information were collected every 2 ps. When completed, Gromacs utilities and Chimera were used as postprocessing tools for further analysis.
MM-PBSA binding-energy calculation
Combined with MD simulation, binding free-energy calculation methods have become powerful tools in providing quantitative measurement for protein–ligand interactions.34 The molecular mechanics Poisson–Boltzmann surface area (MM-PBSA) method was proposed in the late 1990s, and has grown to be a well-known approach for determining the free energies of molecular systems.35 When this method is used to calculate binding energy (ΔGbind), the free energy is decomposed into contributions from a gas-phase energy (ΔEgas), a solvation free energy (ΔGsolv), and an entropy term (TΔS), as represented in the following equation:36
ΔGbind = ΔEgas + ΔGsolv - TΔS | (1) |
where the gas-phase contribution, ΔEgas, is written as the sum of both bonded terms, such as bond, angle, and torsion energies, as well as nonbonded terms, such as van der Waals and electrostatic interactions. The complete gas-phase force-field energy denotes the MM part of the MM-PBSA method. The “ΔGsolv” term contains polar solvation and nonpolar solvation energies, which represents the PBSA part, and is estimated using an implicit solvent model in the MM-PBSA approach. The polar solvation energy is calculated by solving the PB equation, while the nonpolar solvation energy is usually computed by the solvent-accessible surface area (SASA) model, the most commonly used nonpolar model, where SASA is linearly dependent on the nonpolar term.
In this study, a Gromacs tool named g_mmpbsa was used to calculate the binding free energy of protein–ligand complexes from MD trajectories.37 This tool implements the MM-PBSA approach by using subroutines derived from Gromacs and Adaptive Poisson–Boltzmann Solver packages without run-time dependency on external software, and is suitable for binding-energy calculations on molecular systems because its performance is comparable to the AMBER package.37,38 Of note, g_mmpbsa only calculates the electrostatic and van der Waals components of gas-phase energy, as the bonded contribution is by definition zero in the single-trajectory approach.35 Besides, the entropy term is not evaluated yet, as it has become common practice in recent work to exclude the entropy term from MM-PBSA calculation.39 Therefore, binding energy is calculated as follows:
ΔGbind = ΔEMM + ΔGpolar + ΔGnonpolar | (2) |
where ΔEMM represents the gas-phase energy consisting of electrostatic and van der Waals interaction, ΔGpolar denotes polar solvation energy, and ΔGnonpolar is nonpolar solvation energy.
Subsequently, the energy components ΔEMM, ΔGpolar, and ΔGnonpolar of each complex were calculated for eleven snapshots extracted every 0.2 ns from the production trajectory from 8 to 10 ns. Other parameters used by g_mmpbsa for the free-energy calculation were set based on those described in the developers’ publication.37
Results
Performance of docking
Before molecular docking, it is necessary to validate the rationality of parameters specified for docking accuracy.40 Redocking a cocrystallized ligand back into the target’s active site is the most straightforward metric to evaluate the performance of docking.41 It is reasonable if the RMSD between the docked conformation and the experimental ligand orientation is less than 2.0 Å.42,43
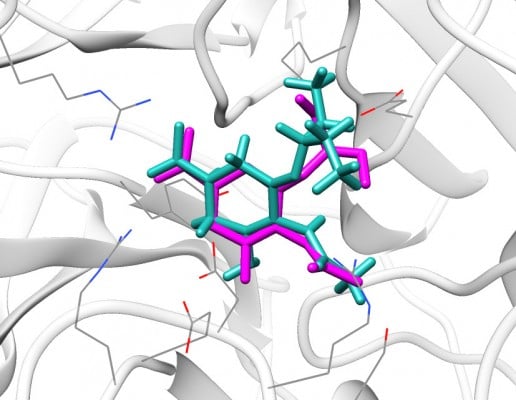
We redocked the cocrystallized oseltamivir carboxylate into the 4MWW structure, and the heavy atom RMSD between the docked orientation and the crystallized conformation was 1.73 Å, indicating parameters specified in DOCK were reliable and could successfully dock the ligand back into the binding pocket of N9_R294K. As shown in Figure 1, the redocked pose of oseltamivir carboxylate almost entirely overlapped with its crystallographic orientation, suggesting it was correctly placed in the binding pocket.
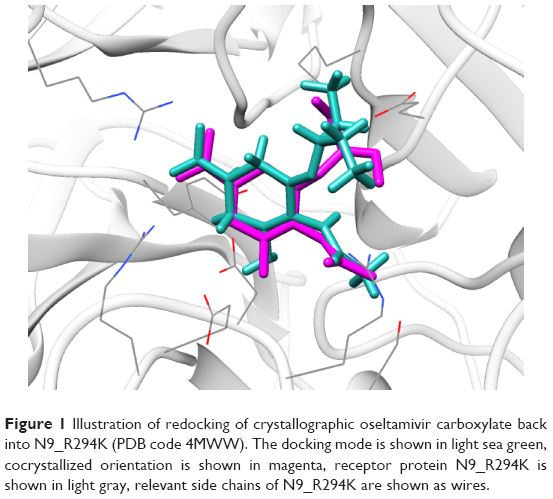 | Figure 1 Illustration of redocking of crystallographic oseltamivir carboxylate back into N9_R294K (PDB code 4MWW). The docking mode is shown in light sea green, cocrystallized orientation is shown in magenta, receptor protein N9_R294K is shown in light gray, relevant side chains of N9_R294K are shown as wires. |
In addition to redocking, we also evaluated our computational approach by experimental half-maximal inhibitory concentration (IC50) values of four currently used drugs (oseltamivir, zanamivir, peramivir, and laninamivir).44 We first docked these drugs to N9_R294K. These drugs were then docked to the NA of nonmutated H7N9 (hereafter referred to as “N9_R294”). Finally, the correlation coefficients (R) for docking to N9_R294K and docking to N9_R294 were calculated, which represented the correlation between docking scores and experimental IC50 values.
Results suggested either docking to N9_R294K or N9_R294: the better the IC50 value, the better the AMBER score (Table 1). R=0.9 for both mutated and nonmutated H7N9 indicated that the docking score was positively related to the experimental IC50. Therefore, the docking approach used in our study proved to be dependable, and provided a convincing basis to use DOCK to carry out docking projects.
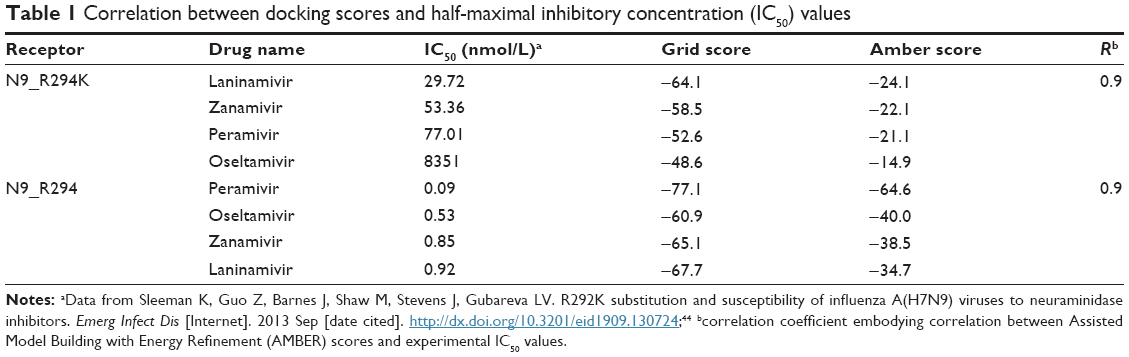 | Table 1 Correlation between docking scores and half-maximal inhibitory concentration (IC50) values |
Potential drugs for the mutated H7N9 virus
After docking the reference drug, oseltamivir carboxylate, back into the binding pocket of N9_R294K, we got the threshold grid score (−48.6) and AMBER score (−14.9) from it. Based on the cutoff, five of 2,924 drugs were selected as potential inhibitors for mutated H7N9 (Table 2). Zanamivir had the best grid score (−58.5), while aspartame (−52.1), L-arginine (−51.2), benserazide hydrochloride (−50.5), and D-arginine (−50.2) got relatively better grid scores than the reference drug. As for the AMBER score, L-arginine (−34.9) was the best and more than twice as good as oseltamivir carboxylate (−14.9). Aspartame was second best and D-arginine followed, with AMBER scores of −30.6 and −25.3, respectively. Zanamivir (−22.1) and benserazide hydrochloride (−20.1), with a slightly better score than −14.9, came after the first three drugs.
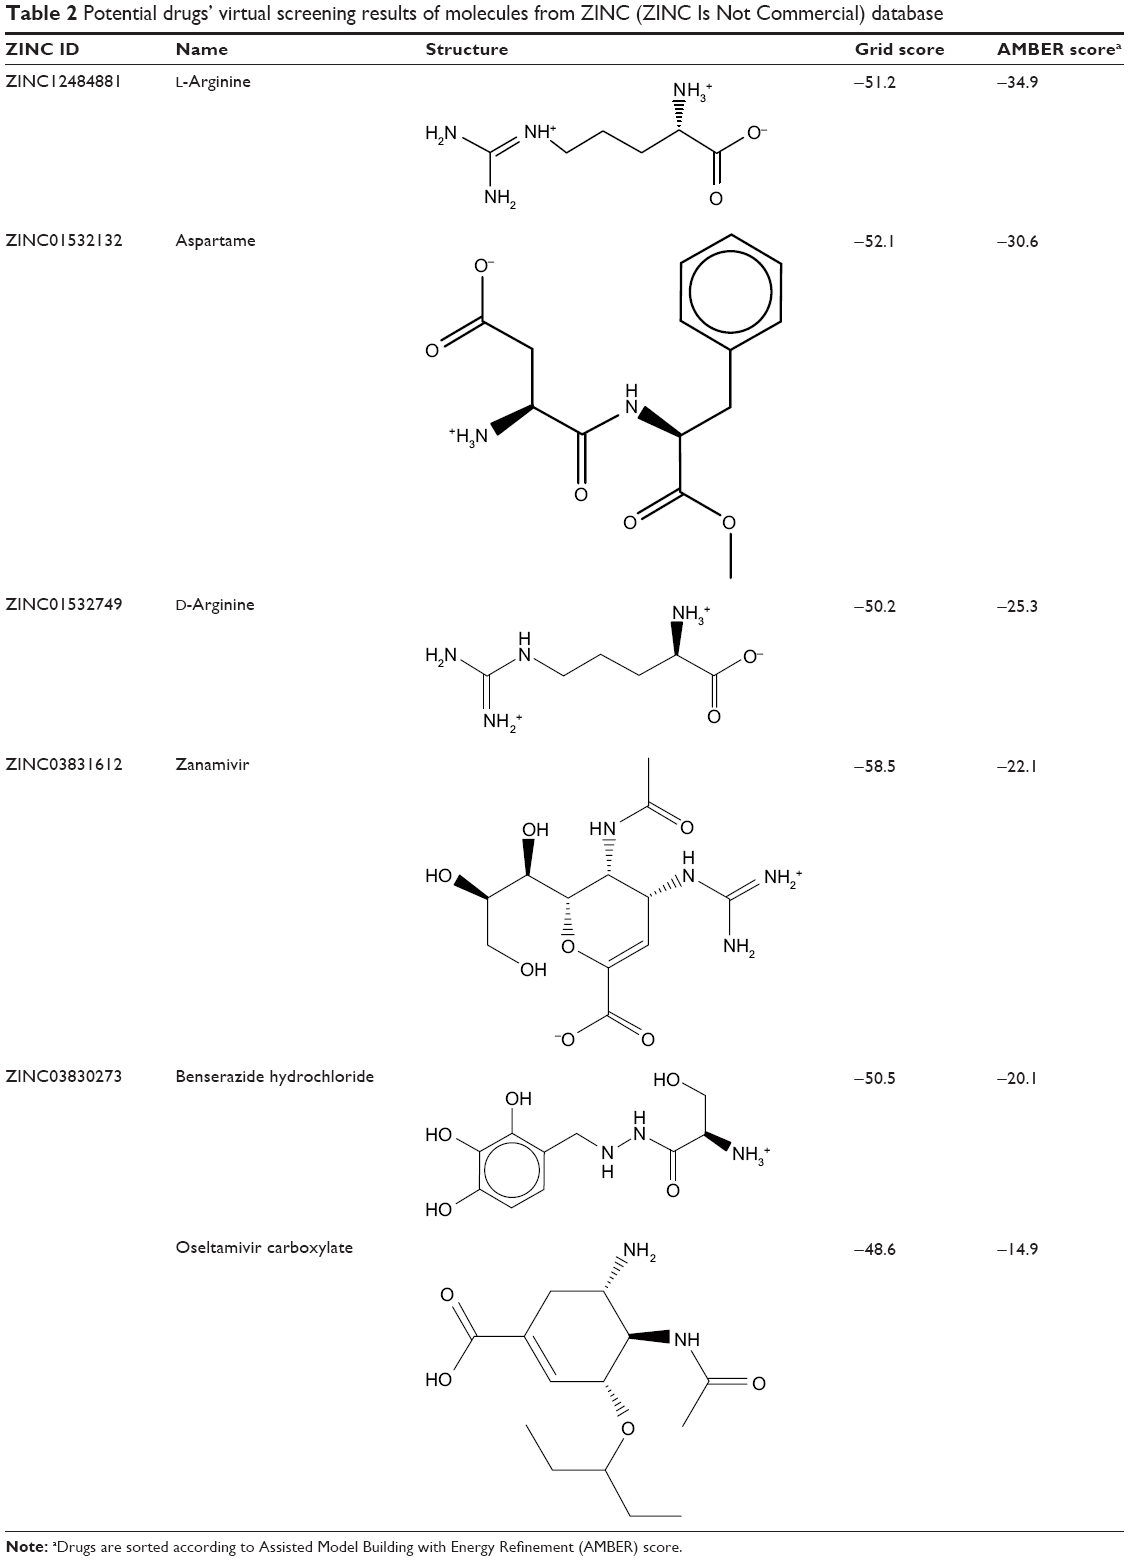 | Table 2 Potential drugs’ virtual screening results of molecules from ZINC (ZINC Is Not Commercial) database |
Interaction between N9_R294K and potential drugs
Figure 2 gives information about binding modes for all N9_R294K–inhibitor interactions. We can see from Figure 2A that similar to the reference drug (oseltamivir carboxylate), all five candidate inhibitors were docked into the binding pocket of N9_R294K.
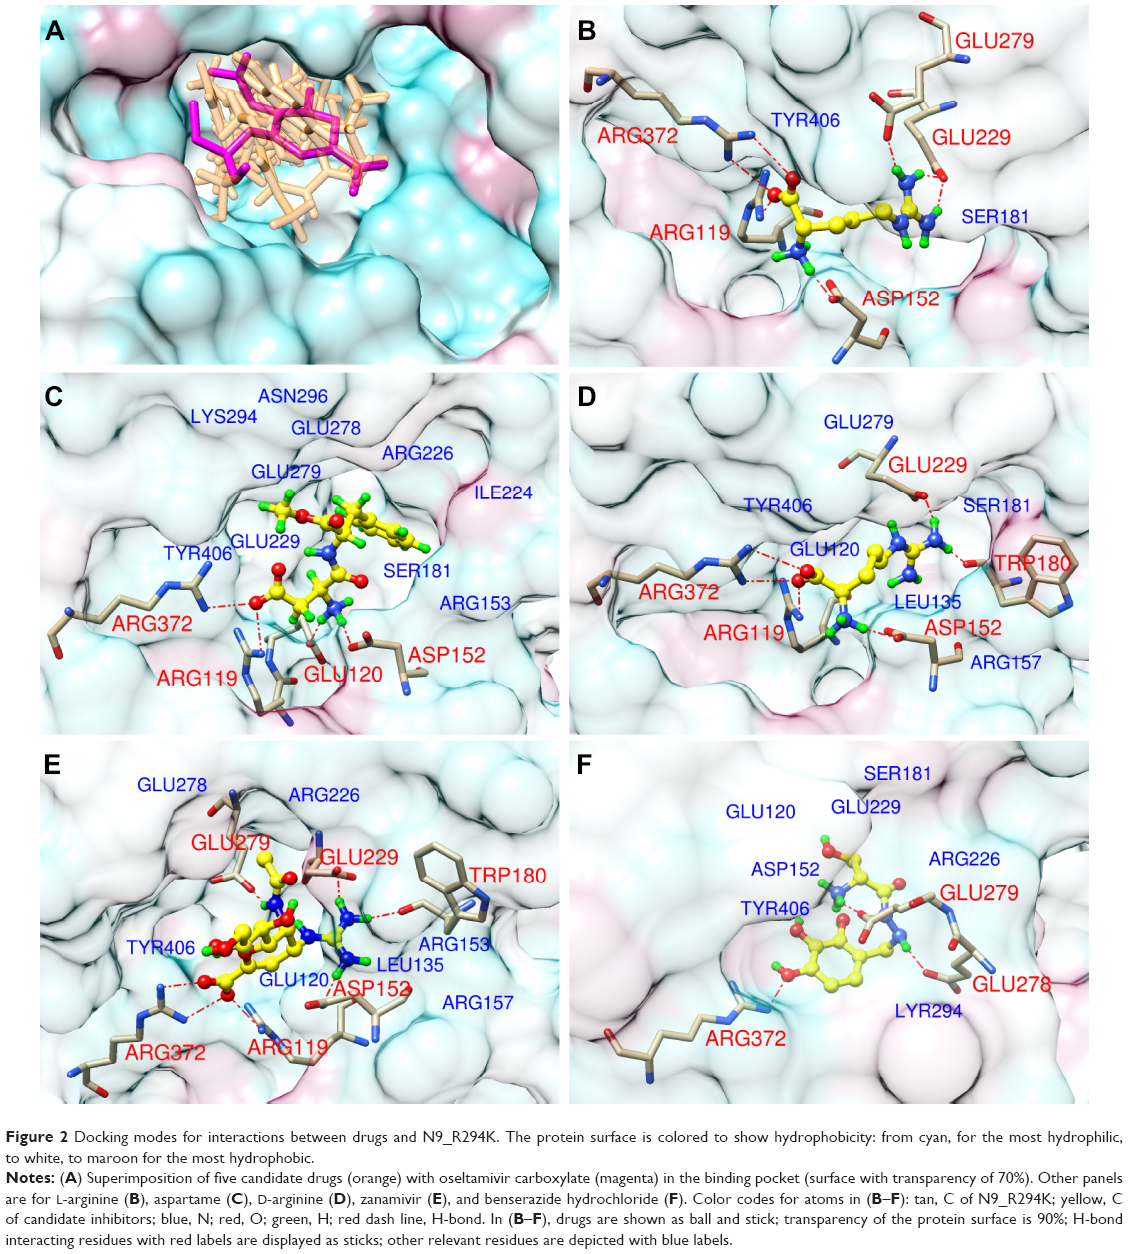 | Figure 2 Docking modes for interactions between drugs and N9_R294K. The protein surface is colored to show hydrophobicity: from cyan, for the most hydrophilic, to white, to maroon for the most hydrophobic. |
L-Arginine bound to the mutated N9 and formed seven hydrogen bonds (H-bonds), as illustrated in Figure 2B. The carboxyl group was placed toward residues Arg119 and Arg372 at the catalytic site, forming one and two H-bonds with each of the two residues. On the other side of the carbon chain opposite the carboxyl group, the guanidino group interacted with the framework residues (Glu229 and Glu279) via three H-bonds. Besides, the azyl near the carboxyl group formed another H-bond with Asp152.
For aspartame in Figure 2C, it formed four H-bonds with N9_R294K in the binding interaction. A bidentate H-bond interaction was formed between the carboxyl group and the side chains of residues Arg119 and Arg372. The ammonium formed another two H-bonds with Glu120 and Asp152. The bulky phenyl stretched into the deep pocket enclosed by Tyr406, Glu229, Glu279, Glu278, Arg226, Ile224, Ser181, and Arg153, helping to stabilize the binding interaction.
D-Arginine and L-arginine are two chiral molecules, but had a similar binding model when targeting N9_R294K (Figure 2D). This was represented by six H-bonds in total. Like L-arginine, the carboxyl group and adjacent ammonium of D-arginine formed four H-bonds with residues Arg372, Arg119, and Asp152 in the same way. However, its guanidino group did not form any H-bond with Glu279. Instead, the guanidino group formed two H-bonds with Glu229 and Trp180.
With regard to zanamivir (Figure 2E), seven H-bonds contributed to the N9_R294K–zanamivir interaction, which was the same H-bond number of L-arginine. The carboxyl group formed three H-bonds: two with Arg372 and one with Arg119. Another three azyls were observed to engage the H-bond network with residues Glu279, Glu229, Trp180, and Asp152, forming four H-bonds.
The H-bond interaction between benserazide hydrochloride and N9_R294K was slightly weaker than the other four candidate drugs, with the formation of only three H-bonds toward the N9 protein, as demonstrated in Figure 2F. Within the binding pocket, the hydroxyl formed one H-bond with Arg372. Another two H-bonds were represented by azyl and ammonium, with each forming one H-bond with two consecutive residues – Glu278 and Glu279.
Binding stability
RMSD is an important and straightforward index to evaluate the stability of a protein–ligand system from MD simulation. Equilibrated RMSD with lower value indicates the system is more stable, and vice versa.45 According to Figure 3, the RMSD of all five N9_R294K–inhibitor complexes acquired good equilibrium during the 14 ns MD simulation. For the RMSD of the reference drug oseltamivir carboxylate, it started at 0.05 nm and then experienced a remarkable fluctuation, rising to 0.1 nm at around 3 ns. From then onward, it leveled off at this figure over the following 4 ns. After that, it plunged first at 7 ns and then soared to marginally exceed 0.1 nm by 8 ns. Finally, it remained stable at this level till the end of the simulation.
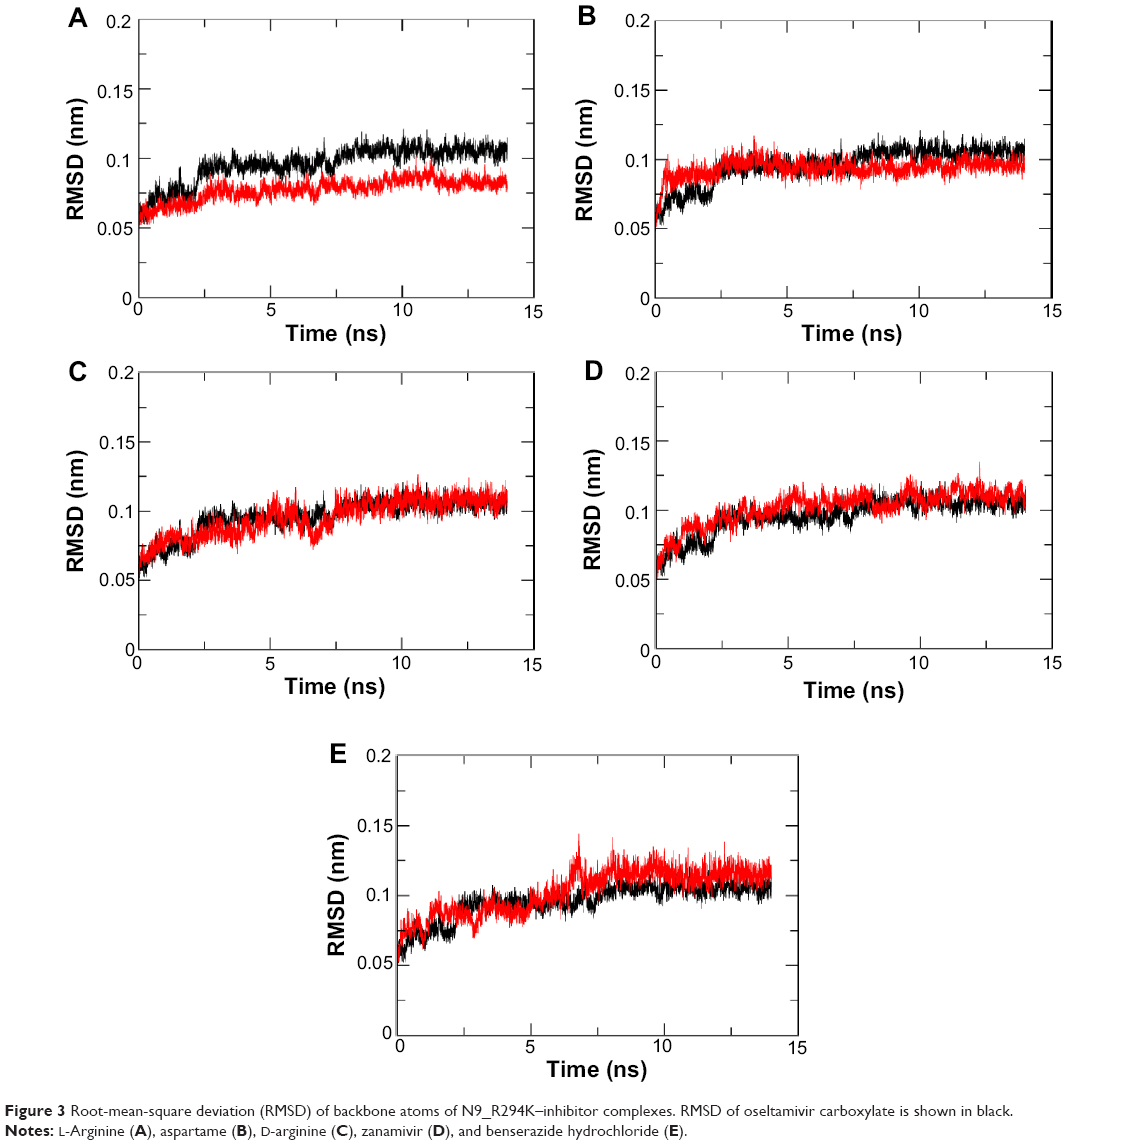 | Figure 3 Root-mean-square deviation (RMSD) of backbone atoms of N9_R294K–inhibitor complexes. RMSD of oseltamivir carboxylate is shown in black. |
It is clear in Figure 3A that the RMSD of the L-arginine system reached the platform earlier than oseltamivir carboxylate at 3 ns and then remained stable throughout the simulation process. What is more, the RMSD value of L-arginine was obviously smaller than the reference drug. In Figure 3B, the RMSD of the N9_R294K–aspartame complex got a stable value of 0.1 nm after a short fluctuation by 3 ns. It equilibrated well, and the RMSD value was relatively smaller than oseltamivir carboxylate. The RMSD of the D-arginine system was similar to the N9_R294K–oseltamivir carboxylate complex (Figure 3C). It fluctuated slightly for 8 ns between 0.05 nm and 0.1 nm, and then remained stable at 0.1 nm for the last 6 ns. As can be seen from Figure 3D, the RMSD of the N9_R294K–zanamivir system equilibrated at about 5 ns and remained stable to the end. The RMSD of the benserazide hydrochloride system in Figure 3E was not as good as the other four candidate drugs, because it fluctuated significantly over the first 7 ns, and even though it achieved equilibrium by 8 ns, the RMSD value was slightly higher than that of the reference drug. However, comparison of RMSD between benserazide hydrochloride and oseltamivir carboxylate still indicated that benserazide hydrochloride was comparable to the reference drug.
Binding energy
As listed in Table 3, each candidate N9_R294K inhibitor got a better binding energy than oseltamivir carboxylate (−122.4 kJ/mol). L-Arginine had the lowest energy when binding to N9_R294K: −417.5 kJ/mol. Benserazide hydrochloride (−404.7 kJ/mol) had a higher binding energy than L-arginine. Binding energies of D-arginine and zanamivir were −372.2 and −304.3 kJ/mol, respectively. Aspartame got a binding energy of −289.9 kJ/mol, which was the greatest among these candidate inhibitors.
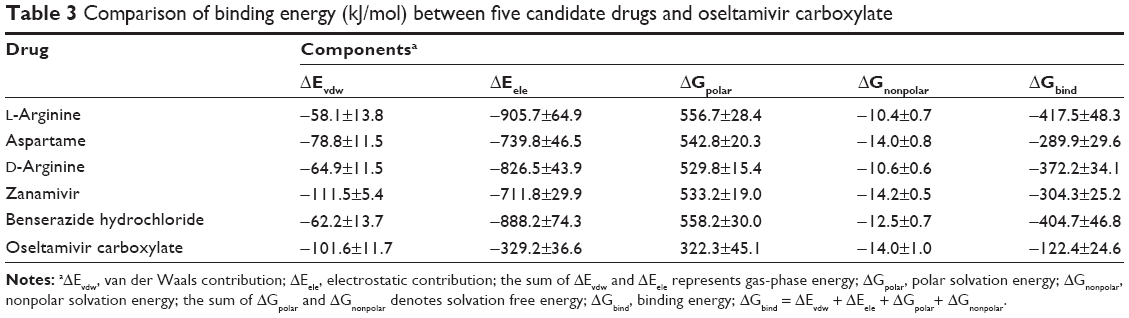 | Table 3 Comparison of binding energy (kJ/mol) between five candidate drugs and oseltamivir carboxylate |
In terms of components making up binding energy, van der Waals energy, electrostatic energy, and SASA energy contributed to the binding interaction, whereas polar solvation energy opposed binding. For oseltamivir carboxylate, its van der Waals energy, electrostatic energy, polar solvation energy, and SASA energy were −101.6, −329.2, 322.3, and −14.0 kJ/mol, respectively. Among the five candidate drugs, they had similar SASA energy (−14.2 to −10.4 kJ/mol) and polar solvation energy (529.8–558.2 kJ/mol) to each other. Electrostatic energies among the five drugs ranged between −905.7 and −711.8 kJ/mol, and van der Waals energy significantly varied from −111.5 to −58.1 kJ/mol.
Gas-phase energy is the sum of van der Waals and electrostatic energies, so its negative favorable value benefited interaction. Even though the nonpolar term was favorable for ligand binding toward the receptor, the contribution was so weak that the much stronger unfavorable polar energy resulted in unfavorable solvation free energy. Owing to stronger gas-phase energy, the binding energy that comes from the sum of gas-phase and solvation free energies eventually got a negative favorable value and contributed to the protein–ligand interaction.
Target nonmutated H7N9 virus
In order to see whether these candidate drugs could successfully bind to N9_R294, we downloaded the structure of N9_R294 from the PDB via code 4MWQ and then performed 10 ns MD simulations for N9_R294–inhibitor complexes.14,19 It can be seen from Figure 4 that the RMSD of the oseltamivir carboxylate system gradually went up to 0.1 nm by 3 ns from 0.05 nm at the beginning. Afterward, it saw a slight fluctuation around 0.1 nm over 5 ns. From 8 ns onward, it leveled off at below 0.1 nm till the end of the simulation.
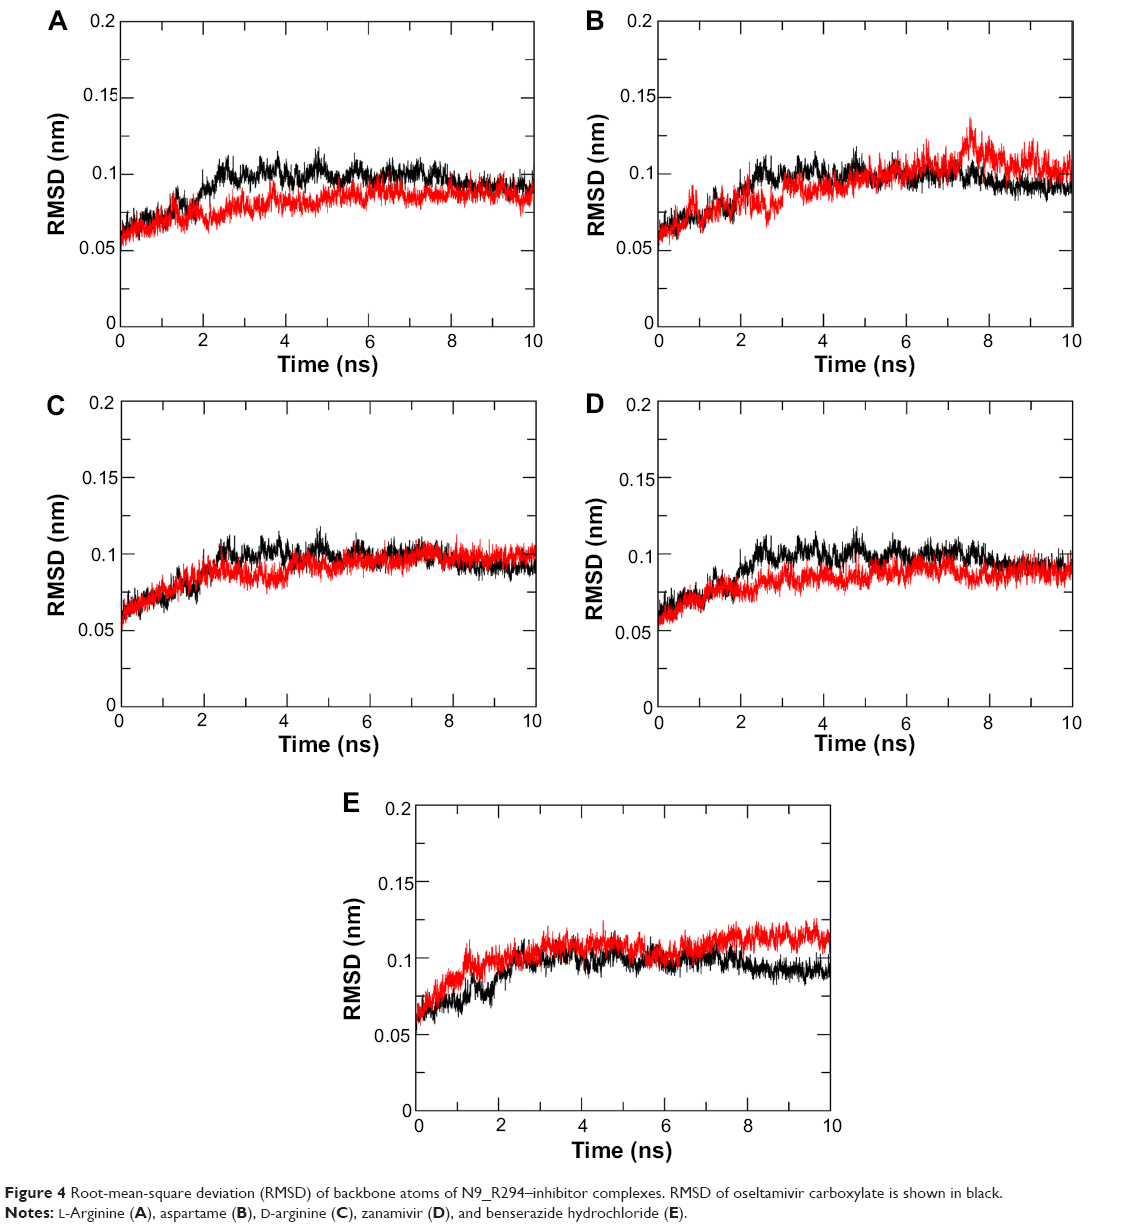 | Figure 4 Root-mean-square deviation (RMSD) of backbone atoms of N9_R294–inhibitor complexes. RMSD of oseltamivir carboxylate is shown in black. |
Compared with the reference drug, the L-arginine system acquired a lower RMSD and equilibrated earlier at 5 ns; the N9_R294–aspartame complex fluctuated to peak at above 0.1 nm at approximately 8 ns, and tended not to get equilibrium around 0.1 nm until 9 ns; the RMSD of the D-arginine system was similar to oseltamivir carboxylate, but equilibrated earlier at around 5 ns; the RMSD of the N9_R294–zanamivir complex was lower and equilibrated earlier at 4 ns; benserazide hydrochloride got a similar RMSD profile over the first 6 ns, while it then experienced an upward trend and remained stable at 8 ns with a higher RMSD than oseltamivir carboxylate.
Discussion
Between N9_R294K and the nonmutated R294-containing N9 structure of H7N9, all active site residues adopt the same typical conformations, except Glu278 and Arg/Lys294.14 In the nonmutated N9, Glu278 forms a salt bridge with Arg226, while N9_R294K acquires a Lys294 that forms a salt bridge with Glu278. This conformational change renders Glu278 unfavorable for the binding of oseltamivir carboxylate, resulting in it being more than 100,000 times less effective against the R294K-containing H7N9 virus.14
Root-mean-square fluctuation (RMSF) is used as a means for assessing flexibility differences between protein residues from MD simulation.46 The RMSF analysis illustrated that each of the five discovered drugs in our study had a different interaction profile from that of oseltamivir carboxylate when binding to N9_R294K (Figure 5). Therefore, the mutated H7N9 virus was speculated to be more susceptible to these potential drugs than the reference oseltamivir carboxylate. For these candidate drugs, their RMSF profiles were similar to oseltamivir carboxylate, but two regions (Thr140–Ile160, Lys275–Thr325) showed significant differences. These drugs interacted with residues within or around region Thr140–Ile160 through H-bond or hydrophobic interactions with Arg119, Asp152, and Glu120, which made this region more stable than oseltamivir carboxylate was able to achieve. In region Lys275–Thr325, these promising drugs showed higher flexibility, indicating it was more stable in the oseltamivir carboxylate complex. In fact, it is known that the formation of a salt bridge between Lys294 and Glu278 within the mutated H7N9 contributes to oseltamivir carboxylate resistance. Therefore, this flexible region implies that the salt bridge becomes unstable when contacting the inhibitor, suggesting the mutated H7N9 virus would be less resistant to these candidate drugs.
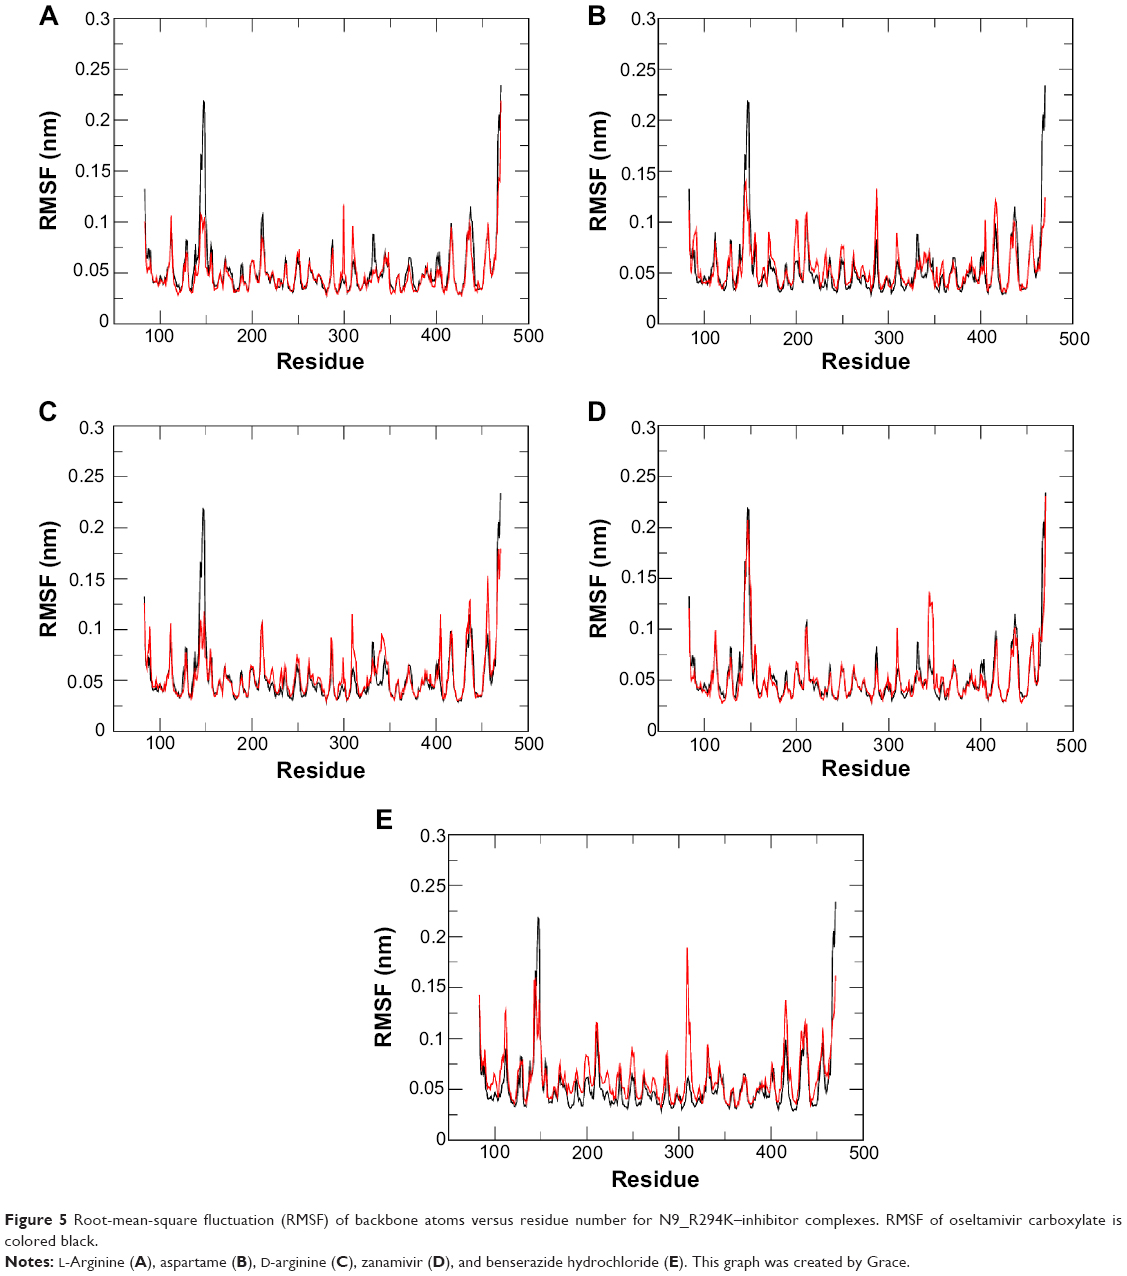 | Figure 5 Root-mean-square fluctuation (RMSF) of backbone atoms versus residue number for N9_R294K–inhibitor complexes. RMSF of oseltamivir carboxylate is colored black. |
Apart from the RMSD analysis, which confirmed the stability of N9_R294K–inhibitor complexes, the number of H-bonds formed between the drugs and N9_R294K during the 14 ns simulations further enhances our findings. As shown in Figure 6, all candidate drugs formed more H-bonds than oseltamivir carboxylate within the simulation process, which dynamically suggested that the H-bond interaction was really strong in each N9_R294K–inhibitor complex.
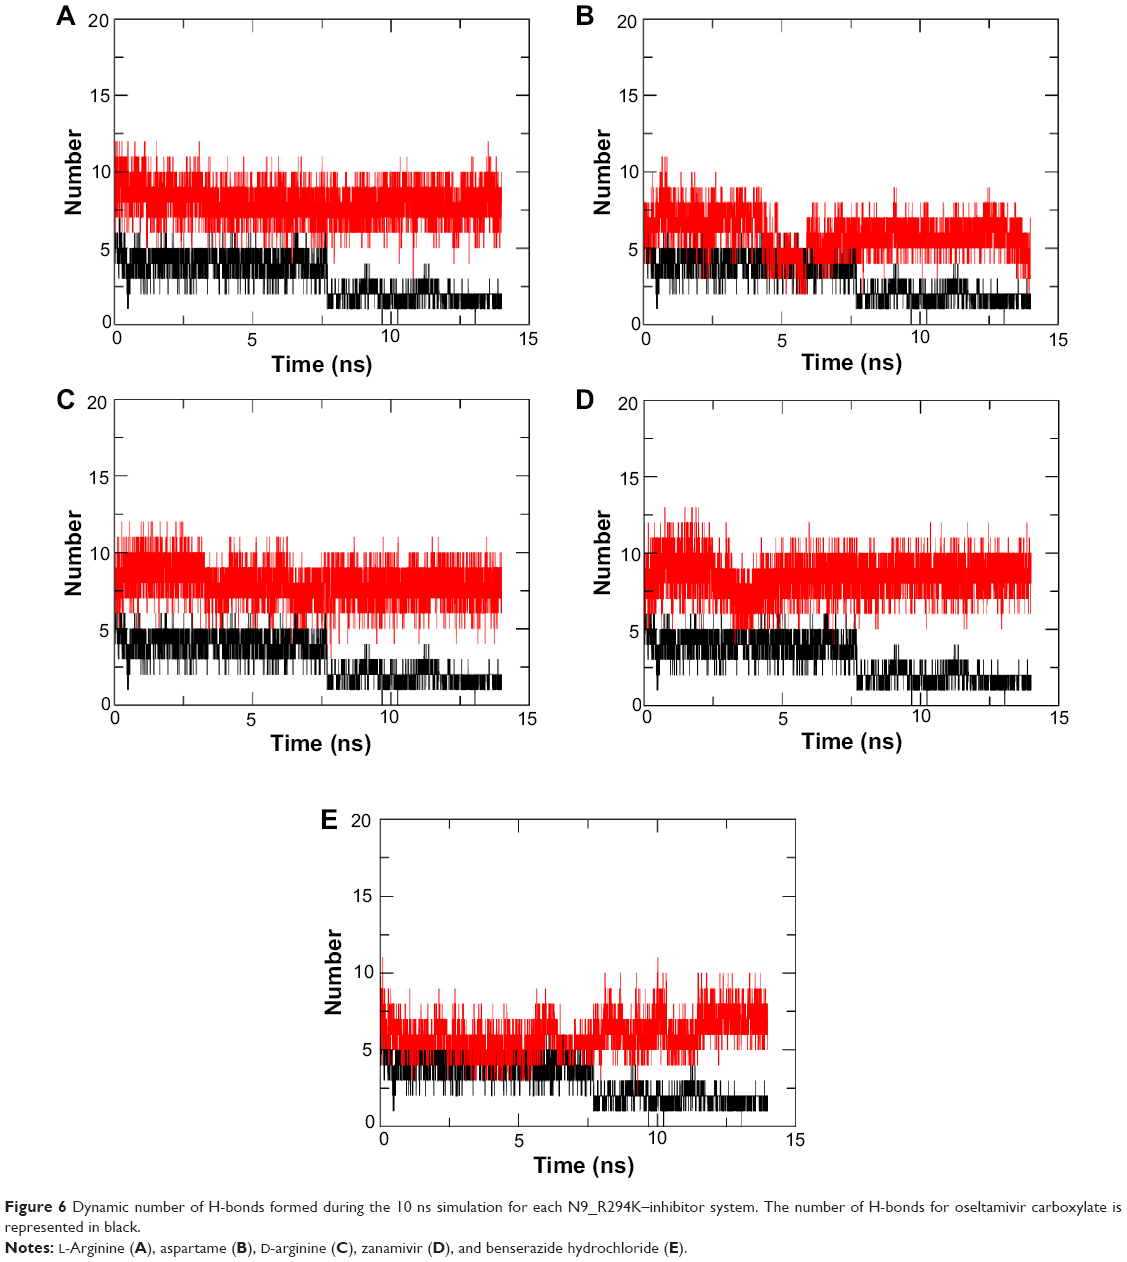 | Figure 6 Dynamic number of H-bonds formed during the 10 ns simulation for each N9_R294K–inhibitor system. The number of H-bonds for oseltamivir carboxylate is represented in black. |
Regarding practical application of these five candidate N9_R294K inhibitors, they are suggestive of a sensible approach for developing potent antiviral drugs against the H7N9 virus with R294K substitution. L-Arginine is a nutraceutical that is used for nutritional supplementation and for treating dietary shortage or imbalance. Besides, L-arginine has also shown improved immune responses to viruses. Aspartame is also a type of functional food used as a diet supplement and sugar substitute. D-Arginine is the d-form apart from the l-form (L-arginine) of arginine. The development of antiviral inhibitors based on D-arginine has already been reported.47 Zanamivir is an anti-influenza drug, and the sensitive H7N9 virus is also susceptible to it, but its inhibitory effect on R294K H7N9 declines. Benserazide hydrochloride is a drug for the treatment of idiopathic Parkinson’s disease and manganese intoxication. As known to all, inventing new drugs is not easy, because it is pricey and time-consuming. Therefore, these existing drugs are worth of saving time and money in discovering novel drugs for H7N9 treatment.
These five potential N9_R294K inhibitors found in this study can be classified into two categories. L-Arginine, aspartame, and D-arginine can be regarded as compounds like amino acids, while zanamivir and benserazide hydrochloride can be designated as amides. Figure 6 also shows that the three amino acid drugs were a bit better than the other two amides. Therefore, it should be better to keep in mind that as oseltamivir carboxylate is also similar to amide, researchers should give priority to amino acids (or derivatives) rather than amides for the future development of N9 inhibitors against the mutated H7N9 virus.
Interestingly, zanamivir was not expected to perform well in Figure 6 because it had been reported with decreased efficiency against mutated H7N9. Now, it is one of our proposed N9_R294K inhibitors, which looks like a paradox. Nevertheless, this should be a precious discovery, because the R294K mutation conferred about a 200-fold efficacy loss to zanamivir.14 Compared with >100,000-fold resistance toward oseltamivir carboxylate, zanamivir is really effective against the N9_R294K virus. This encourages us to make the suggestion for current H7N9 treatment that even though oseltamivir is currently the most widely used clinical drug, it tends to be better to treat patients by combining other NA inhibitors like zanamivir, peramivir, and laninamivir to reduce the possibility of inducing mutations as well as boosting efficacy.
Comparison of binding free energy between wild-type and mutant H7N9 in Table 4 showed that oseltamivir carboxylate in the context of a sensitive H7N9 (−240.3 kJ/mol) was better than in the H7N9 mutant (−122.4 kJ/mol). Like the reference drug, each of the other five candidate inhibitors obtained a better binding energy when interacting with N9_R294, except aspartame, whose binding energy was −289.9 kJ/mol for N9_R294K and −169.5 kJ/mol for N9_R294. These findings indicate that in addition to being better inhibitors targeting N9_R294K, these five candidate drugs possibly effectively target the nonmutated H7N9 virus.
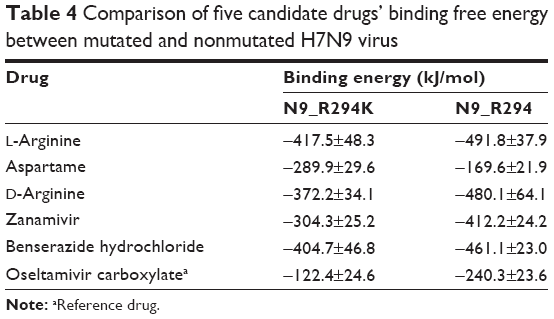 | Table 4 Comparison of five candidate drugs’ binding free energy between mutated and nonmutated H7N9 virus |
Conclusion
The second epidemic wave of the H7N9 virus following its first outbreaks has heightened awareness of the threat of a pandemic and spurred efforts to develop plans for its control. As no vaccine is currently available, NA inhibitors are so far the most important options for treatment in human infections of H7N9.8 With the solved structure of N9_R294K, we found five potential drugs for H7N9 with R294K mutation. L-Arginine, aspartame, and D-arginine are similar to amino acids, whereas zanamivir and benserazide hydrochloride are like amides. As the first three amino acids presented slightly better outcomes than the other two in our experiment and oseltamivir carboxylate is also similar to amide, researchers should give priority to compounds like amino acids in developing inhibitors for mutated H7N9. Even though the R294K substitution is also associated with resistance to zanamivir, the appearance of zanamivir in our result indicates that a combination of currently available NA inhibitors might reduce the possibility of mutation and is worthy of clinical use. What is more, functional food L-arginine and aspartame indicated that maybe a healthy diet containing such food would help to prevent H7N9 as well. In summary, findings from our study will be beneficial to developing potent antiviral drugs and alleviating the increasing threat of the H7N9 virus.
Acknowledgments
We are grateful to our colleagues for their critical reviews and excellent suggestions on this manuscript. We would also like to show special gratitude to D Wang for her immense practical help in reviewing the chemical structure of compounds.
Disclosure
The authors report no conflicts of interest in this work.
References
World Health Organization [homepage on the Internet]. WHO risk assessment: Human infections with avian influenza A(H7N9) virus [updated July 14, 2014]. Available from: http://www.who.int/influenza/human_animal_interface/influenza_h7n9/riskassessment_h7n9_27june14.pdf. Accessed October 18, 2014. | ||
World Health Organization [homepage on the Internet]. Global Alert and Response (GAR) [updated continuously]. Available from: http://www.who.int/csr/don/archive/year/2014/en. Accessed July 3, 2014. | ||
Chen Y, Liang W, Yang S, et al. Human infections with the emerging avian influenza A H7N9 virus from wet market poultry: clinical analysis and characterisation of viral genome. Lancet. 2013;381(9881):1916–1925. | ||
Centers for Disease Control and Prevention [homepage on the Internet]. Types of influenza viruses. Available from: http://www.cdc.gov/flu/about/viruses/types.htm. 2014. Accessed March 5, 2014. | ||
Van Ranst M, Lemey P. Genesis of avian-origin H7N9 influenza A viruses. Lancet. 2013;381(9881):1883–1885. | ||
Takeda M, Leser GP, Russell CJ, Lamb RA. Influenza virus hemagglutinin concentrates in lipid raft microdomains for efficient viral fusion. Proc Natl Acad Sci U S A. 2003;100(25):14610–14617. | ||
Wang YT, Chan C, Su ZY, Chen CL. Homology modeling, docking, and molecular dynamics reveal HR1039 as a potent inhibitor of 2009 A (H1N1) influenza neuraminidase. Biophys Chem. 2010;147(1):74–80. | ||
Moscona A. Neuraminidase inhibitors for influenza. N Engl J Med. 2005;353(13):1363–1373. | ||
Wang SQ, Du QS, Chou KC. Study of drug resistance of chicken influenza A virus (H5N1) from homology-modeled 3D structures of neuraminidases. Biochem Biophys Res Commun. 2007;354(3):634–640. | ||
Samson M, Pizzorno A, Abed Y, Boivin G. Influenza virus resistance to neuraminidase inhibitors. Antiviral Res. 2013;98(2):174–185. | ||
Moscona A. Medical management of influenza infection. Annu Rev Med. 2008;59:397–413. | ||
Ison MG. Clinical use of approved influenza antivirals: therapy and prophylaxis. Influenza Other Respir Viruses. 2013;7 Suppl 1:7–13. | ||
Vavricka CJ, Li Q, Wu Y, et al. Structural and functional analysis of laninamivir and its octanoate prodrug reveals group specific mechanisms for influenza NA inhibition. PLoS Pathog. 2011;7(10):e1002249. | ||
Wu Y, Bi Y, Vavricka CJ, et al. Characterization of two distinct neuraminidases from avian-origin human-infecting H7N9 influenza viruses. Cell Res. 2013;23(12):1347–1355. | ||
Zhou J, Wang D, Gao R, et al. Biological features of novel avian influenza A (H7N9) virus. Nature. 2013;499(7459):500–503. | ||
Hu Y, Lu S, Song Z, et al. Association between adverse clinical outcome in human disease caused by novel influenza A H7N9 virus and sustained viral shedding and emergence of antiviral resistance. Lancet. 2013;381(9885):2273–2279. | ||
McKimm-Breschkin JL, Sahasrabudhe A, Blick TJ, et al. Mutations in a conserved residue in the influenza virus neuraminidase active site decreases sensitivity to Neu5Ac2en-derived inhibitors. J Virol. 1998;72(3):2456-2462. | ||
Yen HL, Zhou J, Choy KT, et al. The R292K mutation that confers resistance to neuraminidase inhibitors leads to competitive fitness loss of A/Shanghai/1/2013 (H7N9) influenza virus in ferrets. J Infect Dis. Epub 2014 Jun 20. | ||
Berman HM, Westbrook J, Feng Z, et al. The Protein Data Bank. Nucleic Acids Res. 2000;28(1):235–242. | ||
Pettersen EF, Goddard TD, Huang CC, et al. UCSF Chimera - a visualization system for exploratory research and analysis. J Comput Chem. 2004;25(13):1605–1612. | ||
Irwin JJ, Sterling T, Mysinger MM, Bolstad ES, Coleman RG. ZINC: a free tool to discover chemistry for biology. J Chem Inf Model. 2012;52(7):1757–1768. | ||
Lang PT, Brozell SR, Mukherjee S, et al. DOCK 6: combining techniques to model RNA-small molecule complexes. RNA. 2009;15(6):1219–1230. | ||
Huang RB, Du QS, Wang CH, Chou KC. An in-depth analysis of the biological functional studies based on the NMR M2 channel structure of influenza A virus. Biochem Biophys Res Commun. 2008;377(4):1243–1247. | ||
Hansson T, Oostenbrink C, van Gunsteren W. Molecular dynamics simulations. Curr Opin Struct Biol. 2002;12(2):190–196. | ||
Pronk S, Páll S, Schulz R, et al. GROMACS 4.5: a high-throughput and highly parallel open source molecular simulation toolkit. Bioinformatics. 2013;29(7):845–854. | ||
Jorgensen WL, Chandrasekhar J, Madura JD, Impey RW, Klein ML. Comparison of simple potential functions for simulating liquid water. J Chem Phys. 1983;79(2):926–935. | ||
Hornak V, Abel R, Okur A, Strockbine B, Roitberg A, Simmerling C. Comparison of multiple Amber force fields and development of improved protein backbone parameters. Proteins. 2006;65(3):712–725. | ||
Da Silva AW, Vranken WF. ACPYPE – antechamber python parser interface. BMC Res Notes. 2012;5:367. | ||
Cornell WD, Cieplak P, Bayly CI, et al. A second generation force field for the simulation of proteins, nucleic acids, and organic molecules. J Am Chem Soc. 1995;117(19):5179–5197. | ||
Berendsen HJ, Marrink SJ. Molecular dynamics of water transport through membranes: water from solvent to solute. Pure Appl Chem. 1993;65(12):2513–2520. | ||
Van Gunsteren WF, Berendsen HJ. A leap-frog algorithm for stochastic dynamics. Mol Simul. 1988;1(3):173–185. | ||
Essmann U, Perera L, Berkowitz ML, Darden T, Lee H, Pedersen LG. A smooth particle mesh Ewald method. J Chem Phys. 1995;103(19):8577–8593. | ||
Hess B, Bekker H, Berendsen HJ, Fraaije JG. LINCS: a linear constraint solver for molecular simulations. J Comput Chem. 1997;18(12):1463–1472. | ||
Wang W, Kollman PA. Free energy calculations on dimer stability of the HIV protease using molecular dynamics and a continuum solvent model. J Mol Biol. 2000;303(4):567–582. | ||
Homeyer N, Gohlke H. Free energy calculations by the molecular mechanics Poisson-Boltzmann surface area method. Mol Inform. 2012;31(2):114–122. | ||
Zoete V, Irving MB, Michielin O. MM-GBSA binding free energy decomposition and T cell receptor engineering. J Mol Recognit. 2010;23(2):142–152. | ||
Kumari R, Kumar R, Lynn A. g_mmpbsa – A GROMACS tool for high-throughput MM-PBSA calculations. J Chem Inf Model. 2014;54(7):1951–1962. | ||
Case DA, Cheatham TE, Darden T, et al. The Amber biomolecular simulation programs. J Comput Chem. 2005;26(16):1668–1688. | ||
Xu H, Wang Z, Liang X, et al. In silico identification of novel kinase inhibitors targeting wild-type and T315I mutant ABL1 from FDA-approved drugs. Mol Biosyst. 2014;10(6):1524–1537. | ||
Liu J, Wang F, Ma Z, Wang X, Wang Y. Structural determination of three different series of compounds as Hsp90 inhibitors using 3D-QSAR modeling, molecular docking and molecular dynamics methods. Int J Mol Sci. 2011;12(2):946–970. | ||
Morris GM, Goodsell DS, Halliday RS, et al. Automated docking using a Lamarckian genetic algorithm and an empirical binding free energy function. J Comput Chem. 1998;19(14):1639–1662. | ||
Wang R, Lu Y, Wang S. Comparative evaluation of 11 scoring functions for molecular docking. J Med Chem. 2003;46(12):2287–2303. | ||
Shen XL, Takimoto-Kamimura M, Wei J, Gao QZ. Computer-aided de novo ligand design and docking/molecular dynamics study of vitamin D receptor agonists. J Mol Model. 2012;18(1):203–212. | ||
Sleeman K, Guo Z, Barnes J, Shaw M, Stevens J, Gubareva LV. R292K substitution and drug susceptibility of influenza A (H7N9) viruses. Emerg Infect Dis. 2013;19(9):1521–1524. | ||
Li J, Zhou N, Luo K, et al. In silico discovery of potential VEGFR-2 inhibitors from natural derivatives for anti-angiogenesis therapy. Int J Mol Sci. 2014;15(9):15994–16011. | ||
Kumar KM, Anbarasu A, Ramaiah S. Molecular docking and molecular dynamics studies on β-lactamases and penicillin binding proteins. Mol Biosyst. 2014;10(4):891–900. | ||
Shiryaev S, Ratnikov B, Chekanov A, et al. Cleavage targets and the D-arginine-based inhibitors of the West Nile virus NS3 processing proteinase. Biochem J. 2006;393(2):503–511. |
 © 2014 The Author(s). This work is published and licensed by Dove Medical Press Limited. The full terms of this license are available at https://www.dovepress.com/terms.php and incorporate the Creative Commons Attribution - Non Commercial (unported, v3.0) License.
By accessing the work you hereby accept the Terms. Non-commercial uses of the work are permitted without any further permission from Dove Medical Press Limited, provided the work is properly attributed. For permission for commercial use of this work, please see paragraphs 4.2 and 5 of our Terms.
© 2014 The Author(s). This work is published and licensed by Dove Medical Press Limited. The full terms of this license are available at https://www.dovepress.com/terms.php and incorporate the Creative Commons Attribution - Non Commercial (unported, v3.0) License.
By accessing the work you hereby accept the Terms. Non-commercial uses of the work are permitted without any further permission from Dove Medical Press Limited, provided the work is properly attributed. For permission for commercial use of this work, please see paragraphs 4.2 and 5 of our Terms.