")
Back to Journals » International Journal of Nanomedicine » Volume 9 » Issue 1
Direct role of interrod spacing in mediating cell adhesion on Sr-HA nanorod-patterned coatings
Received 25 November 2013
Accepted for publication 10 January 2014
Published 8 March 2014 Volume 2014:9(1) Pages 1243—1260
DOI https://doi.org/10.2147/IJN.S58236
Checked for plagiarism Yes
Review by Single anonymous peer review
Peer reviewer comments 3
Jianhong Zhou,1 Yong Han,1 Shemin Lu2
1State Key Laboratory for Mechanical Behavior of Materials, 2Department of Genetics and Molecular Biology, College of Medicine, Xi'an Jiaotong University, Xi'an, People's Republic of China
Abstract: The process in which nanostructured surfaces mediate cell adhesion is not well understood, and may be indirect (via protein adsorption) or direct. We prepared Sr-doped hydroxyapatite (Sr1-HA) 3D nanorods (with interrod spacing of 67.3±3.8, 95.7±4.2, and 136.8±8.7 nm) and 2D nanogranulate patterned coatings on titanium. Employing the coatings under the same surface chemistry and roughness, we investigated the indirect/direct role of Sr1-HA nanotopographies in the regulation of osteoblast adhesion in both serum-free and serum-containing Dulbecco's Modified Eagle/Ham's Medium. The results reveal that the number of adherent cells, cell-secreted anchoring proteins (fibronectin, vitronectin, and collagen), vinculin and focal adhesion kinase (FAK) denoted focal adhesion (FA) contact, and gene expression of vinculin, FAK, and integrin subunits (α2, α5, αv, β1, and β3), undergo significant changes in the inter-nanorod spacing and dimensionality of Sr1-HA nanotopographies in the absence of serum; they are significantly enhanced on the <96 nm spaced nanorods and more pronounced with decreasing interrod spacing. However, they are inhibited on the >96 nm spaced nanorods compared to nanogranulated 2D topography. Although the adsorption of fibronectin and vitronectin from serum are higher on 136.8±8.7 nm spaced nanorod patterned topography than nanogranulated topography, cell adhesion is inhibited on the former compared to the latter in the presence of serum, further suggesting that reduced cell adhesion is independent of protein adsorption. It is clearly indicated that 3D nanotopography can directly modulate cell adhesion by regulating integrins, which subsequently mediate anchoring proteins' secretion and FA formation rather than via protein adsorption.
Keywords: nanotopography, inter-nanorod spacing, osteoblast adhesion, integrin, anchoring protein secretion, focal adhesion
Introduction
Osteogenic cells, such as mesenchymal stem cells (MSC) and osteoblasts, are anchorage-dependent cells, and the interactions between the cells and orthopedic implants play a crucial role in osteointegration.1 Adhesion of the cells is the first phase of the interactions, occurring in four major steps: protein adsorption, cell–material contact, attachment, and spreading.1,2 The quality of this first phase has been proven to influence subsequent cellular behavior such as proliferation, differentiation, and apoptosis.2 In most instances of anchorage-dependent cells, cell adhesion to a material surface is achieved via the formation of intracellular focal adhesion and triggered by bioconjugation of some ligands in the extracellular matrix (ECM) to integrins.3 The focal adhesion is a large and robust molecular complex that consists of structural proteins, including vinculin, talin, and α-actinin, and signaling molecules, such as focal adhesion kinase (FAK) and paxillin.4 Integrin is a heterodimeric transmembrane receptor, composed of an α- and a β-subunit. With their extracellular domains, integrins can bind to specific amino acid sequences such as arginine–glycine–aspartic acid (RGD) motifs in ECM proteins like collagens, fibronectin, vitronectin, fibrinogen, laminin, osteopontin, and bone sialoprotein.5–7
An important aspect of orthopedic implant integration is the enhancement of the functional activity of osteoblasts at the tissue–implant interface without any fibrous tissue intervention.8 Cell–material interactions depend on the surface properties of the material, such as chemistry,2,9–11 surface energy,2,12 roughness,13 and topography.14–22 Recent works demonstrated that three-dimensional (3D) nanotopography could influence cell adhesion; however, conflicting results have been reported. For example, hydroxyapatite (HA) nanoneedles and nanofibers,17 quasi-aligned TiC and TiO2 nanowires,18 and randomly oriented and upright SiO2 and ZnO nanorods19 inhibited adhesion and spreading of cells. In contrast, the other lines revealed that ZnO nanoflowers,20 gold-coated silicon nanopillars,21 and Co–Cr nanopillars22 improve the cell adhesion compared to the corresponding 2D counterparts. Therefore, it is necessary to construct a nanopatterned surface on the implant, which would favor positive interactions with osteoblasts.
The process in which nanostructured surfaces of materials mediate cell adhesion is not well understood.23,24 Many works have revealed that this process may be indirect, where the surface topographies affect the type, amount, orientation, or conformation of adsorbed proteins (such as fibronectin, vitronectin, laminin, and collagen) on the surfaces from body fluids (such as blood, plasma or serum), which in turn influences cell response. For instance, it has been demonstrated that surface nanotopography does not significantly affect cell adhesion in the absence of serum,25 whereas nanograined ceramics26 and metals27,28 can enhance cell adhesion through increased protein adsorption compared to coarse-grained materials in the presence of serum. A typical review, focusing on 2D nanotopographical surfaces, highlighted that cells are in some cases essentially controlled by the surface-adsorbed proteins rather than by direct signaling from nanoscale surface cues.23 However, recent studies found that the adsorbed fibronectin did not affect cell adhesion on nano-hut/dome tantalum surfaces compared to flat surfaces,14 and the reduced cell adhesion on TiC nanowires18 and SiO2 nanorods19 was independent of protein adsorption. These findings imply that the process of cell adhesion on 3D nanotopographs may be directly mediated by signaling from nanoscale surface cues rather than by surface-adsorbed proteins, although there was lack of evidence in the absence of serum.14,18,19,23
Studies on the chemical composition of nanotopographies have highlighted the significance of HA in promoting cell response,29,30 and strontium-doped HA (Ca10-xSrx[PO4]6[OH]2, Srx-HA) with a Sr dose lower than 20% enhances osteoblast activity31 and the positive effect of HA on bone integration.32 In our previous works, we prepared nanogranulated HA,33 Sr0.5-HA-, Sr1-HA-, Sr2-HA-,32 and Sr10-HA-34 patterned TiO2 coatings using microarc oxidation (MAO), and also synthesized nanorod-shaped Sr1-HA-patterned TiO2 coatings on macroporous titanium scaffolds35 and dense titanium36 using a two-step method of MAO and hydrothermal treatment (HT). It has been revealed that these multilayer coatings can firmly adhere to titanium substrates,35 and the proliferation and differentiation of osteoblasts can be positively or negatively regulated by the narrow or wide interrod spacing of the Sr1-HA nanorods in the presence of serum, respectively.36 In the present study, the processes of osteoblast adhesion on the 3D Sr1-HA nanorod (with different interrod spacing) patterned coatings were investigated in serum-containing and serum-free cell-culture media, together with 2D Sr1-HA nanogranule-patterned coating, to identify the effect of such nanotopographies on cell adhesion, especially the direct or indirect role of nanoscale surface cues in the regulation of cell adhesion.
Materials and methods
Preparation and structural characterization of Sr1-HA nano-granule/rod-patterned multilayer coatings
Commercial pure titanium discs of Φ15 × 2 mm were employed as substrates. For the formation of the Sr1-HA nanogranule-patterned multilayer coating (referred to as NG) by MAO, the titanium discs were used as anodes and treated using a pulse power supply in an aqueous electrolyte containing 0.167 M calcium acetate (CA), 0.033 M strontium acetate (SA), and 0.02 M β-glycerophosphate disodium (β-GP) at an applied voltage of 480 V, a pulse frequency of 100 Hz, and a duty ratio of 26% for 5 minutes.36 The formation of the r1-HA nanorod-patterned multilayer coatings (referred to as S67, S96, and S137 in reference to their difference in interrod spacing) by a two-step method of MAO and HT has been described in detail elsewhere.36 Briefly, the titanium discs were first treated by MAO using a bipolar pulse power supply in an aqueous electrolyte containing different concentrations of CA, SA, and β-GP at an applied positive pulse voltage of 380 V, a negative pulse voltage of 100 V, a pulse frequency of 100 Hz, and a duty ratio of 26% for 5 minutes; then the microarc-oxidized coatings were mounted in a Teflon-lined autoclave containing distilled water with an initial pH value of 6.4 to receive HT at 140°C for 24 hours. The morphologies of the coatings were examined by field-emission scanning electron microscopy (FESEM), (JSM-6700F; JEOL, Tokyo, Japan). In-plane TEM foil was prepared for the surface layer of the Sr1-HA nanogranule-patterned multilayer coating, and was examined by transmission electron microscopy (TEM), (JEM-2000FX; JEOL) operating at 200 kV. The roughness of the coatings was examined by atomic force microscopy (AFM), (SPM-9500J3; Shimadzu, Kyoto, Japan). The hydrophilicity of the coatings was measured by a surface contact-angle measurement machine (DSA30; KRÜSS GmbH, Hamburg, Germany).
Protein adsorption assay
A 1 mL droplet of Dulbecco’s Modified Eagle/Ham’s Medium (DMEM-12) (Thermo Scientific, Waltham, MA, USA) containing 10% fetal bovine serum (FBS), (Thermo Scientific) was pipetted onto each sample placed in 24-well plate. After incubation at 37°C for 1, 4, and 24 hours, these samples were transferred to new 24-well plates and washed three times with 1,000 μL phosphate buffer saline (PBS), (Sigma, St Louis, MO, USA). Afterwards, 500 μL of 1% sodium dodecyl sulfate (SDS) solution was added to these wells and shaken for 15 minutes to detach proteins from the sample surface. Fibronectin and vitronectin concentrations in the collected SDS solutions were determined using respective enzyme-linked immunosorbent assay (ELISA) kits (R&D Systems, Minneapolis, MN, USA), while the total protein concentrations in the collected SDS solutions were determined using a NanoDrop 2000C device (Thermo Scientific) at a wavelength of 280 nm. Four samples for each group were tested, and each test was repeated four times (n=4).
Cell adhesion assays
Cell culture
Human fetal osteoblast cell line, hFOB1.19, was purchased from the Institute of Biochemistry and Cell Biology of Chinese Academy of Sciences (Shanghai, People’s Republic of China). The cells were inoculated into DMEM-12 supplemented with 10% FBS, 0.3 mg/mL Geneticine 418 (Sigma), 0.5 mM sodium-pyruvate (Sigma), and 1.2 g/L Na2CO3, and incubated in a humidified atmosphere incubator with 5% CO2 and 95% air at 37°C. The medium was refreshed every 2 days.
Assay conditions
The following assays were performed after incubation of hFOB1.19 cells on the coatings in serum-free DMEM-12 and serum-containing medium (DMEM-12 containing 10% FBS), respectively.
Cell adhesion assessment and morphology observation
The samples were placed centrally in 24-well plates with a well diameter of 15 mm. hFOB1.19 cells were seeded on each sample at a density of 4 × 10⁴ cells/cm2, and incubated for 1, 5, and 24 hours. At the end of each time period, the medium was removed from each well, and the samples were washed three times with PBS then transferred to new 24-well plates. The cells adhered on the samples were subsequently digested out of the samples with 0.3 mL 0.25% trypsin (Sigma) for 5 minutes, then 0.7 mL culture medium was added to stop digestion; the released cells were counted with a hemocytometer on a Nikon Eclipse inverted fluorescence microscope (Tokyo, Japan). Alternatively, 3-(4,5-dimethylthiazol-2-yl)-2,5-diphenyltetrazolium bromide (MTT) assay was used to evaluate cell viability, which actually reflects mitochondrial activity (thus the metabolic condition) of cells. Thirty microliters of MTT (Sigma) solution (5 mg/mL MTT in PBS) together with 500 μL culture medium was added to each well with continuous culture for 4 hours. After removing the culture medium, adding 200 μL DMSO (Sigma) into each well and oscillating for 10 minutes, 100 μL of DMSO solution from each well was transferred to a 96-well plate and the absorbance was measured at 490 nm. For both counting and MTT methods, four specimens for each group were tested, and each test was repeated four times.
After 1 hour of culture, the cell-adhered samples were washed three times with PBS, and fixed with 2.5% glutaraldehyde for 1 hour at 4°C. The cell-fixed samples were then dehydrated in ethanol, followed by vacuum drying. After coating in gold, the samples were observed under FESEM for cell morphology.
Fluorescence and Sirius red staining assessments
Fluorescence staining of the actin, vinculin, and cell nucleus was performed with a triple staining kit from Chemicon (Chemicon International, Billerica, MA, USA) as follows. hFOB1.19 cells were seeded on the coatings in 24-well plates at a density of 4×10⁴ cells/cm2. After 24 hours of culture, the cell-seeded samples were fixed with 4% paraformaldehyde and washed three times with PBS buffer (PBS supplemented with 0.05% Tween-20; Sigma), permeabilized with 0.1% Triton X-100 (Sigma) and washed three times again with PBS buffer. The cells were then incubated for 30 minutes at room temperature in 1% bovine serum albumin (Sigma) blocking agent. Mouse monoclonal anti-vinculin (2 μg/mL; Chemicon International) was added to the cells and the cells were incubated at 37°C for 60 minutes and washed three times with PBS buffer. Fluorescein isothiocyanate (FITC)-conjugated goat anti-mouse IgG (10 μg/mL; Chemicon International) and 37.5 ng/mL tetramethylrhodamine isothiocyanate-conjugated phalloidin were added to the cells and the cells were incubated at 37°C for 60 minutes for vinculin and actin staining, respectively. Subsequently, the cells were washed three times with PBS and incubated in 0.1 μg/mL 6-diamidino-2-phenylindole (DAPI) at 37°C for 5 minutes for cell nucleus staining. After washing three times with PBS, the stained cells were analyzed with an OLYMPUS laser confocal microscopy FV1000 (Tokyo, Japan). In addition, this process was applicable to the fluorescence staining of the actin, FAK, and nucleus of the cells cultured on the coatings with a triple staining kit from Chemicon (Chemicon International). The difference is that 2 μg/mL mouse monoclonal anti-FAK (Chemicon International) instead of mouse monoclonal anti-vinculin was used as the primary antibody for FAK staining.
Fluorescence staining of fibronectin and vitronectin secretion on the coatings was performed as follows. hFOB1.19 cells were seeded on the coatings at a density of 4×10⁴ cells/cm2. After 24 hours of culture, the cell-seeded coatings were fixed in 4% paraformaldehyde for 10 minutes and then incubated for 30 minutes at room temperature in a 1% bovine serum albumin (Sigma) blocking agent. Rabbit monoclonal anti-fibronectin (1 μg/mL), (Abcam, Cambridge, UK) or mouse monoclonal anti-vitronectin (Abcam) was added to the coatings’ surfaces and incubated at 4°C for 12 hours, then 10 μg/mL rhodamine-conjugated goat anti-rabbit IgG (Chemicon International) or FITC-conjugated goat anti-mouse IgG (Chemicon International) was correspondingly added to the abovementioned coatings’ surfaces and incubated at 37°C for 60 minutes for fibronectin or vitronectin staining, respectively. After each of the staining events, the samples were washed three times with PBS. The stained fibronectin and vitronectin secreted by cells were analyzed with an OLYMPUS laser confocal microscopy FV1000.
Collagen secretion by osteoblasts on the coatings was quantified by Sirius red staining as follows. hFOB1.19 cells were seeded on the coatings at a density of 4×10⁴ cells/cm2 and cultured for 5 and 24 hours, then washed three times with PBS and fixed in 4% paraformaldehyde. Following three rinses in PBS, the constructs were stained for collagen secretion in a 0.1% solution of Sirius red (Sigma) in saturated picric acid for 18 hours. After washing the coatings with 0.1 M acetic acid until the red color presented in the solution disappeared, the stain on the coatings was eluted in 500 mL of a destain solution (0.2 M 1:1 NaOH/methanol). The optical density of the eluted solution was then measured using a spectrophotometer at 540 nm.
Real-time polymerase chain reaction (PCR)
Gene expression of FAK, vinculin, and integrins (α2, α5, αv, β1, and β3) of the cells cultured on the samples for 5 and 24 hours were evaluated using real-time PCR. The total ribonucleic acid (RNA) was isolated using TRIzol reagent (Gibco, Carlsbad, CA, USA). RNA from the cells on each sample (1 μg) was reversed transcribed into complementary DNA using a PrimeScript RT reagent kit (Takara, Shiga, Japan). Expression of vinculin, FAK, and various integrins was quantified using a real-time PCR detection system (Bio-Rad iQ™ 5 Multicolor; Hercules, CA, USA) with SYBR® Premix Ex™ Taq II (Takara). Data analysis was carried out using an iQ™ 5 Optical System (Bio-Rad; v 2.0). The housekeeping gene, glyceraldehyde-3-phosphate dehydrogenase (GAPDH), was used as an endogenous reference gene to normalize the calculation through the Comparative Ct value method. The sequences of the specific primer sets are listed as follows: FAK (5′TTATCCTGTTCATTGGCTT3′ and 5′GTTGGCTCATTACTGCTTT3′), vinculin (5′GATGCTGGTGAACTCAATGA3′ and 5′CGAATGATCTCGTTAATCTC3′), α2 (5′TCCAAGCCTTCAGTGAGAGC3′ and 5′ATGTGTATCGATCTCTGCCG3′), α5 (5′AGATGAGTTCAGCCGATTCG3′and 5′TGGAAGTCAGGAACAGTGCC3′), αv (5′TCGCCGTGGATTTCTTCGT3′ and 5′TCGCTCCTGTTTCATCTCAGTTC3′), β1 (5′ACATGGACGCTTACTGCAGG3′ and 5′GAACAATTCCAGCAACCACG3′), and β3 (5′ATTGGCTGGAGGAATGACG3′ and 5′AAGACTGCTCCTTCTCCTGG3′).
Statistical analysis
The data were analyzed using SPSS software (v14.0), (SPSS, Chicago, IL, USA). A two-way analysis of variance (ANOVA) followed by a Student–Newman–Keuls post-hoc test was used to determine the level of significance. P<0.05 was considered to be significant and P<0.01 was considered to be highly significant.
Results and discussion
Characterization of Sr1-HA nanogranulate/nanorod-patterned coatings
The NG coating is microporous with nanogranulated surface topography on the pores’ walls (Figure 1A), which is multilayered with Sr1-HA as the outer layer and TiO2-Ca0.5Sr0.5TiO3 as the inner layer adjacent to the Ti substrate, as described in our previous work.36 The S67, S96, and S137 coatings are also microporous but with nanorod-shaped 3D topography on the pores’ walls (Figure 1B–D), consisting of Sr1-HA as the outer layer, Ca0.5Sr0.5TiO3 as the middle layer, and TiO2 as the inner layer adjacent to the Ti substrate.36 The nanorods on the coatings have a similar mean diameter of 70 nm; however, the interrod spacing values are quite different: 67.3±3.8, 95.7±4.2, and 136.8±8.7 nm for the S67, S96, and S137 coatings, respectively. There is no obvious difference in micro-scale roughness among the coatings, as characterized by average roughness (Ra) values. For example, these values are 465.4±35.3, 431.6±43.1, 437.7±31.3, and 429.6±41.5 nm for NG, S67, S96, and S137, respectively. The measured contact angles of water droplets on the NG, S137, S96, and S67 coatings are 46.8°±5.7°, 25.2°±3.1°, 14.5°±2.9°, and 4.3°±1.5°, respectively, indicating that the nanorod-patterned coatings can improve hydrophilicity compared to the nanogranulated coating; the improvement is more significant with decreasing interrod spacing.
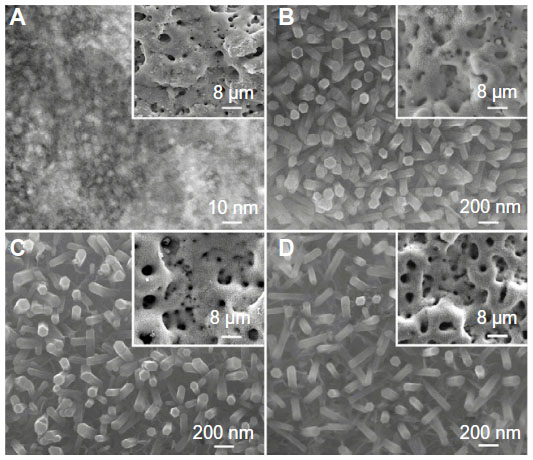 | Figure 1 (A) TEM image taken from the surface of NG coating; SEM surface morphologies of (B) S67, (C) S96, and (D) S137 coatings; the inserts showing corresponding low magnification SEM images. |
Protein adsorption on the coatings in the presence of serum
Serum contains a variety of proteins, including albumin, fibronectin, and other subtle trace proteins such as vitronectin, osteopontin, and laminin.37,38 The amounts of fibronectin, vitronectin, and total protein adsorbed on the coatings from serum-containing DMEM-12 after 1, 4, and 24 hours of incubation are displayed in Figure 2. At each incubation time, the adsorption amounts of fibronectin, vitronectin, and total protein on the coatings follow the trend: S67 > S96 > S137 > NG (Figure 2A–C). Moreover, the amounts of fibronectin and vitronectin are relatively lower than that of total protein due to the competition of other serum proteins for surface adsorption sites. However, vitronectin shows higher adsorption efficiency on the coatings compared to fibronectin, especially on the S67 and S96 coatings (Figure 2D).
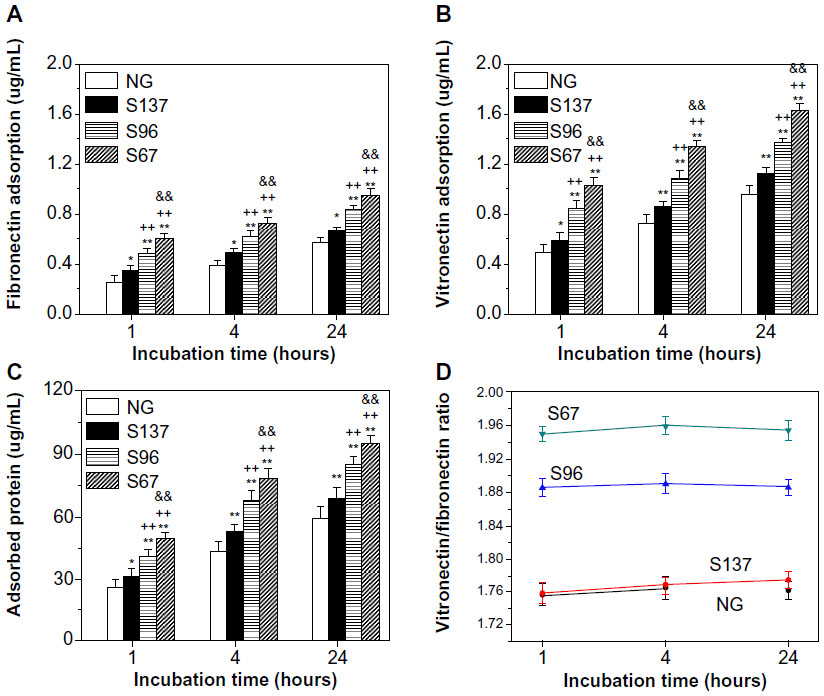 | Figure 2 Adsorption of (A) fibronectin, (B) vitronectin, and (C) total protein as well as (D) ratio of vitronectin/fibronectin adsorbed onto the coatings after 1, 4, and 24 hours of incubation in serum-containing DMEM-12 medium. |
Secreted anchoring proteins by cells in ECM
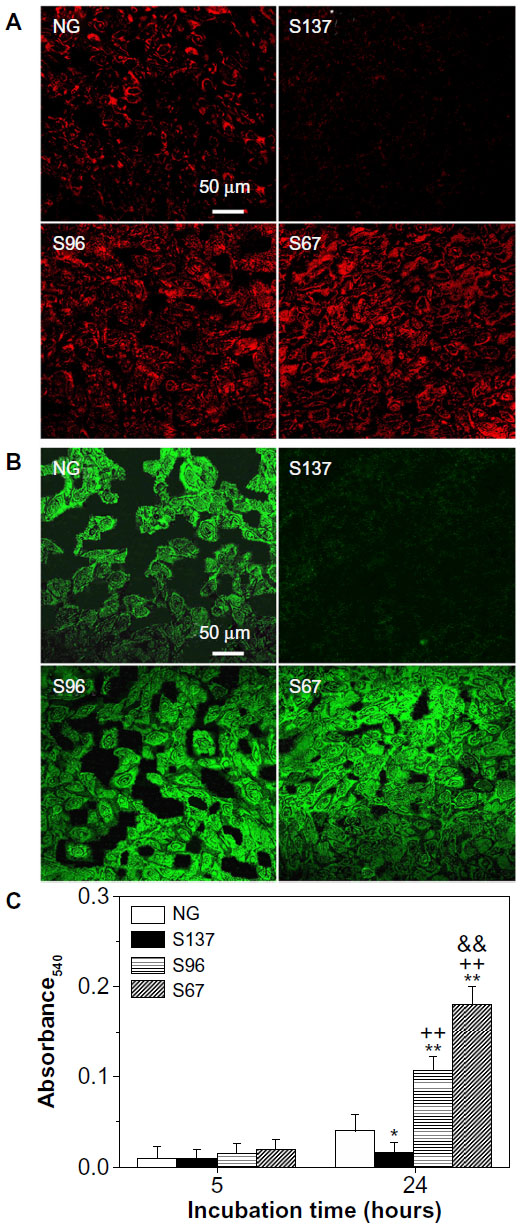
Besides the adsorbed proteins from body fluids (such as blood, plasma, or serum), the extracellular anchoring ligands interacting with integrins can also be fibronectin, vitronectin, and collagen secreted by cells.7 Relatively little work has been done to delineate the effects of surface topography on the processes of protein secretion by cells cultured on different topographical surfaces at the cell adhesion stage. We examined the surfaces of the NG, S137, S96, and S67 coatings after incubation in serum-free DMEM-12 for 24 hours, and no protein could be detected on the coatings. Figures 3 and S1 show fluorescence images of fibronectin and vitronectin as well as the quantitative result of collagen on the coatings after 24 hours of osteoblast incubation. In the absence of serum, as there was no protein adsorbed on the coatings from the medium, the presented fibronectin, vitronectin, and collagen on the coatings are those secreted by cells rather than adsorbed protein. It is notable that the amounts of the secreted anchoring proteins are significantly higher on the S96 coating and much pronounced on the S67 coating; however, the amount was significantly lower on the S137 coating compared to the NG coating (Figure 3). This result suggests that osteoblasts can secrete ECM proteins on Sr1-HA surfaces within 24 hours of incubation and the proteins’ secretion strongly depends on the inter-nanorod spacing and dimensionality of Sr1-HA nanotopographies. The dependence of proteins’ secretion on surface topography is also confirmed by the evidence that fibroblasts can secret fibronectin on titanium surfaces after 16 hours of incubation and the fact that the amount of the secreted fibronectin increased ~2-fold on grooved surfaces compared to smooth surfaces.39
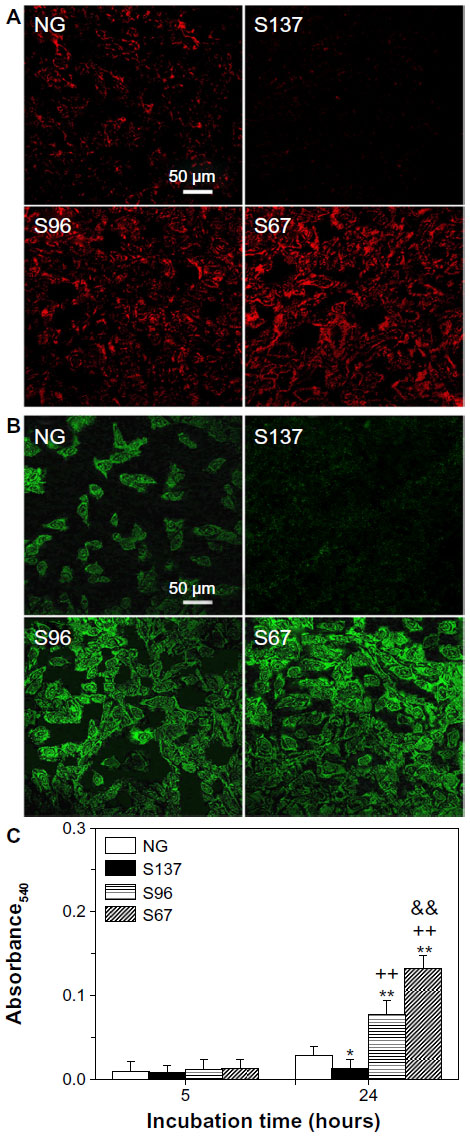 | Figure 3 Fluorescence images of (A) fibronectin and (B) vitronectin secreted by osteoblasts into ECM on NG, S137, S96, and S67 coatings after 24 hours of incubation in serum-free DMEM-12. (C) Collagen secretion in ECM by osteoblasts on the coatings after 5 and 24 hours of incubation in serum-free DMEM-12. |
In the presence of serum, owing to the adsorption of proteins on the coatings from the medium, the presented fibronectin, vitronectin, and collagen on the coatings (Figure S1) include adsorbed and cell-secreted ones. It is shown that the dependence of the presented fibronectin, vitronectin, and collagen on the surface topographies of the coatings in the presence of serum is similar to that in the absence of serum. However, these presented proteins on the coatings are more pronounced in the presence of serum compared to in the absence of serum. The amounts of adsorbed fibronectin and vitronectin on the S137 coating are higher than those on the NG coating (Figure 2); however, as the presented fibronectin and vitronectin on the S137 coating are much lower than those on the NG coating in the presence of serum (Figure S1), it is reasonable to suggest that the presented fibronectin, vitronectin, and collagen on the NG, S137, S96, and S67 coatings in the presence of serum are mainly contributed from the cell-secreted fibronetion, vitronetion, and collagen.
Cell adhesion on nano-granulate/rod-patterned coatings
The numbers and morphologies of cells adhered on the coatings
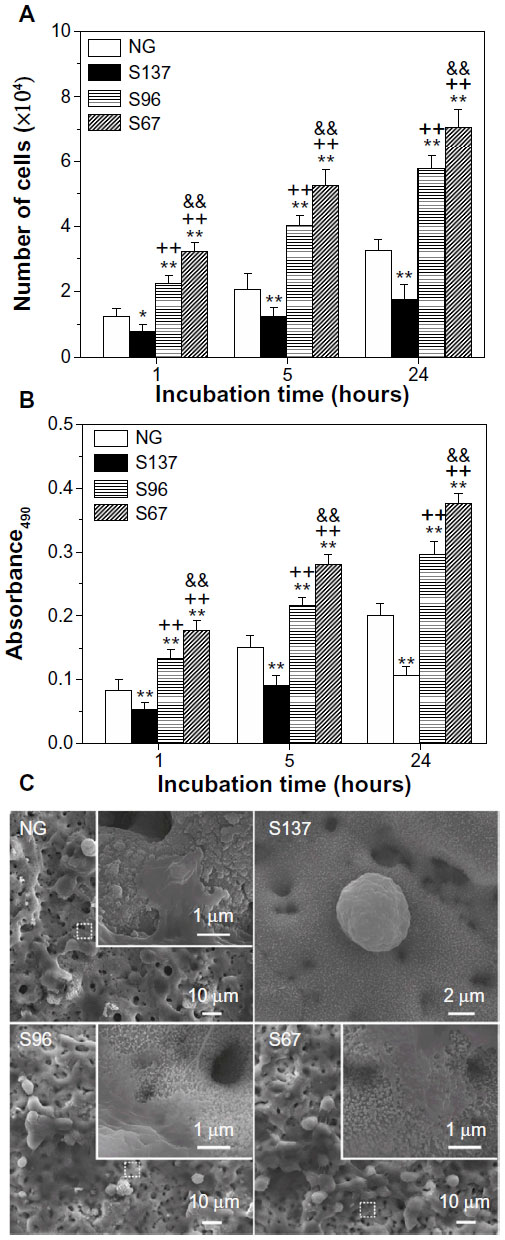
Figures 4A and S2A show the counting assay of osteoblasts on the coatings after 1, 5, and 24 hours of incubation. In the absence of serum (Figure 4A), the number of adherent cells has been observed to significantly increase on the S67 and S96 coatings, but decrease on the S137 coating compared to the NG coating at each time point; at 24 hours, for example, a 2.85-fold increase on the S67 coating, 1.94-fold increase on the S96 coating, or 0.68-fold decrease on the S137 coating compared to the NG coating are exhibited. Furthermore, the dependence of the cell number on the surface topographies of the coatings in the presence of serum (Figure S2A) is similar to that in the absence of serum. However, all of the coatings to some extent show an increase in the number of adherent cells in the presence of serum compared to the absence of serum at each time; and the increase is the largest on the NG coating and the least on the S137 coating. For instance, a 1.76-fold on the NG coating, 1.18-fold on the S137 coating, 1.52-fold on the S96 coating, and 1.32-fold on the S67 coating are visible at 24 hours (Figure S2A). MTT assay of cells on the coatings exhibited the same trend as the counting assay, as shown in Figures 4B and S2B, indicating that the metabolic activity of adherent cells significantly increases on the S67 and S96 coatings, but decreases on the S137 coating compared to the NG coating.
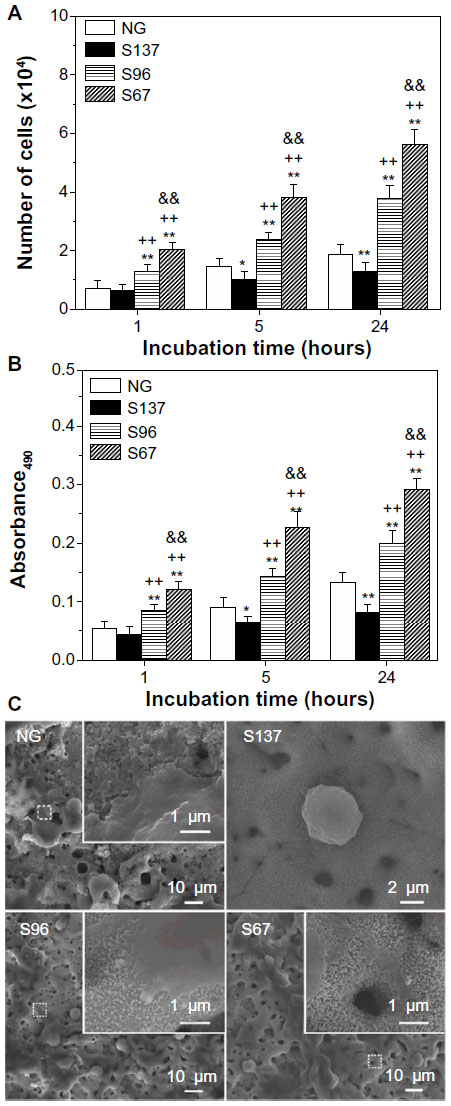 | Figure 4 (A) Counting and (B) MTT assays of osteoblasts on the NG, S137, S96, and S67 coatings after 1, 5, and 24 hours of incubation in serum-free DMEM-12. (C) Morphologies of cells on the coatings after 1 hour of incubation in serum-free DMEM-12; the inserts are corresponding magnified images. |
Figures 4C and S2C show the cells’ morphologies on the coatings after culturing for 1 hour. The shapes of the cells on the coatings in the absence of serum (Figure 4C) are similar to those in the presence of serum (Figure S2C), but exhibit significant differences with the surface topographies of the coatings. The adherent cells are spherically shaped on the S137 coating and display less spread; larger polygonal cells appear on the NG coating and are more pronounced on the S67 and S96 coatings. Remarkably, the inserted magnified images show no obvious filopodia on the NG and S137 coatings and a few filopodia appear on the S96 coating; in contrast, many filopodia can be observed at the borders of cells on the S67 coating. It is clear that the inter-nanorod spacing and dimensionality of Sr1-HA nanotopographies can separately modulate cell adhesion and plays a dominant role in mediating cell adhesion compared to protein adsorption; the adhesion and spread of cells is significantly enhanced on 67.3±3.8 and 95.7±4.2 nm spaced nanorods’ patterned topographies, but is inhibited on 136.8±8.7 nm spaced nanorods’ patterned topography compared to the nanogranulated 2D topography.
Focal adhesion contact and cytoskeleton organization
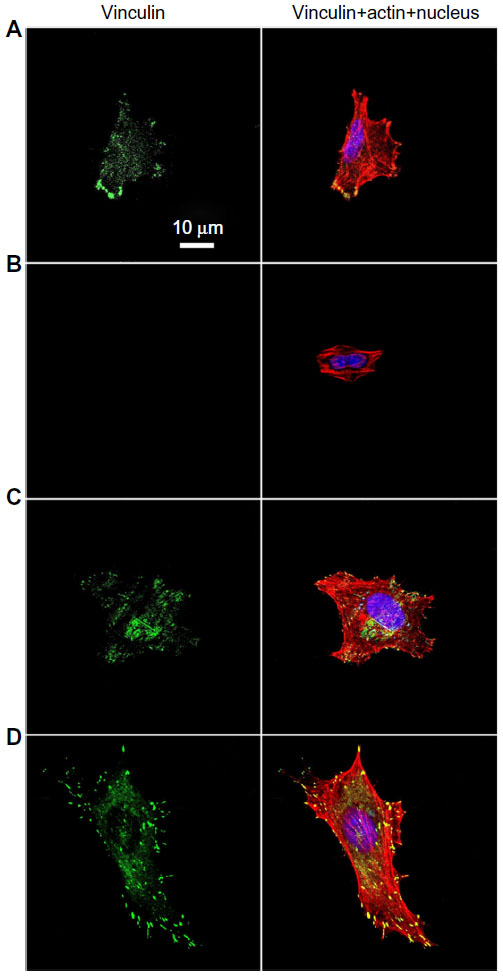
Cell adhesion to a material is achieved via the formation of focal adhesion (FA).3 The characterization of FA, namely FAK and vinculin which can be seen as markers to identify FA contact, and cytoskeleton such as actin arrangement, would provide evidence on how topography affects cell adhesion.40,41 FAK is a tyrosine kinase that colocalizes with integrins at the C-terminal FA-targeting domain via associations with integrin-binding proteins, paxillin and talin.42 Vinculin is a membrane-bound protein involved in FA, acting as a linker between integrins and actin cytoskeleton.43 Figures 5 and S3 as well as Figures 6 and S4 show vinculin–actin–nucleus and FAK–actin–nucleus tri-colors staining fluorescence images of cells on the coatings after 24 hours of incubation, respectively. In the absence of serum (Figures 5 and 6), the FA contact, as visualized by FA-recruited vinculin and FAK, are distributed over the peripheral and central regions of cells on the NG, S67, and S96 coatings, but almost no FA contact can be seen in cells on the S137 coating. Qualitatively, there are more FA contact points in cells on the S96 coating, and much more on the S67 coating than those on the NG coating. Furthermore, better organized filamentous actin bundles are observed in cells on the S67 and S96 coatings, especially on the S67 coating compared to the other coatings. In the presence of serum (Figures S3 and S4), the FA distributions and actin arrangements in cells on the coatings are similar to those in the serum-free condition; however, the areas of cells on the coatings are slightly increased compared to those in the absence of serum.
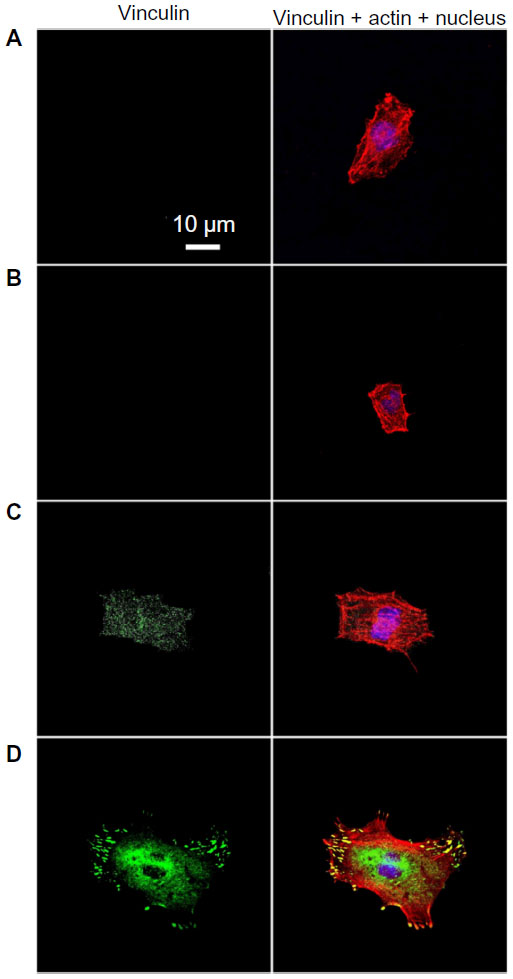 | Figure 5 Vinculin (green), actin (red), and nucleus (blue) fluorescence images of osteoblasts on the (A) NG, (B) S137, (C) S96, and (D) S67 coatings after 24 hours of incubation in serum-free DMEM-12. |
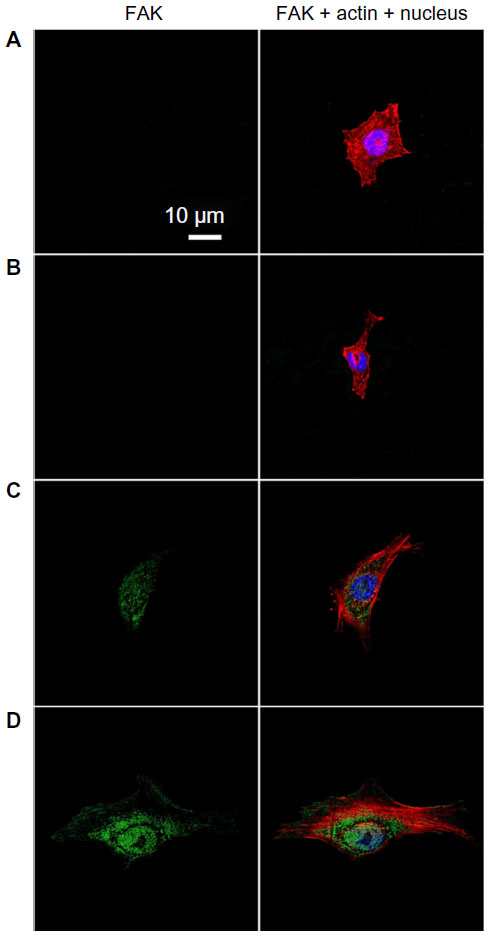 | Figure 6 FAK (green), actin (red), and nucleus (blue) fluorescence images of osteoblasts on the (A) NG, (B) S137, (C) S96, and (D) S67 coatings after 24 hours of incubation in serum-free DMEM-12. |
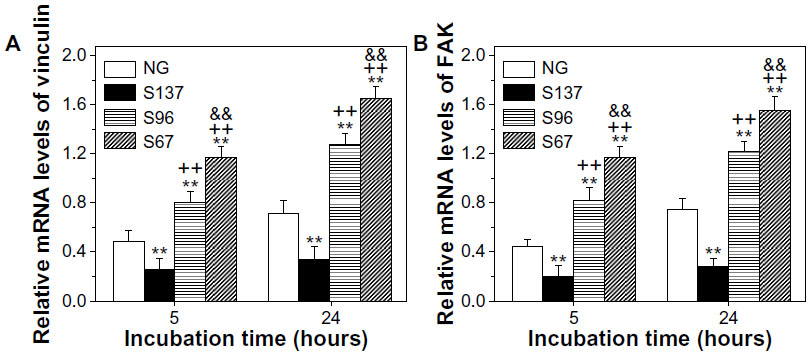
To further quantitatively demonstrate FA, the vinculin and FAK gene expression of cells on the coatings after 5 and 24 hours of culture were detected as shown in Figures 7 and S5. In both the cases of the absence (Figure 7) and presence of serum (Figure S5), the gene expression of vinculin and FAK in cells on the coatings increases with incubation time. At each incubation time, the expression of vinculin and FAK mRNAs in cells are significantly upregulated on the S67 and S96 coatings, but significantly downregulated on the S137 coating compared to the NG coating. In the absence of serum after 24 hours of incubation (Figure 7), for example, the cells express 2.63-fold higher vinculin and 2.81-fold higher FAK mRNAs on the S67 coating, 1.81-fold higher vinculin and 1.93-fold higher FAK mRNAs on the S96 coating, but 0.63-fold lower vinculin and 0.50-fold lower FAK mRNAs on the S137 coating than on the NG coating. In the presence of serum (Figure S5), the mRNA expression of vinculin and FAK in cells on the coatings is modestly upregulated compared to in the absence of serum, and the upregulation is the least on the S137 coating and the most on the NG coating; at 24 hours for example, 1.2~1.5-fold upregulated vinculin and 1.1~1.6-fold upregulated FAK mRNAs are exhibited. This result suggests that the inter-nanorod spacing and dimensionality of Sr1-HA nanotopographies can separately modulate the formation of focal adhesion and plays a predominant role compared to protein adsorption. Although many experimental investigations have shown that nanotopographies can regulate the formation of focal adhesion in the presence of serum, the molecular mechanism by which topography affects FA complexes and the mRNA expression of vinculin and FAK is not clear.2,3,40–43
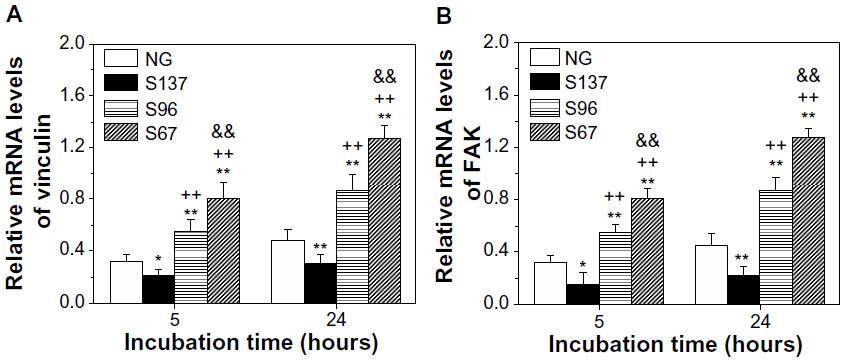 | Figure 7 (A) Vinculin and (B) FAK gene expression of osteoblasts on the coatings after 5 and 24 hours of incubation in serum-free DMEM-12. |
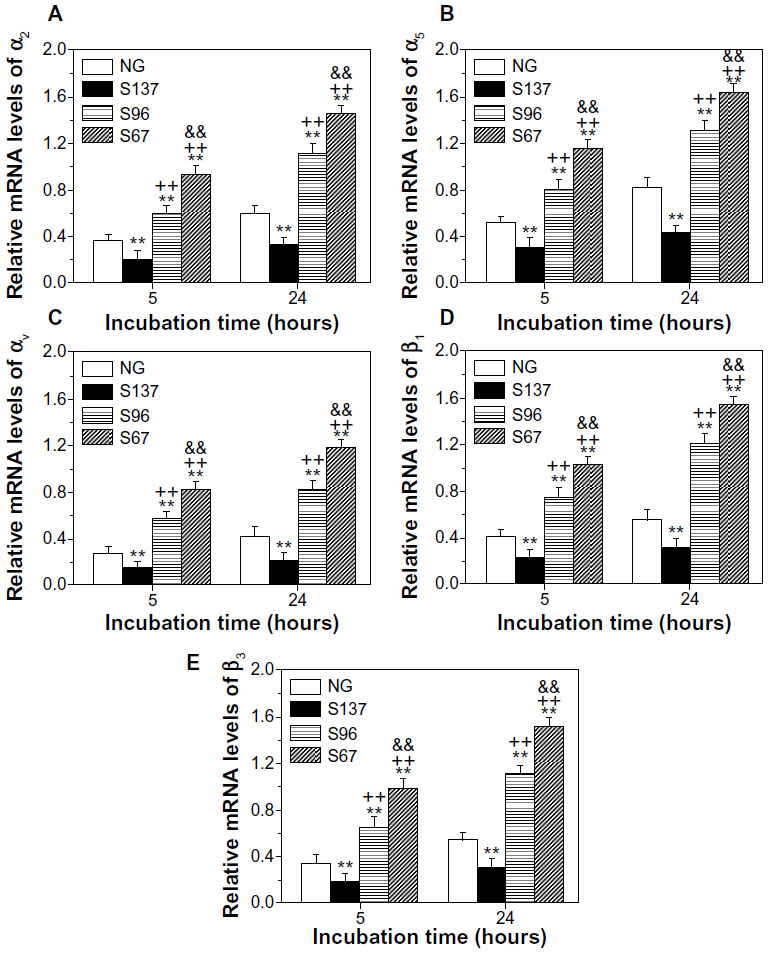
Integrin gene expression
Transmembrane integrin plays an important role in mediating cell adhesion; it binds to extracellular anchoring ligands on one side, and to intracellular linker proteins of focal adhesion such as vinculin on the other side.7 Figures 8 and S6 show the gene expression of integrin subunits in osteoblasts on the coatings. In both cases of the absence (Figure 8) and presence of serum (Figure S6), the mRNA expression of α2, α5, αv, β1, and β3 in cells on the coatings increases with incubation time. At each incubation time, the gene expression of the integrin subunits in cells is significantly upregulated on the S67 and S96 (especially S67) coatings, but significantly downregulated on the S137 coating compared to the NG coating. In the absence of serum after 24 hours of incubation (Figure 8), for example, compared to the NG coating, the S67 coating shows an increase in mRNA expression of 2.84-fold for α2, 2.63-fold for α5, 3.04-fold for αv, 2.84-fold for β1, and 5.4-fold for β3; the S96 coating shows a increase in mRNA expression of 1.96-fold for α2, 1.81-fold for α5, 2.14-fold for αv, 2.11-fold for β1, and 3.03-fold for β3; while the S137 coating shows a decrease in mRNA expression of 0.64-fold for α2, 0.63-fold for α5, 0.57-fold for αv, 0.53-fold for β1, and 0.85-fold for β3. In the presence of serum (Figure S6), the mRNA expression of the integrin subunits in cells on the coatings is modestly upregulated compared to the absence of serum, and the upregulation is the least on the S137 coating and the largest on the NG coating; at 24 hours for instance, 1.17~1.51-fold upregulated α2, 1.21~1.69-fold upregulated α5, 1.16~1.56-fold upregulated αv, 1.13~1.61-fold upregulated β1, and 1.19~2.32-fold upregulated β3 mRNAs are exhibited. This result suggests that the inter-nanorod spacing and dimensionality of Sr1-HA nanotopographies can separately regulate the gene expression of α2, α5, αv, β1, and β3 and plays a predominant role compared to protein adsorption.
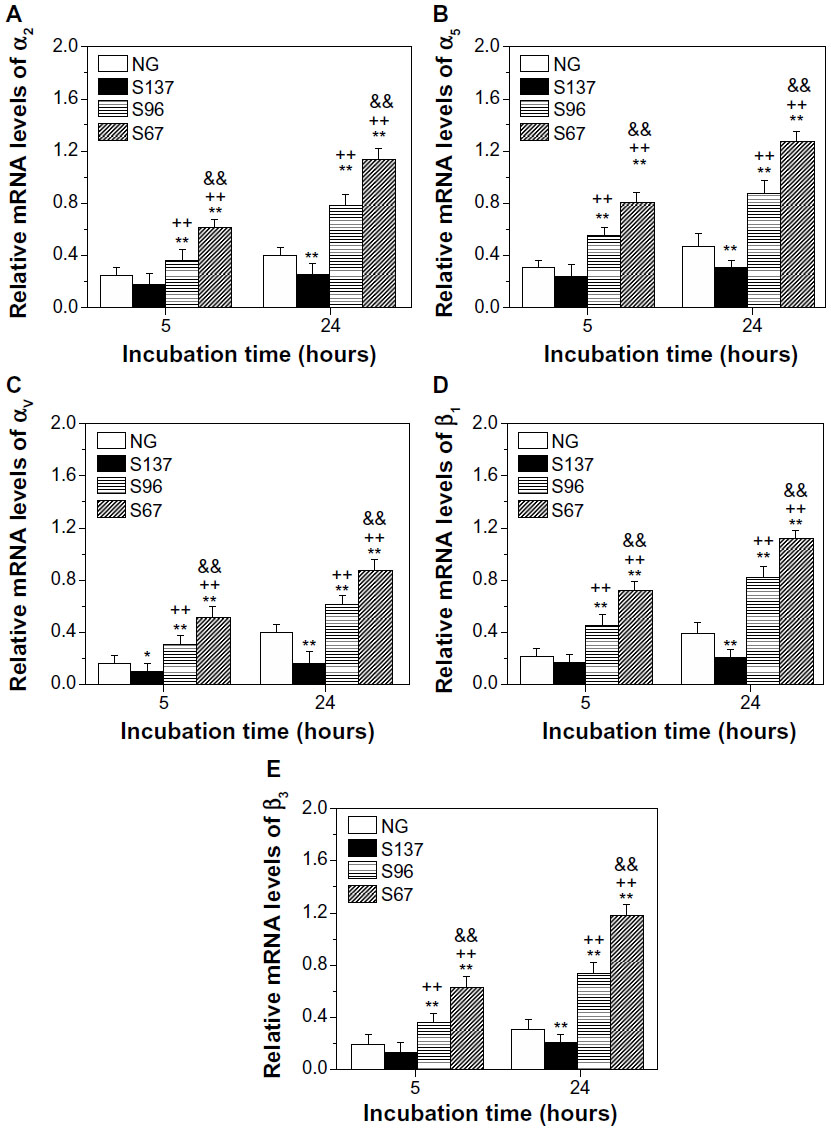 | Figure 8 (A) α2, (B) α5, (C) αv, (D) β1, and (E) β3 gene expression of osteoblasts on the coatings after 5 and 24 hours of incubation in serum-free DMEM-12. |
In the literature, emerging data demonstrate that surface topographies modulate integrin and in turn mediate downstream behavior of cells, such as adhesion, proliferation, and differentiation;23,24,40–49 however, the mechanism by which topography affects integrin is not clear. Although the cell adhesion result, reported by Lim et al, performing on nanoscale pits in the presence of serum, suggested that nanotopography affects cell behavior via a direct mechanism, they cannot rule out the possibility that serum protein adsorption on nanotopographies may play a role in nanotopography regulation of cell behavior.42 Our study is the first demonstration, in the absence of serum, that the number of adherent osteoblasts, cell-secreted anchoring proteins (fibronectin, vitronectin, and collagen), vinculin and FAK denoted FA, and gene expression of vinculin, FAK, and integrin subunits, undergo significant changes with variation in the internanorod spacing and dimensionality of Sr1-HA nanotopographies.It clearly indicates that 3D nanotopography can modulate cell adhesion via a direct mechanism (cell–material interactions) rather than via indirect mechanisms (cell-adsorbed protein–material interactions).
As regards to integrin, we demonstrate that in both cases of the absence and presence of serum, the nanorods’ patterned 3D topographies with different interrod spacing can affect integrin expression compared to the nanogranulated 2D topography under the same surface chemistry and roughness, although the mechanism by which this occurs is yet not clear. However, our results clearly show that upregulation or downregulation of vinculin and FAK gene expression (Figure 7) and FA contact (Figures 5 and 6) on the nanorod-patterned topographies reveal the same trend as α2, α5, αv, β1, and β3 integrin subunits (Figure 8) with varying interrod spacing in the absence of serum. These results suggest that the variation of FAK activation and FA contact on the nanorod-patterned topographies may originate from interrod spacing-dependent change in integrins. On the other hand, osteoblasts can, in the absence of serum, secrete fibronectin, vitronectin, and collagen proteins to form ECM on the Sr1-HA nanorods and nanogranulate-patterned coatings within 24 hours of incubation, and the proteins’ secretion strongly depends on surface topographies. The nanotopography-induced variation in the secretion of fibronectin, vitronectin, and collagen in the absence of serum is very similar to that of α2, α5, αv, β1, and β3 integrin subunits (Figures 3 and 8). This result suggests that integrins may mediate the secretion of these anchoring proteins. As known, the pairing of integrin subunits dictates specificity for ECM ligands. For example, αvβ3 binds to a number of ligands, including fibronectin, vitronectin, and fibrinogen;5,6 α5β1 is an important fibronectin-specific integrin versus αvβ3;44,50,51 and α2β1 binds to collagen.5,52,53 It is reasonable to speculate a direct mechanism by which nanotopographies mediate cell adhesion as follows: the cell stimulatory effect of nanotopographies may be achieved by regulating integrins that subsequently mediate the secretion of the anchoring proteins and results in the recruitment of vinculin to focal adhesion complexes, as well as activation of FAK and further downstream signaling events, while nanotopography-modulated integrins form structural and functional bridges between the ECM and cytoskeletal linker proteins though FA contact, provide anchorage forces, and transmit chemical and mechanical signals from the ECM through the cytoskeleton to the nucleus.
Counting assay shows that the adhesion of osteoblasts is enhanced on the S67 and S96 coatings, but is inhibited on the S137 coating compared to the NG coating in the presence of serum (Figure S2A). Generally, the type, amount, and conformation of the adsorbed protein from serum onto a material influences cell adhesion.37,38 It has been recognized that more hydrophilic surfaces lead the adsorbed fibronectin and vitronectin to be in a more bioactive conformation, specific for cell adhesion.26,54,55 Based on the superior hydrophilicity of the S137 coating to the NG coating, it is reasonable to speculate that the adsorbed fibronectin and vitronectin on the S137 coating are specific and in a more bioactive conformation compared to on the NG coating. Simultaneously, the adsorption amounts of fibronectin and vitronectin are higher on the S137 coating than on the NG coating in the presence of serum (Figure 2). These results further suggest that the reduced cell adhesion on the S137 coating is independent of protein adsorption. The reason for the difference in cell adhesion on the nanorod-patterned topographies is thought to be related to interrod spacing. It has been reported that the spacing between integrin ligands plays an important role in the formation of focal adhesion, which is dependent on the local order of ligand arrangement on a substrate.56–59 For an ordered pattern, integrin ligands with a lateral spacing larger than 70 nm inhibited focal adhesion formation and cell spreading.57,58 However, recent work from Spatz et al56 and Huang et al59 revealed that a disordered ligand pattern clearly leads to more integrin clustering than a corresponding ordered one when the average inter-ligand spacing is above 70 nm. Only slight variations in cell morphology and density could be found on disordered patterns even if the spacing increased to 92 nm as compared to 50 nm.56,59 In the present work, the Sr1-HA nanorods are randomly oriented with a disordered pattern (Figure 1). Therefore, more focal adhesions are observed on the 67.3±3.8 nm spaced nanorod-patterned topography (S67 coating) compared to the 95.7±4.2 nm spaced nanorod-patterned topography (S96 coating), while few focal adhesions are visible on the 136.8±8.7 nm spaced nanorod-patterned topography (S137 coating), as presented in Figures 5, 6, S3, and S4. Synergistically taking into consideration the dependence of focal adhesion, anchoring proteins’ secretion, and integrin expression to interrod spacing, this combination in turn promotes cell adhesion on the 67.3±3.8 and 95.7±4.2 nm spaced nanorod-patterned topographies, while inhibiting cell adhesion on the 136.8±8.7 nm spaced nanorod-patterned topography compared to the nanogranulated 2D topography.
Furthermore, we demonstrate that the variation in the number of adherent cells, cell-secreted anchoring proteins, vinculin and FAK denoted focal adhesion contact, and gene expression of the vinculin, FAK, and integrin subunits with the inter-nanorod spacing and dimensionality of Sr1-HA nanotopographies show a similar trend in the presence of serum to that in the absence of serum. However, the number of adherent cells, cell-secreted anchoring proteins, vinculin and FAK denoted focal adhesion contacts, and gene expressions of vinculin, FAK and integrin subunits are, to some extent, increased on the coatings in the presence of serum compared to in the absence of serum, suggesting that protein adsorption can also play an accessory role in mediating cell adhesion in the case of 3D nanotopographies with interrod spacing <96 nm.
Conclusion
Firmly adhered Sr1-HA 3D nanorods (with interrod spacing of 67.3±3.8, 95.7±4.2, and 136.8±8.7 nm) and 2D nanogranulate-patterned coatings have been prepared on titanium. Under the same surface chemistry and roughness in the absence of serum, investigations of the role of Sr1-HA nanotopographies in the regulation of osteoblast adhesion reveal that the number of adherent cells, cell-secreted anchoring proteins (fibronectin, vitronectin, and collagen), vinculin and FAK denoted focal adhesion contact, and gene expression of vinculin, FAK, and integrin subunits (α2, α5, αv, β1, and β3), undergo significant changes with variation in inter-nanorod spacing and dimensionality of Sr1-HA nanotopographies. They are significantly enhanced on the <96 nm spaced nanorod-patterned 3D topographies and more pronounced with decreasing interrod spacing, but inhibited on the >96 nm spaced nanorods compared to the nanogranulated 2D topography. Although the adsorption of fibronectin and vitronectin from serum are higher on 136.8±8.7 nm spaced nanorod-patterned topography than for nanogranulated topography, cell adhesion is inhibited on the former compared to the latter in the presence of serum, further suggesting that reduced cell adhesion is independent of protein adsorption. This work clearly indicates that 3D nanotopography can directly modulate cell adhesion by regulating integrins, which subsequently mediates the secretion of anchoring proteins and the formation of focal adhesion rather than protein adsorption. It is also suggested that protein adsorption plays an accessory role in mediating cell adhesion in the case of 3D nanotopographies with interrod spacing <96 nm. Our work provides insight into the surface structural design of a biomedical implant favoring osteointegration.
Acknowledgments
We appreciate the National Program on Key Basic Research Project (973 Program) of China (Grant number 2012CB619103), and National Natural Science Foundation of China (Grant number 51071120, 51371137) for financially supporting this work.
Disclosure
The authors report no conflicts of interest in this work.
References
Anselme K. Osteoblast adhesion on biomaterials. Biomaterials. 2000;21(7):667–681. | |
Liu XM, Lim JY, Donahue HJ, Dhurjati R, Mastro AM, Vogler EA. Influence of substratum surface chemistry/energy and topography on the human fetal osteoblastic cell line hFOB 1.19: phenotypic and genotypic responses observed in vitro. Biomaterials. 2007;28(31):4535–4550. | |
Geiger B, Spatz JP, Bershadsky AD. Environmental sensing through focal adhesions. Nat Rev Mol Cell Biol. 2009;10(1):21–33. | |
Geiger B, Bershadsky A, Pankov R, Yamada KM. Transmembrane crosstalk between the extracellular matrix and the cytoskeleton. Nat Rev Mol Cell Biol. 2001;2(11):793–805. | |
Hynes RO. Integrins: bidirectional, allosteric signaling machines. Cell. 2002;110(6):673–687. | |
Liddington RC, Ginsberg MH. Integrin activation takes shape. J Cell Biol. 2002;158(5):833–839. | |
Garcia AJ. Get a grip: integrins in cell-biomaterial interactions. Biomaterials. 2005;26(36):7525–7529. | |
Divya RV, Vinoth-Kumar L, Anitha VC, Manzoor K, Deepthy M, Shantikumar VN. Osteointegration of titanium implant is sensitive to specific nanostructure morphology. Acta Biomater. 2012;8(5):1976–1989. | |
Heydarkhan-Hagvall S, Gluck JM, Delman C, et al. The effect of vitronectin on the differentiation of embryonic stem cells in a 3D culture system. Biomaterials. 2012;33(7):2032–2040. | |
Miron RJ, Oates CJ, Molenberg A, Dard M, Hamilton DW. The effect of enamel matrix proteins on the spreading, proliferation and differentiation of osteoblasts cultured on titanium surfaces. Biomaterials. 2010;31(3):449–460. | |
Sugita Y, Ishizaki K, Iwasa F, et al. Effects of pico-to-nanometer-thin TiO2 coating on the biological properties of microroughened titanium. Biomaterials. 2011;32(33):8374–8384. | |
Lim JY, Shaughnessy MC, Zhou Z, Noh H, Vogler EA, Donahue HJ. Surface energy effects on osteoblast spatial growth and mineralization. Biomaterials. 2008;29(12):1776–1784. | |
Setzer B, Bachle M, Metzger MC, Kohal RJ. The gene-expression and phenotypic response of hFOB 1.19 osteoblasts to surface-modified titanium and zirconia. Biomaterials. 2009;30(6):979–990. | |
Dolatshahi-Pirouz A, Jensen T, Kraft DC, et al. Fibronectin adsorption, cell adhesion, and proliferation on nanostructured tantalum surfaces. ACS Nano. 2010;4(5):2874–2882. | |
Kuo SW, Lin HI, Ho JH, et al. Regulation of the fate of human mesenchymal stem cells by mechanical and stereo-topographical cues provided by silicon nanowires. Biomaterials. 2012;33(20):5013–5022. | |
Liu J, Wang XD, Jin QM, et al. The stimulation of adipose-derived stem cell differentiation and mineralization by ordered rod-like fluorapatite coatings. Biomaterials. 2012;33(20):5036–5046. | |
Okada S, Ito H, Nagai A, Komotori J, Imai H. Adhesion of osteoblast-like cells on nanostructured hydroxyapatite. Acta Biomater. 2010;6(2):591–597. | |
Zhao LZ, Hu LS, Huo KF, Zhang YM, Wu ZF, Chu PK. Mechanism of cell repellence on quasi-aligned nanowire arrays on Ti alloy. Biomaterials. 2010;31(32):8341–8349. | |
Lee J, Chu BH, Chen KH, Ren F, Lele TP. Randomly oriented, upright SiO2 coated nanorods for reduced adhesion of mammalian cells. Biomaterials. 2009;30(27):4488–4493. | |
Park JK, Kim YJ, Yeom J, et al. The topographic effect of zinc oxide nanoflowers on osteoblast growth and osseointegration. Adv Mater. 2010;22(43):4857–4861. | |
Brammer KS, Choi C, Frandsen CJ, Oh S, Jin S. Hydrophobic nanopillars initiate mesenchymal stem cell aggregation and osteo-differentiation. Acta Biomater. 2011;7(2):683–690. | |
Loya MC, Brammer KS, Choi C, Chen LH, Jin S. Plasma-induced nanopillars on bare metal coronary stent surface for enhanced endothelialization. Acta Biomater. 2010;6(12):4589–4595. | |
Lord MS, Fossb M, Besenbacher F. Influence of nanoscale surface topography on protein adsorption and cellular response. Nano Today. 2010;5(1):66–78. | |
Mendonça G, Mendonça DB, Aragão FJ, Cooper LF. Advancing dental implant surface technology – from micron- to nanotopography. Biomaterials. 2008;29(28):3822–3835. | |
Lim JY, Hansen JC, Siedlecki CA, Runt J, Donahue HJ. Human foetal osteoblastic cell response to polymer-demixed nanotopographic interfaces. J R Soc Interface. 2005;2(2):97–108. | |
Webster TJ, Schadler LS, Siegel RW, Bizios R. Mechanisms of enhanced osteoblast adhesion on nanophase alumina involve vitronectin. Tissue Eng. 2001;7(3):291–301. | |
Webster TJ, Ejiofor JU. Increased osteoblast adhesion on nanophase metals: Ti, Ti6Al4V, and CoCrMo. Biomaterials. 2004;25(19):4731–4739. | |
Huang R, Lu SM, Han Y. Role of grain size in the regulation of osteoblast response to Ti-25Nb-3Mo-3Zr-2Sn alloy. Colloids Surf B Biointerfaces. 2013;111C:232–241. | |
Gupta D, Venugopal J, Mitra S, Dev VR, Ramakrishna S. Nanostructured biocomposite substrates by electrospinning and electrospraying for the mineralization of osteoblasts. Biomaterials. 2009;30(11):2085–2094. | |
Jang JH, Castano O, Kim HW. Electrospun materials as potential platforms for bone tissue engineering. Adv Drug Delivery Rev. 2009;61(12):1065–1083. | |
Yan J, Sun JF, Chu PK, Han Y, Zhang YM. Bone integration capability of a series of strontium containing hydroxyapatite coatings formed by micro-arc oxidation. J Biomed Mater Res A. 2013;101(9):2465–2480. | |
Li YF, Li Q, Zhu SS, et al. The effect of strontium-substituted hydroxyapatite coating on implant fixation in ovariectomized rats. Biomaterials. 2010;31(34):9006–9014. | |
Han Y, Sun JF, Huang X. Formation mechanism of HA-based coatings by micro-arc oxidation. Electrochem Commun. 2008;10(4):510–513. | |
Han Y, Chen DH, Zhang L. Nanocrystallized SHA/SHA-SrTiO3/SrTiO3-TiO2 multilayer coatings formed by micro-arc oxidation for photocatalytic application. Nanotechnology. 2008;19:335705. | |
Han Y, Zhou JH, Zhang L, Xu KW. A multi-scaled hybrid orthopedic implant: bone ECM-shaped Sr-HA nanofibers on the microporous walls of a macroporous titanium scaffold. Nanotechnology. 2011;22:275603. | |
Zhou JH, Li B, Lu SM, Zhang L, Han Y. Regulation of osteoblast proliferation and differentiation by interrod spacing of Sr-HA nanorods on microporous titania coatings. ACS Appl Mater Interfaces. 2013;5(11):5358–5365. | |
Sousa SR, Lamghari M, Sampaio P, Moradas-Ferreira P, Barbosa MA. Osteoblast adhesion and morphology on TiO2 depends on the competitive preadsorption of albumin and fibronectin. J Biome Mate Res A. 2008;84(2):281–290. | |
Pei J, Hall H, Spencer ND. The role of plasma proteins in cell adhesion to PEG surface-density-gradient modified titanium oxide. Biomaterials. 2011;32(34):8968–8978. | |
Chou L, Firth JD, Uitto VJ. Substratum surface topography alters cell shape and regulates fibronectin mRNA level, mRNA stability, secretion and assembly in human fibroblasts. J Cell Sci. 1995;108(Pt4):1563–1573. | |
Yim EK, Darling EM, Kulangara K, Guilak F, Leong KM. Nanotopography-induced changes in focal adhesions, cytoskeletal organization, and mechanical properties of human mesenchymal stem cells. Biomaterials. 2010;31(6):1299–1306. | |
Seo CH, Jeong H, Furukawa KS, Suzuki Y, Ushida T. The switching of focal adhesion maturation sites and actin filament activation for MSCs by topography of well-defined micropatterned surfaces. Biomaterials. 2013;34(7):1764–1771. | |
Lim JY, Dreiss AD, Zhou Z, et al. The regulation of integrin-mediated osteoblast focal adhesion and focal adhesion kinase expression by nanoscale topography. Biomaterials. 2007;28(10):1787–1797. | |
Matschegewski C, Staehlke S, Loeffler R, et al. Cell architecture-cell function dependencies on titanium arrays with regular geometry. Biomaterials. 2010;31(22):5729–5740. | |
Martino MM, Mochizuki M, Rothenfluh DA, Rempel SA, Hubbell A, Barker TH. Controlling integrin specificity and stem cell differentiation in 2D and 3D environments through regulation of fibronectin domain stability. Biomaterials. 2009;30(6):1089–1097. | |
Olivares-Navarrete R, Raz P, Zhao G, et al. Integrin α2β1 plays a critical role in osteoblast response to micron-scale surface structure and surface energy of titanium substrates. Proc Natl Acad Sci U S A. 2008;105(33):15767–15772. | |
Khang D, Choi J, Im YM, et al. Role of subnano-, nano- and submicron-surface features on osteoblast differentiation of bone marrow mesenchymal stem cells. Biomaterials. 2012;33(26):5997–6007. | |
Altrock E, Muth CA, Klein G, Spatz JP, Lee-Thedieck C. The significance of integrin ligand nanopatterning on lipid raft clustering in hematopoietic stem cells. Biomaterials. 2012;33(29):3107–3118. | |
Huang Z, Newcomb CJ, Zhou Y, et al. The role of bioactive nanofibers in enamel regeneration mediated through integrin signals acting upon C/EBPα and c-Jun. Biomaterials. 2013;34(13):3303–3314. | |
Wang W, Zhao LZ, Wu KM, et al. The role of integrin-linked kinase/β-catenin pathway in the enhanced MG63 differentiation by micro/nano-textured topography. Biomaterials. 2013;34(3):631–640. | |
Lee MH, Ducheyne P, Lynch L, Boettiger D, Composto RJ. Effect of biomaterial surface properties on fibronectin–α5β1 integrin interaction and cellular attachment. Biomaterials. 2006;27(9):1907–1916. | |
Larsen M, Artym VV, Green A, Yamada KM. The matrix reorganized: extracellular matrix remodeling and integrin signaling. Curr Opin Cell Biol. 2006;18(5):463–471. | |
Woo KM, Jun JH, Chen VJ, et al. Nano-fibrous scaffolding promotes osteoblast differentiation and biomineralization. Biomaterials. 2007;28(2):335–343. | |
Krishna OD, Jha AK, Jia X, Kiick KL. Integrin-mediated adhesion and proliferation of human MSCs elicited by a hydroxyproline-lacking, collagen-like peptide. Biomaterials. 2011;32(27):6412–6424. | |
Webster TJ, Ergun C, Doremus RH, Siegel RW, Bizios R. Specific proteins mediate enhanced osteoblast adhesion on nanophase ceramics. J Biomed Mater Res. 2000;51(3):475–483. | |
Keselowsky BG, Collard DM, Garcia AJ. Surface chemistry modulates fibronectin conformation and directs integrin binding and specificity to control cell adhesion. J Biomed Mater Res A. 2003;66(2):247–259. | |
Deeg JA, Louban I, Aydin D, Selhuber-Unkel C, Kessler H, Spatz JP. Impact of local versus global ligand density on cellular adhesion. Nano Lett. 2011;11(4):1469–1476. | |
Arnold M, Cavalcanti-Adam EA, Glass R, et al. Activation of integrin function by nanopatterned adhesive interfaces. Chemphyschem. 2004;5(3):383–388. | |
Girard PP, Cavalcanti-Adam EA, Kemkemer R, Spatz JP. Cellular chemomechanics at interfaces: sensing, integration and response. Soft Matter. 2007;3(3):307–326. | |
Huang JH, Grater SV, Corbellini F, et al. Impact of order and disorder in RGD nanopatterns on cell adhesion. Nano Lett. 2009;9(3):1111–1116. |
Supplementary materials
 | Figure S1 Fluorescence images of (A) fibronectin and (B) vitronectin secreted by osteoblasts into ECM on the NG, S137, S96, and S67 coatings after 24 hours of incubation in serum-containing DMEM. (C) Collagen secretion in ECM by osteoblasts on the coatings after 5 and 24 hours of incubation in serum-containing DMEM. |
 | Figure S2 (A) Counting and (B) MTT assays of osteoblasts on the NG, S137, S96, and S67 coatings after 1, 5, and 24 hours of incubation in serum-containing DMEM. (C) Morphologies of cells on the coatings after 1 hour of incubation in serum-containing DMEM; the inserts are corresponding magnified images. |
 | Figure S3 Vinculin (green), actin (red), and nucleus (blue) fluorescence images of osteoblasts on the (A) NG, (B) S137, (C) S96, and (D) S67 coatings after 24 hours of incubation in serum-containing DMEM. |
| Figure S4 FAK (green), actin (red), and nucleus (blue) fluorescence images of osteoblasts on the (A) NG, (B) S137, (C) S96, and (D) S67 coatings after 24 hours of incubation in serum-containing DMEM. |
 | Figure S5 (A) Vinculin and (B) FAK gene expression of osteoblasts on the coatings after 5 and 24 hours of incubation in serum-containing DMEM. |
 | Figure S6 (A) α2, (B) α5, (C) αv, (D) β1, and (E) β3 gene expression of osteoblasts on the coatings after 5 and 24 hours of incubation in serum-containing DMEM. |
 © 2014 The Author(s). This work is published and licensed by Dove Medical Press Limited. The full terms of this license are available at https://www.dovepress.com/terms.php and incorporate the Creative Commons Attribution - Non Commercial (unported, v3.0) License.
By accessing the work you hereby accept the Terms. Non-commercial uses of the work are permitted without any further permission from Dove Medical Press Limited, provided the work is properly attributed. For permission for commercial use of this work, please see paragraphs 4.2 and 5 of our Terms.
© 2014 The Author(s). This work is published and licensed by Dove Medical Press Limited. The full terms of this license are available at https://www.dovepress.com/terms.php and incorporate the Creative Commons Attribution - Non Commercial (unported, v3.0) License.
By accessing the work you hereby accept the Terms. Non-commercial uses of the work are permitted without any further permission from Dove Medical Press Limited, provided the work is properly attributed. For permission for commercial use of this work, please see paragraphs 4.2 and 5 of our Terms.