")
Back to Journals » International Journal of Nanomedicine » Volume 17
Direct Detection of Pulmonary Fibrosis by Near-Infrared-Responsive Biomimetic Platelets
Authors Li G, He H, Zheng G, Jiang W, Du S, Tao H, Xiao T, Zhou D, Ding S, Yu XY, Zhang Y, Shen A
Received 22 August 2021
Accepted for publication 24 December 2021
Published 10 January 2022 Volume 2022:17 Pages 151—162
DOI https://doi.org/10.2147/IJN.S334331
Checked for plagiarism Yes
Review by Single anonymous peer review
Peer reviewer comments 4
Editor who approved publication: Dr Yan Shen
Guanlie Li,1,* Haiqing He,1,* Guodong Zheng,1,* Wenjing Jiang,1 Shuwen Du,1 Hua Tao,1 Tao Xiao,1 Dazhi Zhou,2 Shangwei Ding,2 Xi-Yong Yu,1 Yu Zhang,1 Ao Shen1
1Key Laboratory of Molecular Target & Clinical Pharmacology, School of Pharmaceutical Sciences, The Fifth Affiliated Hospital, Guangzhou Medical University, Guangzhou, People’s Republic of China; 2Department of Ultrasound, The First Affiliated Hospital, Guangzhou Medical University, Guangzhou, People’s Republic of China
*These authors contributed equally to this work
Correspondence: Ao Shen; Yu Zhang Tel +86 20 3110 0902
; +86 20 3710 3275
Email [email protected]; [email protected]
Background: Pulmonary fibrosis (PF) is a fatal lung disease and affects over 5 million patients worldwide. Precise and early detection of PF is of pivotal importance to slow the disease progression. However, there are currently no effective tools to detect PF directly.
Purpose: This study aimed to develop an imaging modality to detect PF directly. Excessive collagen deposition is the hallmark of PF. Herein, we developed a novel PF diagnostic agent, namely PVD (platelets-derived nanovesicles labeled with dye), by utilizing near-infrared (NIR)-responsive biomimetic platelets that specifically recognize collagen.
Methods: In brief, platelets membrane was extracted from purified platelets by freeze/thaw and formed to PVD nanovesicles via sonication and extrusion, when loaded with DiR dye. Red blood cells membrane loaded with DiR was prepared in the same way as PVD to form RVD as control. Collagen self-assembled on microplates was used as an in vitro collagen fibrils model and monocrotaline-induced rats were used as an in vivo PF model.
Results: We demonstrated that PVD, but not RVD nor other controls, could bind collagen both in vitro and in vivo, and directly detect pulmonary fibrosis in vivo and ex vivo at the early PF stage.
Conclusion: Collectively, PVD is a versatile NIR-responsive probe for the direct visualization of collagen, and can be particularly helpful in direct detecting PF. To the best of our knowledge, PVD is the first report of a NIR probe for the direct detection of pulmonary fibrosis.
Keywords: pulmonary fibrosis, collagen, platelets, imaging diagnosis, near-infrared
Introduction
Affecting more than 5 million people globally, pulmonary fibrosis (PF) is a fatal lung disease with a prognosis of 50% mortality in 3–5 years after diagnosis.1,2 PF is characterized by extensive scarring of the lung over time, due to excess deposition of collagen in the extracellular matrix, malfunctions of pulmonary cells, and loss of normal lung architecture. These changes lead to poor lung function and ultimately, respiratory failure.1 Most of the time, PF occurs without an obvious cause. In this case, it is termed idiopathic pulmonary fibrosis (IPF).2 PF is progressive and currently there is no cure for it. The main aim of medications and therapies for PF is to relieve symptoms and slow down progression.3 Thus, the earlier PF could be detected, the better prognosis would be achieved by slowing the course of the disease.
Unfortunately, the diagnosis of PF is mainly based on the patient’s medical history, symptoms, lung function tests and medical imaging through either chest X-ray or computed tomography (CT), all of which provide indirect evidence.2 Because the typical symptoms and imageology features of PF (eg, shortness of breath, dry cough, fatigue and inflammation) are too similar to other respiratory diseases (eg, the common cold, pneumonia or pulmonary embolism), the road to PF diagnosis is long and difficult, sometimes ends with misdiagnosis.2,4,5 At present, lung biopsy is the only way to provide direct and solid evidence to diagnose patients with PF. However, such an invasive procedure prevents lung biopsy from being used regularly, especially at PF’s early stage. Consequently, developing new detection methods is critically important to the precise and early diagnosis of PF.
Excessive collagen accumulation is the hallmark of fibrotic diseases and incites pathological changes during PF.1,2 Collagen thus becomes an ideal biomarker of PF and a promising target for diagnosis purpose. Although X-ray and CT can visualize the end results of collagen deposition (eg, reticular opacities and honeycombing), the direct visualization of collagen still requires lung biopsy histopathology. A handful of collagen-targeting probes have been developed for imaging assessment of fibrosis.6–9 However, certain limitations remain in those designs. All probes thus far are based on peptides, which are not only costly in synthesis but also easy to be cleared by the host immune system, resulting in low imaging efficiency. Moreover, those probes are intended for positron emission tomography (PET) or magnetic resonance imaging (MRI). Accordingly, their applications in routine diagnosis could be hampered by either radiation exposure risk (for PET) or limited information due to low-proton density (for MRI). Hence, developing an alternative collagen-targeting modality to overcome those obstacles is urgently demanded.
Platelets play a central role in hemostasis mainly by directly binding to the exposed collagen upon blood vessel injury, through specific collagen receptors on platelets membrane, such as glycoproteins GPVI and integrin α2β1.10 Thus, platelets are charming innate capturers for collagen. However, platelets cannot serve as a diagnostic agent directly, as collagen-binding triggers platelets activation, aggregation, and degranulation with the release of pro-inflammatory factors.10,11 Recently, we and other groups have shown that biomimetic nanovesicles with cell membrane coating share a lot of similarities with cell naturally-derived extracellular vesicles (eg, exosomes and microvesicles),12 such as long-circulating,13 ligand recognition14 and cancer targeting,15,16 because they retain surface proteins of the source cells. Notably, the platelet membrane-derived nanovesicles (PNVs), which include but are not limited to platelet membrane alone, platelet membrane hybrid with other types of cell membrane, and nanoparticles camouflaged by platelet membrane, do not promote blood clotting or platelet aggregation with or without the platelet “agonist” collagen.14,17 Meanwhile, studies also showed that PNVs successfully evaded detection by immune cells and were free-of inflammation.18,19 In short, those platelet-mimicking systems are shielded from the body’s immune responses and possess platelet-like binding properties by keeping the platelet adhesion molecules, without causing side effects such as blood clotting and inflammation.20 Thus, devoid of cytokines, biomimetic platelets-derived nanovesicles can provide a collagen-targeting platform without platelets activation and thrombosis.14,17–20
Inspired by these findings, herein we developed a novel imaging modality to detect PF via biomimetic platelets, namely PVD (platelets-derived nanovesicles labeled with dye). In brief, platelets membrane was extracted from purified platelets by freeze/thaw and formed to PVD nanovesicles via sonication and extrusion when loaded with near-infrared (NIR) dye DiR, which showed the long-emission-wavelength and non-invasive properties for diagnosis. Utilizing monocrotaline (MCT) rat model, a classical in vivo model of idiopathic pulmonary fibrosis and hypertension,21,22 we demonstrated that PVD could directly visualize collagen both in vitro and in vivo, and precisely detect PF. Collectively, PVD is a versatile NIR-responsive probe for the direct visualization of collagen, and can be particularly helpful in determining pulmonary fibrosis at the early stage. To the best of our knowledge, PVD is the first report of a NIR imaging probe for the direct detection of pulmonary fibrosis.
Materials and Methods
Animals
All animal studies were approved by the Institutional Animal Care and Use Committee of Guangzhou Medical University (Protocol GY2020-059) and performed in compliance with NIH guidelines for the care and use of laboratory animals. Sprague-Dawley (SD) rats were obtained from Charles River Laboratories and maintained in a pathogen-free facility. Pulmonary fibrosis in rats was induced by a single injection of MCT. In brief, MCT (T2803, Topscience, Shanghai, CN) was first dissolved in anhydrous ethanol and then diluted with saline (ethanol:saline = 2:8) to make 10 mg/mL MCT suspension. The suspension was bath-sonicated for 1 hour, shaken overnight at 37°C for full dissolving, and then filtered through 0.22 μm syringe filter. Filtered MCT solution was used for subcutaneous injection of rats (50 mg/kg), the same volume of saline was injected to control rats. Animals were kept under normoxic conditions up to 28 days after MCT administration. To monitor the disease progression of idiopathic pulmonary fibrosis, SD rats were randomly assigned into the following 4 groups: saline group (SHAM), MCT-induced for 2, 3 and 4 weeks (MCT-2W, MCT-3W and MCT-4W). MCT-treated rats were sacrificed at 14, 21 and 28 days post MCT administration, and sham rats were sacrificed at day-28.
Histological Staining and Analysis
After MCT induction for desired times, rats were anesthetized by an intraperitoneal injection of xylazine (8 mg/kg) and ketamine (60 mg/kg). The thoracic cavity was exposed with surgical scissors and the lung tissue was removed, flushed with chilled PBS and fixed for 24 hours in 4% paraformaldehyde solution (BL539A, Biosharp, Hefei, CN). After paraffin embedding, sectioning, and dewaxing, the sections of lung tissues were stained and visualized by Hematoxylin-Eosin, Masson’s Trichrome and Picro-Sirius red kits, according to the manufacturer’s instructions respectively (ab245880, ab150686, ab245887, Abcam, Cambridge, UK). Fibrotic tissue was quantified as the percentage of fibrotic area to the total area using Image-Pro Plus 6.0.
Collagen and Hydroxyproline (HYP) Assays
The expression of type I and III collagen major isoforms (Col1a1 and Col3a1) was detected by ELISA kits (E-EL-R0041c and E-EL-R0235c, Elabscience, Wuhan, CN). Five rats for each test group were used. In brief, 100 mg of frozen lung tissue of each rat was ground in liquid nitrogen and resuspended in 1mL PBS. After repeated freeze-thaw, homogenate supernatant was obtained by centrifugation at 5000 g for 5 minutes at 4°C. After that, standard ELISA procedure was carried out according to the manufacturer’s instruction and absorbance at 450 nm was measured by a Synergy LX microplate reader (BioTek, USA).
The hydroxyproline content in lung tissue homogenate was detected by a HYP assay kit (BC0255, Solarbio, Beijing, CN). Five rats for each test group were used. In brief, 200 mg of frozen lung tissue of each rat was cut into very small pieces and digested 4–6 hours at 110°C within 2 mL of digestion buffer. After adjusting pH to 6–8 and making total volume to 4 mL with sterile water, the supernatant was obtained by centrifugation at 16,000 rpm for 20 minutes at 25°C. After that, HYP concentration in the homogenate was determined according to the manufacturer’s instruction and absorbance at 560 nm was measured by a Synergy LX microplate reader (BioTek, USA).
Quantitative RT-PCR
Five MCT-4W PF rats and five control SHAM rats were used to determine the mRNA expression of collagen quantitatively. In brief, total RNA from lung homogenates of each rat was individually extracted using RNA Extraction Kit (AG21203, Accurate Biotechnology, Changsha, CN) and synthesized to cDNA by M-MLV reverse transcriptase (AG11711, Accurate Biotechnology). The real-time quantitative PCR (qPCR) analysis was performed on LightCycler 480 II system (Roche) using SYBR Green PCR mix (AG11701, Accurate Biotechnology). Relative expression levels were calculated and normalized to GAPDH. Primers used in this study are listed in Table 1.
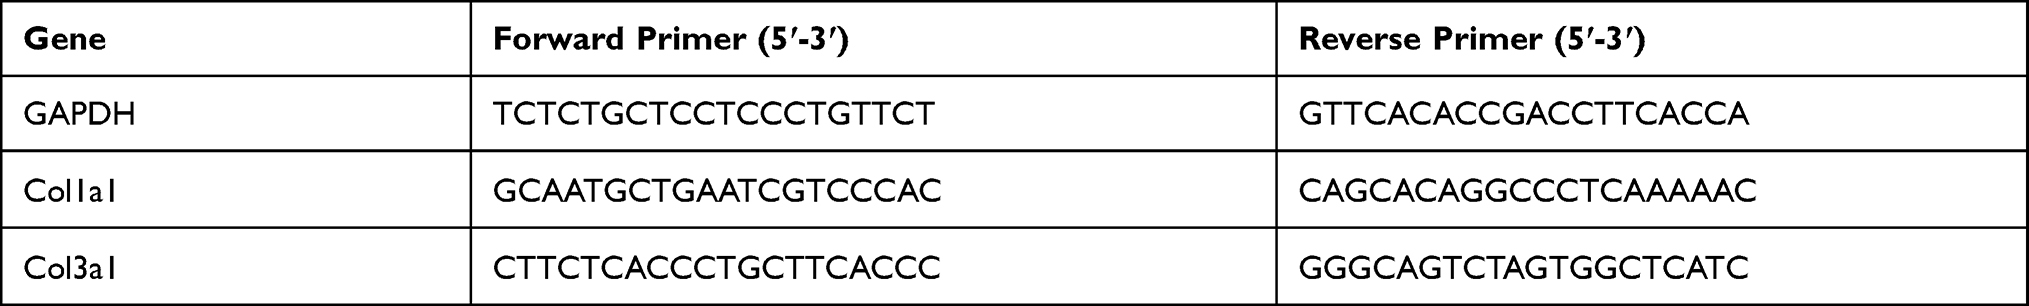 |
Table 1 Primers Used in the Study |
Preparation of Platelets and Red Cells Membranes
Isolation of platelets and generation of platelet membranes were performed as previously described with slight modification.14,17 The whole blood of SD rats with EDTA as an anticoagulant was centrifuged at 1000 rpm for 10 minutes at 4°C to obtain platelet-rich plasma (PRP) and red cells (RCs) separately. PRP was further centrifuged at 1500 rpm for 5 minutes at 4°C, to obtain pure PRP by pelleting residual red and white blood cells. Meanwhile, RCs were resuspended by RM buffer (PBS containing 2 mM EDTA and protease inhibitors) and centrifuged the same as PRP to obtain pure RCs by discarding the upper layer. After being mixed with PM buffer (PBS containing 0.2 μM Prostaglandin E1 and protease inhibitors), pure PRP was centrifuged at 3500 rpm for 20 minutes at room temperature to obtain platelets. Pelleted platelets were resuspended in PM buffer and freeze/thaw 3–5 times. Platelets membrane was extracted by centrifugation at 6000 rpm for 5 minutes at 4°C and washed twice with PM buffer. Meanwhile, pure RCs were resuspended in RM buffer and freeze/thaw 3–5 times. Red cells membrane was extracted by centrifugation at 12,000 rpm for 10 minutes at 4°C and washed twice with RM buffer. Platelets membrane suspended in PM buffer and red cells membrane suspended in RM buffer were sonicated 2 minutes under 100W power (10 s pulse with 10 s pause). After quantified by Pierce BCA Protein Assay Kit (23227, Thermo) for total protein concentration, purified membranes were aliquot and stored at −80°C. Platelets-derived nanovesicles (PV) and red cells-derived nanovesicles (RV) were prepared using purified membranes and a micro extruder (610000, Avanti).
Preparation and Characterization of PVD
Frozen platelets membrane was thawed at room temperature and vortex to mix. 0.5 mg membrane dissolved in 1 mL PBS was mixed with 50 μL 5 mM DiR dye (40757ES25, YEASEN, CN) and incubated at 37°C for 20 minutes. After washing by PBS 3 times and centrifuge at 6000 rpm for 5 minutes each time, DiR loaded membrane was resuspended in 1 mL PBS and sonicated for 2 minutes under 100 W power (10 s pulse with 10 s pause), and then use a micro extruder (610000, Avanti) to form PVD nanovesicles. Red cells membrane loaded with DiR was prepared in the same way as PVD to form RVD nanovesicles.
PVD diluted with PM buffer to a final concentration of 0.1 mg/mL were either measured by Zetasizer Nano ZS90 (Malvern Panalytical) for particle sizes (Size), dispersion coefficient (PDI) and Zeta potential (surface charge), or added to carbon-film-coated copper grids and air-dried at room temperature for transmission electron microscope (TEM) imaging by JEM-1400Plus (JEOL, Japan). PVD, PV and platelet cells (20 μg total protein each sample) together with molecular weight marker (PM5100, Smobio, CN) were analyzed by SDS-PAGE electrophoresis and Coomassie Brilliant Blue staining (P0017F, Beyotime, CN).
In vitro Collagen-Binding Test
In vitro collagen-binding assay was performed as previously described with slight modification.23 Type I collagen was prepared as three-dimensional fibril form according to the manufacturer’s instruction (C8062, Solarbio, Beijing, CN). In brief, 200 μL 5mg/mL rat tail tendon collagen, 690 μL sterile water, 12 μL 0.1M NaOH and 100 μL 10x PBS were sequentially mixed in an ice-chilled tube to make 1 mg/mL collagen solution and 100 μL of collagen solution was immediately added to 96-well plate for 20 minutes at room temperature. Coated plates were blocked with 2% BSA (A1933, Sigma) for 1 hour at room temperature, and then washed with PBS 3 times. DiR dye was used in the test and red blood cells membrane loaded with DiR (RVD) nanovesicles were used as an additional control. 100 μL of PVD (1 mg/mL), RVD (1 mg/mL), DiR (10 μM) or PBS was added to each well, with 4 repeats in each group, and incubated for 1 hour at room temperature with gentle shaking. After incubation, plates were washed by TBST 3 times. Retained nanoparticles bound with collagen were dissolved by 100 μL DMSO, and then the fluorescence intensity was measured by Synergy H1 microplate reader (Biotech, USA). To test the sensitivity of PVD to collagen, 25, 50, 100 or 200 μL of fresh collagen solution was added to 96-well plates to achieve different fibril densities, and pure PBS solution was used as a collagen-free control. The rest of the procedures was the same as aforementioned, except that 5 repeats in each group were done.
In vivo and ex vivo Pulmonary Fibrosis Detection
After pulmonary fibrosis was established, rats were anesthetized by an intraperitoneal injection of xylazine (8 mg/kg) and ketamine (60 mg/kg) and mounted in a supine position. The skin of the right neck was cut with surgical scissors, and the external jugular vein was exposed by bluntly detaching the muscle with forceps. 0.25 mg PVD, 0.25 mg RVD or 5 μg DIR were injected with a 1-mL syringe into the external jugular vein of MCT-induced rats. PBS and PVD were injected into SHAM rats as controls. The rats were kept under normoxic conditions for 8 hours, and in vivo fluorescence intensity was measured with IVIS Lumina XRMS Series III (PerkinElmer, USA). After in vivo imaging, the ex vivo fluorescence intensity of major organs was measured in the same way. Three rats for each test group were evaluated.
Statistical Analysis
All experiments were repeated independently at least 3 times. Data were analyzed by Prism 8.0 (GraphPad Software) and expressed as mean ± s.e.m. The normally distributed data were analyzed using two-tailed Student’s t test or one-way ANOVA followed by Dunnett post hoc test. For data not normally distributed, statistical analyses were performed using the non-parametric Kruskal–Wallis test. P < 0.05 was considered to be statistically significant.
Results
The Schematic of Study Design
This study aimed to develop a novel imaging modality for the direct detection of pulmonary fibrosis, through the innate collagen-targeting capability of platelets-derived nanovesicles (Figure 1). In brief, platelets were separated from the whole blood of SD rats by differential centrifugation, and red cells from the same source were used as control. By repeated freeze/thaw, intracellular components were released and pure platelets membrane was harvested, with collagen-targeting receptors and other innate surface proteins retained. Platelets membrane was then formed to biomimetic platelets PVD (platelets-derived nanovesicles labeled with dye) via sonication and extrusion when loaded with lipophilic fluorescent NIR dye DiR for in vitro and in vivo imaging. Utilizing the MCT-induced rat PF model, we demonstrated that PVD could directly visualize collagen both in vitro and in vivo, and precisely detect PF.
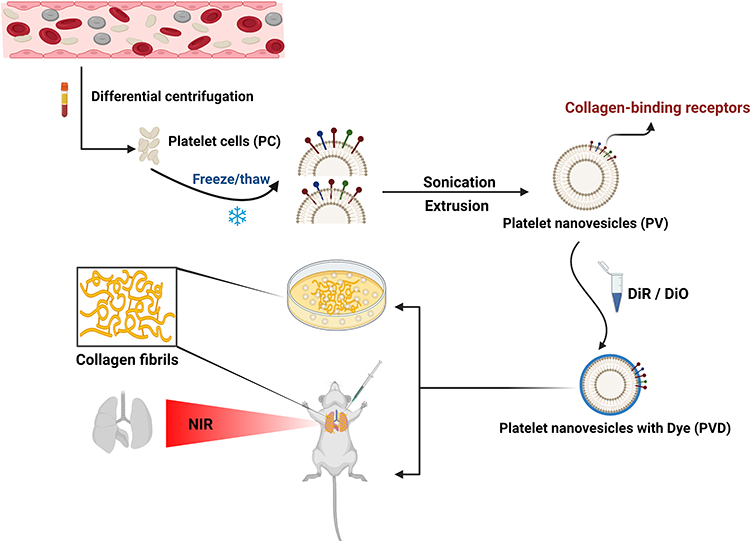 |
Figure 1 Schematic of the direct detection of pulmonary fibrosis by biomimetic platelets PVD. |
Preparation and Characterization of PVD
Platelets were obtained from the whole blood of SD rats by differential centrifugation. The light microscope showed that purified platelets have a typical round or oval shape (Figure 2A), indicating platelets were in good resting status. Platelets-derived nanovesicles (PV) and platelets-derived nanovesicles labeled with dye (PVD) were prepared following the details described in Materials and Methods. TEM analysis demonstrated that PVD had three-dimensional spherical and lipid-like properties (Figure 2B). Dynamic light scattering (DLS) showed that the size of PV and PVD was approximately 145.20 nm and 159.57 nm, respectively (Figure 2C). The zeta potential of PV was about −11 mV, while that of PVD changed to −9 mV after being loaded with DiR dye (Figure 2D). These data indicated that the stability of nanovesicles was not affected before and after loaded with DiR dye. To ensure that the membrane proteins of platelets were well retained on the surface of PV and PVD, SDS-PAGE electrophoresis was conducted. Both PV and PVD had similar Coomassie Blue staining patterns as platelet cells (PC), indicating that PV and PVD kept the whole proteins of the platelets membrane (Figure 2E). Furthermore, the consistency of PV and PVD meant that loading of DIR did not affect surface proteins.
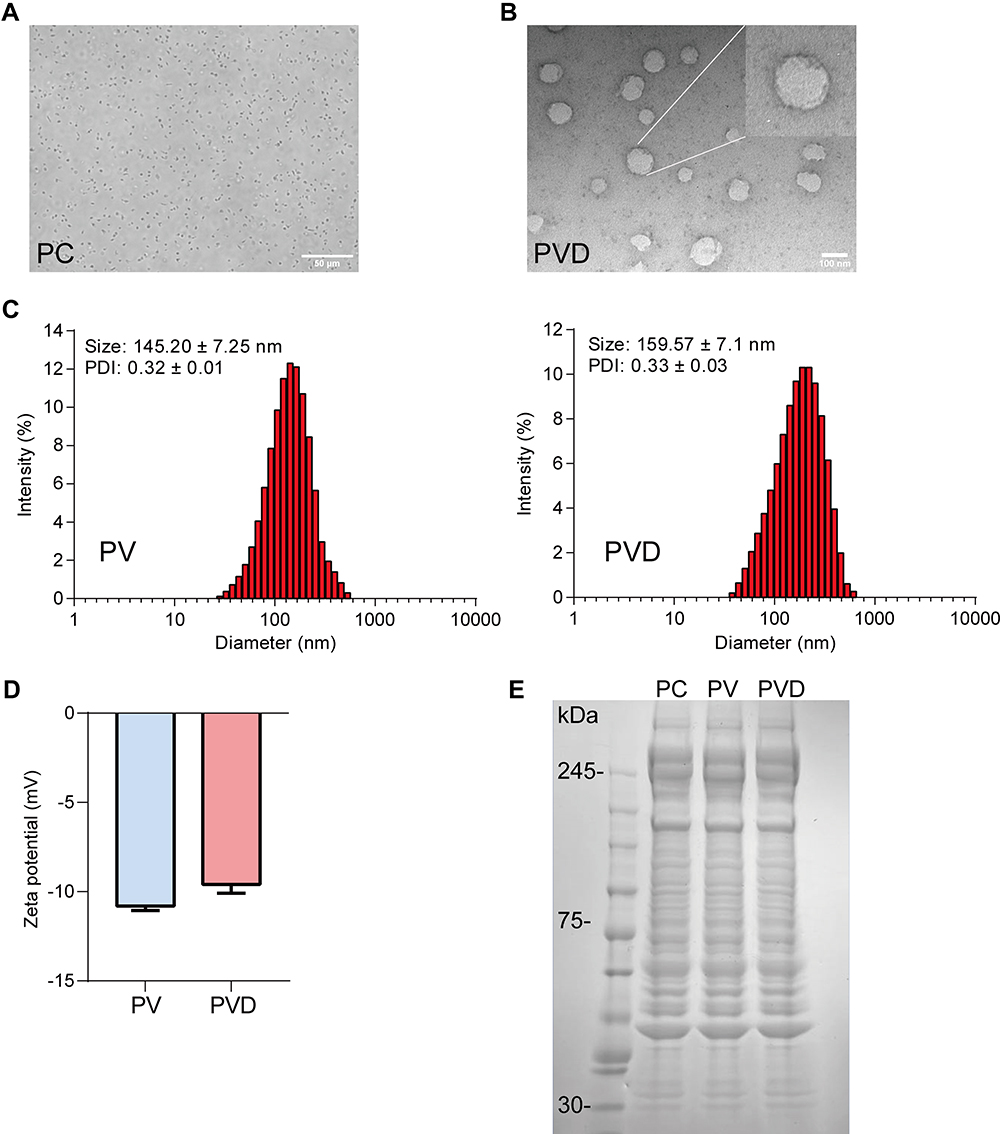 |
Figure 2 Characterization of PVD. (A) The morphology of purified platelets being observed under a light microscope. Scale bar = 50 μm. (B) TEM image of platelet-derived nanovesicles. Scale bar = 100 nm. (C) DLS analysis of PV and PVD. (D) Surface zeta potentials of PV and PVD (n=3). (E) SDS-PAGE analysis of surface proteins on PC, PV and PVD. Abbreviations: PC, platelet cells; PV, platelet-derived nanovesicles; PVD, platelets-derived nanovesicles labeled with dye. |
Characterization of MCT-Induced Pulmonary Fibrosis Model
To establish an in vivo PF model and to better characterize the progression of the disease, SD rats were subcutaneously injected with MCT solution (50 mg/kg) on the back of the neck and PF progression was analyzed 2, 3 and 4 weeks after MCT induction (Figure 3A). Lung tissue sections stained by HE, Masson’s Trichrome or Sirius red method showed that rats after 4-weeks of MCT-induction (MCT-4W) developed a pathological state with inflammatory infiltration and excessive collagen accumulation (Figure 3B). Quantification of fibrosis area (blue area in Masson’s staining) showed obvious fibrotic lesions after MCT induction (Figure 3C). Furthermore, quantitative RT-PCR showed that the mRNA expression of both type I and type III collagen in MCT-4W rats increased significantly, compared with that of control SHAM rats (Figure 3D and F). All these changes were consistent with the clinical characteristics of PF and previous reports.1,2,21–23 Consequently, these data confirmed that collagen was an ideal PF biomarker and a direct target for PF diagnosis.
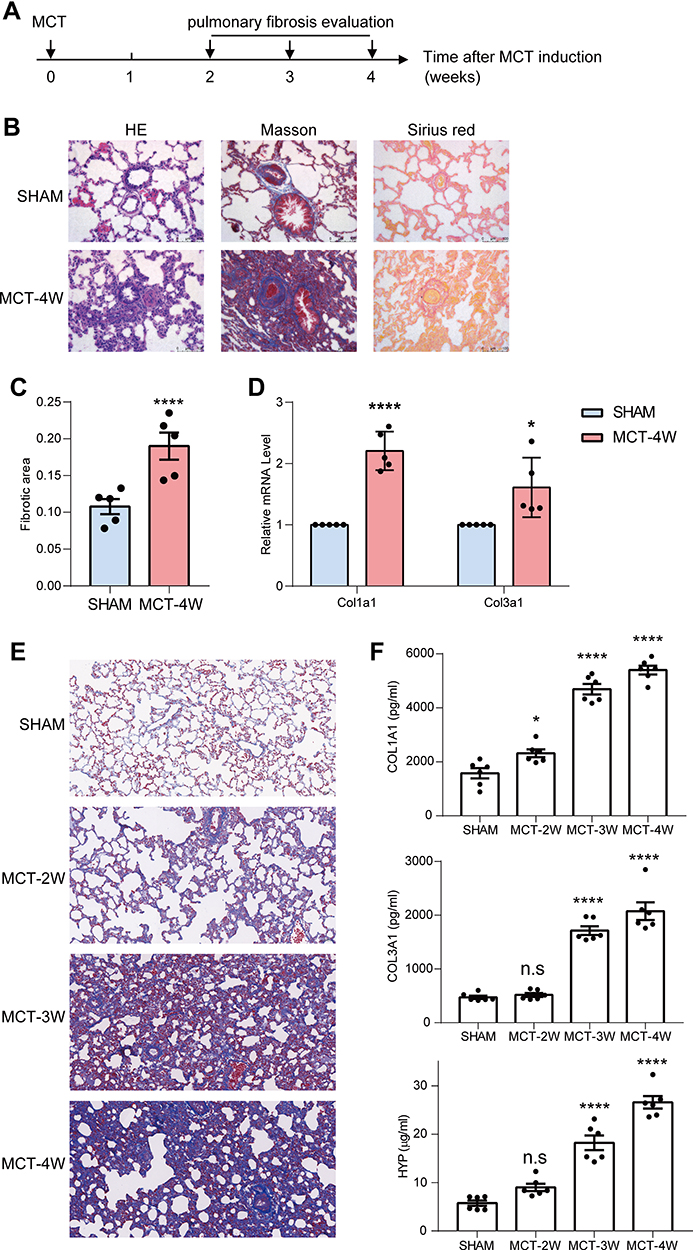 |
Figure 3 Characterization of a rat model of MCT-induced pulmonary fibrosis. (A) Schematic of the animal study to establish and monitor the disease progression of the PF rat model. (B) Representative tissue sections stained with HE, Masson’s Trichrome and Sirius red showed that rats with 4-weeks of MCT-induction displayed inflammatory infiltration and fibrosis in the lungs. Scale bar = 100 μm. (C) The quantitative analysis showed that the fibrosis area had increased significantly in MCT-4W rats (n=5). (D) The mRNA expression of type I and type III collagen was markedly up-regulated in MCT-4W rats (n=5). (E) Representative tissue sections stained with Masson’s Trichrome showed that rats with 2-, 3- and 4-weeks of MCT-induction displayed time-dependent increasing fibrosis in the lungs. (F) The collagen and hydroxyproline contents in lung homogenates of rats with 2-, 3- and 4-weeks of MCT-induction were determined (n=6). *P<0.05, ****Denote p < 0.0001, ns, not significant. Two-tailed Student’s t test in (C and D), and one-way ANOVA followed by Dunnett test in (F). |
We then compared the time course of effect over a 28-day period post-MCT administration and collected lung tissues from rats with 2-, 3- and 4-weeks of MCT-induction (MCT-2W, MCT-3W and MCT-4W). The progression of pulmonary fibrosis was determined by histological analysis and collagen quantification (Figure 3E and F). Results of collagen expression and HYP content demonstrated that there was no significant increase in collagen and HYP content for MCT-2W when compared with sham rats (Figure 3F). Starting from week 3 there was an increasing deposition of collagen and HYP, which accumulated more on week 4 (Figure 3F). The hydroxyproline (HYP) quantification is the most common method for evaluating the degree of collagen tissue metabolism and fibrosis. Thus, we defined MCT-3W as the early stage of pulmonary fibrosis based on collagen and HYP expressions.
In vitro Collagen-Targeting of PVD
To test the specific collagen-targeting ability of PVD, collagen-coated microplates were used to capture collagen-binding substrates. Type I collagen self-assembled to fibrils in microplate wells and was widely used as a biomimetic three-dimensional collagen model.24–26 In this experiment, PBS, DiR dye and red cells-derived nanovesicles labeled with DiR (RVD) were used as controls. PVD and controls were incubated in collagen-coated microplates for 1 hour and washed thoroughly. Afterward, the fluorescence intensity of substrates retained in microplates was measured. Compared to the PBS group, mean fluorescence in the PVD group was amplified more than 70-fold, while DiR and PVD groups had no statistical difference. Thus, only PVD showed strong and specific collagen association, while all controls including red cells-derived nanovesicles had minimal collagen-binding (Figure 4A). In addition, we also confirmed the binding of PVD to collagen in a dose-dependent manner in vitro (Figure 4B). These data confirmed that PVD could specifically and directly visualize collagen in vitro, while red cells membrane or lipophilic fluorescent dye alone did not have such ability.
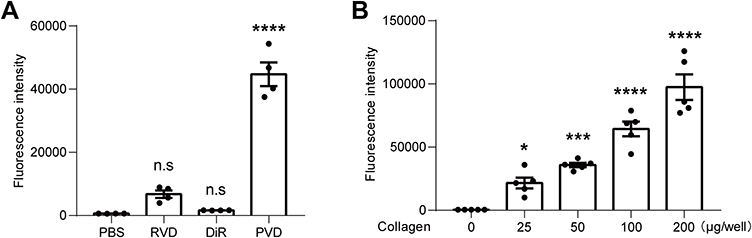 |
Figure 4 In vitro collagen-targeting tests of PVD. (A) PVD and three controls (PBS, DiR dye and RVD) were incubated in collagen-coated microplates and washed thoroughly. Afterward, the fluorescence intensity of substrates retained in microplates was measured. Only PVD showed strong and specific collagen association (n=4). (B) PVD was incubated in collagen-coated microplates with different collagen fibril densities, and pure PBS was used as a collagen-free control. The rest of the procedure was the same as in (A). PVD showed specific and dose-dependent collagen association (n=5). ns, not significant, *Denotes p < 0.05, ***Denotes p < 0.001 and ****Denotes p < 0.0001 by One-way ANOVA followed by Dunnett multiple comparisons test with PBS group. |
In vivo and ex vivo PF Detection by PVD
To demonstrate that PVD could directly visualize collagen in vivo and precisely detect PF, MCT-4W PF rats and control SHAM rats were injected with PVD, RVD or DiR through the external jugular vein. After administration, rats were kept under normoxic conditions for 8 hours, allowing nanovesicles or dyes to circulate and contact with collagen in the body.
In vivo fluorescence distribution showed that only PVD nanovesicles could target the fibrotic lungs of MCT-4W rats. While RVD nanovesicles and DiR dyes had no lung targeting at all, and they mainly accumulated in the liver or spleen of rats (Figure 5A). Meanwhile, PVD had no distribution in the normal lungs, but instead, accumulated in the liver of SHAM rats, further confirming the specificity of PVD to fibrotic lesions (Figure 5A).
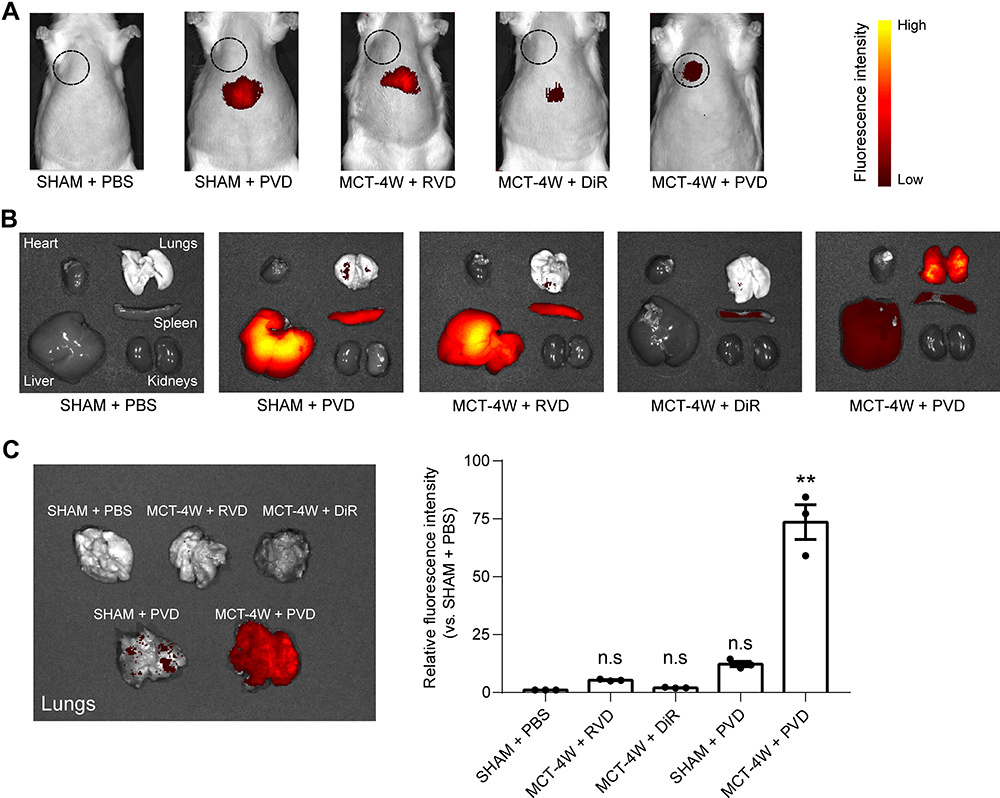 |
Figure 5 In vivo and ex vivo pulmonary fibrosis detection by PVD. (A) Representative images of fluorescence distribution in vivo of PF rats with 4-weeks of MCT-induction and SHAM rats when injected with PVD. The black dotted circle indicates the approximate location of the lungs. PBS, RVD and DiR dye were used as controls (n=3). (B) Representative images of ex vivo fluorescence of major organs isolated from the same rats used in (A) as indicated. (C) Quantification of ex vivo fluorescence intensity of lung tissues isolated from the same rats used in (A) as indicated (n=3). ns, not significant, **Denotes p < 0.01 by Kruskal–Wallis test followed by Dunn’s multiple comparisons with SHAM + PBS group. |
The major organs including the heart, liver, spleen, lungs and kidneys were then examined individually. Ex vivo fluorescence showed that in MCT-4W rats, PVD targeted fibrotic lungs drastically, with much less distribution in the liver and spleen (Figure 5B). Conversely, PVD only accumulated in the liver and spleen of SHAM rats, with minimal signal detected in the normal lungs (Figure 5B). Consistently, RVD without collagen-targeting ability only accumulated in the liver or spleen of MCT-4W rats. And DiR was only detectable in the spleen of rats (Figure 5B). Lastly, the fluorescence intensities of lungs from different groups were quantified under the same condition. Compared to SHAM, mean fluorescence in MCT-4W rats was amplified more than 70-fold, while the other three control groups had no statistical difference. Thus, consistent with in vitro results, only PVD had strong targeting in fibrotic lungs in vivo and ex vivo, compared with other groups (Figure 5C).
To determine the in vivo detection sensitivity of PVD, SD rats were randomly assigned into the 4 groups: SHAM, MCT-2W, MCT-3W and MCT-4W. As stated above, we defined MCT-3W as an early PF stage in this MCT rat model. As expected, PVD could target the fibrotic lungs of MCT-3W and MCT-4W rats in vivo, while it mainly accumulated in the liver of Sham and MCT-2W rats (Figure 6A). Consistent with in vivo data, ex vivo analysis on major organs showed that while PVD accumulated in the liver and spleen of SHAM and MCT-2W rats, with minimal signal detected in the lungs, PVD could specifically detect fibrotic lungs of MCT-3W and MCT-4W rats with much less distribution in the liver and spleen (Figure 6B and C). These data confirmed that PVD was a versatile NIR probe for the direct visualization of collagen, and can be particularly helpful in determining pulmonary fibrosis.
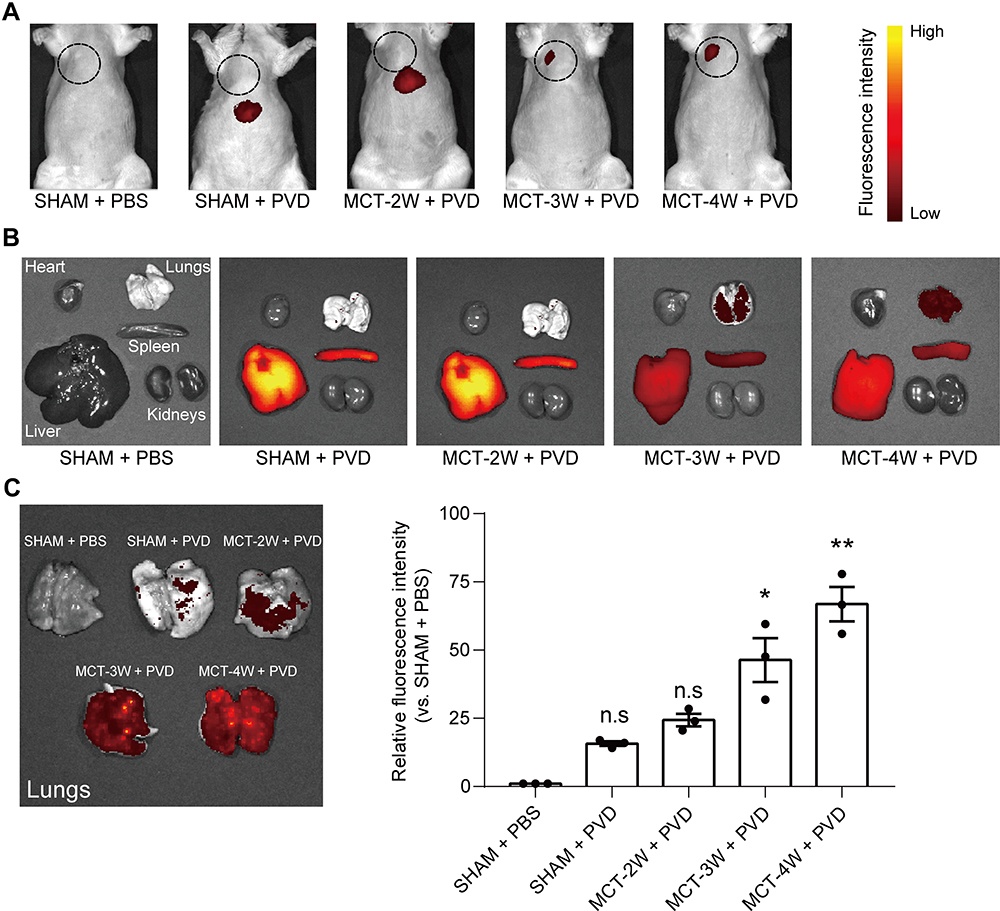 |
Figure 6 The sensitivity of PVD to detect PF with different levels of fibrosis. (A) Representative images of PVD fluorescence distribution in vivo of PF rats with 2-, 3- and 4-weeks of MCT-induction (n=3). The black dotted circle indicates the approximate location of the lungs. (B) Representative images of ex vivo fluorescence of major organs isolated from the same rats used in (A) as indicated. (C) Quantification of ex vivo fluorescence intensity of lung tissues isolated from the same rats used in (A) as indicated (n=3). ns, not significant, *Denotes p < 0.05 and **Denotes p < 0.01 by Kruskal–Wallis test followed by Dunn’s multiple comparisons with SHAM + PBS group. |
Discussion
In summary, we have developed a novel NIR-responsive biomimetic imaging probe PVD, derived from platelets membrane and loaded with DiR dye. PVD is designed to bind with collagen, a key component in fibrotic diseases. PVD displays specific collagen-targeting both in vitro and in vivo, and provides the direct visualization of collagen deposition in a rat model of PF disease. We recognize that the results collected from PF rats cannot directly reflect situations in humans, where considerably more tissues are present than in rats. Unfortunately, a phantom measurement (ie, artificially produced materials that mimic human tissues) was not feasible in this study to verify that PVD labeling can be detected in human lungs, mainly because the dosage of PVD used in rats for sure was much lower than that would be used in human, making two situations not comparable.
Meanwhile, it also should be noted that the traditional NIR dyes including DiR, known as the first NIR window imaging (NIR-I, 700 to 900 nm), have been extensively utilized in clinical diagnosis, treatment and scientific research for decades. However, NIR technique suffers from low penetration and poor resolution, thus largely limits its clinical applications. Indeed, they are considered to be unrealistic for imaging human deep organs, such as the liver, lung and brain, due to their limitations of tissue penetration. Compared with NIR-I, dyes for the second NIR window imaging (NIR-II, 1000 to 1700 nm) have much lower autofluorescence, better penetration depth and higher signal-to-noise ratio, making NIR-II technology a heavily researched topic in biomedicine.27 In this study, we loaded DiR dye onto platelet membrane-derived nanovesicles as a proof of concept. In the future, because of the versatile of PVD preparation, DiR can be replaced easily by one of NIR-II dyes for preclinical or clinical purpose, such as FDA-approved indocyanine green (ICG) which have much better penetration depth and quantum efficiency.27 Notably, due to the nature of DiR dye, PVD not only can be used in NIR diagnosis for PF, potentially it can work as a photoacoustic imaging (PAI) agent as our previous report.16 In the same way, since ICG has been extensively used in PA imaging, a new version of PVD with ICG loaded will work in both NIR-II and PAI models. In short, by doing a simple dye replacement, we believe that the approach developed in the study has considerable clinical implications. Thus, this versatile NIR modality could have large implications in clinical diagnosis and drug trials of pulmonary fibrosis.
In order to better characterize the progression of pulmonary fibrosis and define an early stage of the disease, we have established time course of effect over a 28-day period post-MCT administration and collected lung tissues from rats with 2-, 3- and 4-weeks of MCT-induction (MCT-2W, MCT-3W and MCT-4W). The results from Masson staining, collagen expression and hydroxyproline (HYP) content demonstrated that there was no significant increase in collagen and HYP content for MCT-2W when compared with sham rats. Starting from week 3 there was an increased deposition of collagen and HYP, which were accumulated more on week 4 (Figure 3). Thus, we were able to define MCT-3W as the early stage of pulmonary fibrosis based on collagen and HYP expressions as well as histological analysis. After that, we have tested the binding of PVD to collagen in a dose-dependent manner in vitro (Figure 4). Then we have confirmed that PVD could specifically detect MCT-3W and MCT-4W, both in vivo and ex vivo (Figure 6). Thus, we concluded that PVD was sensitive to collagens and it was able to detect pulmonary fibrosis at the early stage in an animal PF model.
While fibrotic diseases also commonly affect elsewhere besides the lungs, such as the heart, kidney and liver, there are apparent physical, physiological as well as biological differences among them, which could hamper the utility of PVD to detect fibrosis in other organs. For example, because the heart is constantly pumping, PVD is probably very hard to retain at the fibrotic regions within the myocardium. On the other hand, since the liver and kidney are essential organs for the body’s metabolism and detoxification, they are prone to absorb PVD, as evidenced by NIR signalings observed in the liver and kidney from both sham and PF animals (Figures 5 and 6). In contrast, there is minimal signaling detected in normal non-fibrotic lungs (background-free), making the lungs an ideal target for the PVD strategy. More optimization will be required in the future to explore the possibility of PVD to detect other fibrotic diseases. Nevertheless, the PVD-based imaging shows great potential to be employed in routine clinical practice in the future, especially for the direct detection of pulmonary fibrosis at the early PF stage.
Acknowledgments
This work was supported by the National Natural Science Foundation of China (82070406), the Department of Science and Technology of Guangdong (2020A1515011158), the Department of Education of Guangdong (2020KTSCX106), and the High-level University Construction Fund of Guangdong (06-410-2107210).
Disclosure
The authors report no conflicts of interest in this work.
References
1. Kolahian S, Fernandez IE, Eickelberg O, et al. Immune mechanisms in pulmonary fibrosis. Am J Respir Cell Mol Biol. 2016;55(3):309–322.
2. Martinez FJ, Collard HR, Pardo A, et al. Idiopathic pulmonary fibrosis. Nat Rev Dis Primers. 2017;3:17074.
3. Somogyi V, Chaudhuri N, Torrisi SE, et al. The therapy of idiopathic pulmonary fibrosis: what is next? Eur Respir Rev. 2019;28(153):190021.
4. Smith JS, Gorbett D, Mueller J, et al. Pulmonary hypertension and idiopathic pulmonary fibrosis: a dastardly duo. Am J Med Sci. 2013;346(3):221–225.
5. George PM, Wells AU, Jenkins RG. Pulmonary fibrosis and COVID-19: the potential role for antifibrotic therapy. Lancet Respir Med. 2020;8(8):807–815.
6. Muzard J, Sarda-Mantel L, Loyau S, et al. Non-invasive molecular imaging of fibrosis using a collagen-targeted peptidomimetic of the platelet collagen receptor glycoprotein VI. PLoS One. 2009;4(5):e5585.
7. Caravan P, Yang Y, Zachariah R, et al. Molecular magnetic resonance imaging of pulmonary fibrosis in mice. Am J Respir Cell Mol Biol. 2013;49(6):1120–1126.
8. Désogère P, Tapias LF, Rietz TA, et al. Optimization of a collagen-targeted PET probe for molecular imaging of pulmonary fibrosis. J Nucl Med. 2017;58(12):1991–1996.
9. Montesi SB, Izquierdo-Garcia D, Désogère P, et al. Type I collagen-targeted positron emission tomography imaging in idiopathic pulmonary fibrosis: first-in-human Studies. Am J Respir Crit Care Med. 2019;200(2):258–261.
10. van der Meijden PEJ, Heemskerk JWM. Platelet biology and functions: new concepts and clinical perspectives. Nat Rev Cardiol. 2019;16(3):166–179.
11. Gros A, Ollivier V, Ho-Tin-Noé B. Platelets in inflammation: regulation of leukocyte activities and vascular repair. Front Immunol. 2015;5:678.
12. Chen HY, Deng J, Wang Y, et al. Hybrid cell membrane-coated nanoparticles: a multifunctional biomimetic platform for cancer diagnosis and therapy. Acta Biomater. 2020;112:1–13.
13. Gao L, Wang H, Nan L, et al. Erythrocyte membrane-wrapped pH sensitive polymeric nanoparticles for non-small cell lung cancer therapy. Bioconjug Chem. 2017;28(10):2591–2598.
14. Tang J, Su T, Huang K, et al. Targeted repair of heart injury by stem cells fused with platelet nanovesicles. Nat Biomed Eng. 2018;2:17–26.
15. Zhang L, Deng S, Zhang Y, et al. Homotypic targeting delivery of siRNA with artificial cancer cells. Adv Healthc Mater. 2020;9(9):e1900772.
16. Huang X, Shen A, Peng R, et al. A novel biomimetic nanoprobe as photoacoustic contrast agent. Front. Chem. 2021;9:721799.
17. Hu CM, Fang RH, Wang KC, et al. Nanoparticle biointerfacing by platelet membrane cloaking. Nature. 2015;526(7571):118–121.
18. Jung H, Kang YY, Mok H. Platelet-derived nanovesicles for hemostasis without release of pro-inflammatory cytokines. Biomater Sci. 2019;7(3):856–859.
19. Chen M, Wang P, Jiang D, et al. Platelet membranes coated gold nanocages for tumor targeted drug delivery and amplificated low-dose radiotherapy. Front Oncol. 2021;11:793006.
20. Wang S, Duan Y, Zhang Q, et al. Drug targeting via platelet membrane-coated nanoparticles. Small Struct. 2020;1(1):2000018.
21. Molteni A, Ward WF, Ts’ao CH, et al. Monocrotaline-induced pulmonary fibrosis in rats: amelioration by captopril and penicillamine. Proc Soc Exp Biol Med. 1985;180(1):112–120.
22. Baybutt RC, Herndon BL, Umbehr J, et al. Effects on cytokines and histology by treatment with the ACE inhibitor captopril and the antioxidant retinoic acid in the monocrotaline model of experimentally induced lung fibrosis. Curr Pharm Des. 2007;13(13):1327–1333.
23. Jessen H, Hoyer N, Prior TS, et al. Turnover of type I and III collagen predicts progression of idiopathic pulmonary fibrosis. Respir Res. 2021;22(1):205.
24. Ai X, Duan Y, Zhang Q, et al. Cartilage-targeting ultrasmall lipid-polymer hybrid nanoparticles for the prevention of cartilage degradation. Bioeng Transl Med. 2020;6(1):e10187.
25. Fujisaki H, Futaki S, Mizuno K, et al. Evaluation of keratinocyte proliferation on two- and three-dimensional type I collagen substrates. J Vis Exp. 2019;146:e59339.
26. Yao S, Xu Y, Shao C, et al. A biomimetic model for mineralization of type-I collagen fibrils. Methods Mol Biol. 2019;1944:39–54.
27. Su Y, Yu B, Wang S, et al. NIR-II bioimaging of small organic molecule. Biomaterials. 2021;271:120717.
 © 2022 The Author(s). This work is published and licensed by Dove Medical Press Limited. The full terms of this license are available at https://www.dovepress.com/terms.php and incorporate the Creative Commons Attribution - Non Commercial (unported, v3.0) License.
By accessing the work you hereby accept the Terms. Non-commercial uses of the work are permitted without any further permission from Dove Medical Press Limited, provided the work is properly attributed. For permission for commercial use of this work, please see paragraphs 4.2 and 5 of our Terms.
© 2022 The Author(s). This work is published and licensed by Dove Medical Press Limited. The full terms of this license are available at https://www.dovepress.com/terms.php and incorporate the Creative Commons Attribution - Non Commercial (unported, v3.0) License.
By accessing the work you hereby accept the Terms. Non-commercial uses of the work are permitted without any further permission from Dove Medical Press Limited, provided the work is properly attributed. For permission for commercial use of this work, please see paragraphs 4.2 and 5 of our Terms.