")
Back to Journals » International Journal of Nanomedicine » Volume 13
Dimethyl 2,2′-[2,2′-(ethane-1,1-diyl)bis(1H-indole-3,2-diyl)]-diacetate: a small molecule capable of nano-scale assembly, inhibiting venous thrombosis and inducing no bleeding side effect
Authors Wang Y , Chen H, Zhang X, Gui L, Wu J , Feng Q, Peng S , Zhao M
Received 29 June 2018
Accepted for publication 11 October 2018
Published 22 November 2018 Volume 2018:13 Pages 7835—7844
DOI https://doi.org/10.2147/IJN.S178683
Checked for plagiarism Yes
Review by Single anonymous peer review
Peer reviewer comments 2
Editor who approved publication: Dr Mian Wang
Yaonan Wang,1,2 Haiyan Chen,1,2 Xiaoyi Zhang,1,2 Lin Gui,1,2 Jianhui Wu,1,2 Qiqi Feng,1,2 Shiqi Peng,1,2 Ming Zhao1–3
1Beijing Area Major Laboratory of Peptide and Small Molecular Drugs, School of Pharmaceutical Sciences, Capital Medical University, Beijing 100069, China; 2Engineering Research Center of Endogenous Prophylactic of Ministry of Education of China, School of Pharmaceutical Sciences, Capital Medical University, Beijing 100069, China; 3Beijing Laboratory of Biomedical Materials, School of Pharmaceutical Sciences, Capital Medical University, Beijing 100069, China
Background: Due to the discovery that deep venous thrombosis (DVT) inhibitor is of chemotherapeutic importance, the nano-property of dimethyl 2,2'-[2,2'-(ethane-1,1-diyl)bis(1H-indole-3,2-diyl)]-diacetate (DEBIC), a recently reported antitumor agent, is worthy of characterization.
Materials and methods: One-pot reaction was used to prepare DEBIC. Electrospray Ionization (+/-)-Fourier Transform-Ion Cyclotron Resonance-Mass Spectrometer (ESI(+/-)-FT-ICR-MS), quadrupole Collision Induced Dissociation (qCID) and nuclear overhauser effect spectroscopy spectra were used to present the assembly of DEBIC. Transmission electron microscopy, scanning electron microscopy, atomic force microscopy and Faraday–Tyndall effect were used to visualize the nano-property of DEBIC. Rat models were used to evaluate DVT inhibition and the bleeding reaction of DEBIC.
Results: One-pot reaction can provide DEBIC in acceptable yield and high purity. In water, rat plasma and lyophilized powders of DEBIC existed as particles of small nano-size. In vivo DEBIC inhibited DVT in a dose-dependent manner. The minimal effective dose of DEBIC was 1.7 µmol/kg. Even the dose of 36 µmol/kg/day DEBIC did not induce bleeding side effect in DVT rats like in warfarin (0.82 µmol/kg/day).
Conclusion: DEBIC is a small molecule capable of nano-scale assembly, inhibiting venous thrombosis and inducing no bleeding side effect.
Keywords: nano-property, DVT inhibition, bleeding-reaction, tumor, thrombosis
Introduction
Cancer patients are at high risk of venous thromboembolism (VTE) including deep venous thrombosis (DVT) and pulmonary embolism (PE).1–6 Compared with non-cancer patients, the risk of symptomatic VTE for cancer patients is fourfold to sevenfold higher,7 and compared with cancer patients without anticoagulation the risk of bleeding for cancer patients with anticoagulation is fivefold to sevenfold higher.8
The attack of DVT and PE in cancer patients resulted from diverse etiologies and resulted in diverse consequences. The target drugs for cancer can lead to the increase of VTE risk,9 and ~5% of adult patients with acute leukemia will experience VTE within 180 days of transplant.10 The rate of PE recurrence of the cancer patients with radiation therapy is higher than those without radiation therapy.11,12 VTE prophylaxis is suitable for women who develop early ovarian hyperstimulation syndrome.13 Of the epithelial ovarian cancer patients, the women with ovarian clear cell carcinoma and high-grade serous ovarian cancer are the population of high VTE risk.14 The therapy of asparaginase is associated with DVT of pediatric cancer patients.15 Tamoxifen can cause breast cancer patients to complicate cerebral venous thrombosis and DTV.16 Except indolent lymphomas, the risk of VTE is increased in all types of hematological cancer.17 After pneumonectomy, VTE incidence is high in excised tissue of non-small-cell lung cancer patients.18 Cancer patients with acutemyocardial infarction or stroke usually are the population of high risk of VTE.19 DVT occurring in the lower leg is a single sign of metastatic urinary tract cancer,20 while the cancer patients with central venous catheter placement may develop upper-extremity DVT.21
Lower-extremity DVT,22 upper-extremity DVT23 and thrombus in cerebral venous sinus24,25 can worsen the treatment outcome and raise the mortality rate of cancer patients.26 DVT,27–30 chronic venous insufficiency,31 pulmonary arterial hypertension32 and atherosclerosis33 are recently associated with P-selectin.34
The mentioned knowledge emphasizes that the discovery of DVT inhibitor is of clinical importance. 2,2′-[2,2′-(Ethane-1,1-diyl)bis(1H-indole-3,2-diyl)]diacetate (DEBIC) was previously reported to be able to slow tumor growth, inhibit arterial thrombosis and downregulate P-selectin expression.35 However, the nano-property and DVT inhibition of DEBIC remain unknown. Based on the association of DVT with P-selectin and the structural characteristics, we hypothesized that DEBIC could be a nano-scaled inhibitor of DVT. In the context via one-pot reaction, this study performed the synthesis of DEBIC for visualizing the nano-property and assaying the DVT inhibition.
Materials and methods
Synthesis
The synthesis of DEBIC is shown in Scheme 1. A solution of 1 g (5.7 mmol) of 1H-indole-3-yl-acetic acid methyl ester and 30 mL of methanol was prepared. To this solution, 0.5 mL of concentrated sulfuric acid was added dropwise. Then, 2 mL of acetaldehyde was added, and the reaction mixture was stirred at room temperature for 24 hours. After evaporation, the residue was dissolved in 50 mL of ethyl acetate, and the solution was successively washed with saturated aqueous NaHCO3 (30 mL ×3), 5% aqueous KHSO4 (30 mL ×3) and saturated aqueous NaCl (30 mL ×3), and dried with anhydrous Na2SO4. After filtration, the filtrate was evaporated and the residue was purified on silica gel column (ethyl acetate/petroleum ether, 1/4) to provide 325 mg (29%) of DEBIC as colorless powders. Mp 162°C–163°C; IR (KBr, cm−1): 3,296, 2,976, 2,953, 2,842, 1,709, 1,623, 1,590, 1,565, 1,493, 1,460, 1,434, 1,416, 1,374, 1,325, 1,314, 1,281, 1,228, 1,201, 1,170, 1,139, 1,107, 1,076, 1,059, 992, 974, 741, 693, 679. 1H NMR (800 MHz, DMSO-d6): δ/ppm =10.81 (s, 2H), 7.39 (d, J=8.0 Hz, 2H), 7.35 (d, J=8.0 Hz, 2H), 7.05 (t, J=8.0 Hz, 2H), 6.96 (t, J=8.0 Hz, 2H), 4.77 (q, J=7.2 Hz, 1H), 3.65 (q, J=8.0 Hz, 4H), 3.49 (s, 6H), 1.73 (d, J=7.2 Hz, 3H). 13C NMR (200 MHz, DMSO-d6): δ/ppm =172.4, 138.6, 135.7, 128.4, 121.1, 119.1, 118.4, 111.5, 103.5, 51.9, 29.7, 29.1, 20.2. ESI(+)-FT-ICR-MS (m/z): 405.18253 [M + H]+.
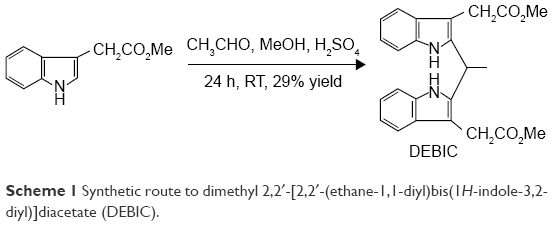 | Scheme 1 Synthetic route to dimethyl 2,2′-[2,2′-(ethane-1,1-diyl)bis(1H-indole-3,2-diyl)]diacetate (DEBIC). |
Animal and data statistics
Male Sprague Dawley rats (250–300 g in weight) were purchased from the Laboratory Animal Center of Capital Medical University. The evaluation was based on a protocol reviewed and approved by ethics committee of our University. Committee ensured that the welfare of the rats was in accordance to the requirements of Animal Welfare Act and NIH Guide for Care and Use of Laboratory Animals. All biological data were statistically analyzed by use of ANOVA, and Least Significant Difference (LSD) was used for multiple group comparison. Data statistics was performed with SPSS 19.0 program (IBM Corporation, Armonk, NY, USA), and P<0.05 was considered statistically significant.
Molecular association and corresponding characterization
Molecular association of DEBIC was identified with FT-ICR-MS spectra, nuclear overhauser effect spectroscopy (NOESY) and 3D structure generation. These methods were in accordance to the literature.36,37
Nano-images from TEM, SEM and AFM
To visualize the nano-feature of DEBIC in solid state, in water and in rat plasma, the transmission electron microscopy (TEM), scanning electron microscopy (SEM) and atomic force microscopy (AFM) images were recorded, by using the methods in the literature.35–38
For TEM (JSM-2100LV; JEOL, Tokyo, Japan), the solution (2.5×10⁻², 2.5×10⁻³ and 2.5×10⁻⁴ μM) of DEBIC in pH 6.8 ultrapure water, or 2.5×10⁻² μM solution of DEBIC in ultrapure water of pH 5.8 and pH 2.0, or 2.5×10⁻² μM solution of DEBIC in pH 7.4 PBS was dripped onto a formvar-coated copper grid, air-dried and heated at 37°C for 14 days. In a random region, the feature and size of the nano-particles were identified by examining >100 species. An imaging plate with energy window of 20 eV (Bioscan Camera Model 792; Gatan, Pleasanton, CA, USA) was used to record 6,000×–400,000× digitally enlarged images.
For SEM (S-4800; Hitachi, Tokyo, Japan), the lyophilized powders from solution (2.5×10⁻², 2.5×10⁻³ and 2.5×10⁻⁴ μM) of DEBIC in ultrapure water of pH 6.8, or from 2.5×10⁻² μM solution of DEBIC in ultrapure water of pH 2.0, pH 5.8 and pH 7.4 were attached to the copper plate with double-sided tape (Euromedex, Strasbourg, France). Using a Joel JFC-1600 Auto Fine Coater (JEOL), the grids were coated with 20 nm gold–palladium at 15 kV, 30 mA, and 200 mTorr (argon) for 60 seconds. In a random region, the feature and size of the nano-particles were identified by examining >100 species. An imaging plate with energy window of 20 eV (Bioscan Camera Model 1792; Gatan) was used to record 100×–10,000× digitally enlarged images.
For AFM, the rat plasma and 2.5×10⁻⁶ μM solution of DEBIC in rat plasma were prepared. AFM images were recorded on Nanoscope 3D AFM or Multimode 8 instrument (Veeco Metrology, Santa Barbara, CA, USA) by using the contact mode and the Nanoscope V531r1 software.
Nano-images from mesoscale-simulation35–38
DEBIC was sketched using ChemDraw Ultra 10.0 (CambridgeSoft) and converted into 3D structure with Materials Studio 3.2 (Accelrys, Inc., Bedminster, NJ, USA). The 3D structure was further optimized using MS Forcite module and geometry optimized until the convergence of maximum energy and force been 2×10⁻⁵ kcal/mol and 1×10⁻³ kcal/mol/Å, respectively. Molecular dynamic simulation was performed at 500 K using macro canonical ensemble number, volume, temperature (NVT) till equilibration. The final structure was further optimized with MS Dmol3 module. Based on optimized structure, a rigid coarse grain model of four connected spherical beads was built for DEBIC. In a cubic box of 200×200×200 Å3, the coarse grain model of four connected spherical beads was randomly distributed with a density of 0.15 g/cm3. A 15,000 ps simulation was performed on this system at 298 K using NVT ensemble.
Faraday–Tyndall effect, particle size and zeta potential
The nano-property of aqueous DEBIC was represented with Faraday–Tyndall effect, particle size and zeta potential by following the methods in the literature.35–38 In brief, 20 μM solutions of DEBIC in the ultrapure water of pH 2.0, pH 5.8 and pH 6.8 as well as in PBS of pH 7.4 were prepared. The ultrapure water of pH 2.0, pH 5.8 and pH 6.8 as well as PBS of pH 7.4 were used as the control. The radiation of 650 nm laser was used to induce the Faraday–Tyndall effect.
DVT inhibition assay
In vivo DVT inhibition assay was performed on rat model according to the literature.35 In this assay, male Sprague Dawley rats (250–300 g) were randomly divided into groups of carboxymethyl cellulose sodium (CMC-Na) (blank control), warfarin (4.87 μmol/kg, positive control) and DEBIC (0.07 μmol/kg, 1.7 μmol/kg, 36 μmol/kg), each group consisted of 12 rats, and the weight of the venous thrombus was used to represent DVT inhibition.
Bleeding side effect assay
The bleeding side effect assay was performed by corpse anatomy of DVT rats to examine the status. In this case, the bleeding status of the brain, the chest and the abdomen of DVT rats treated with 36 μmol/kg/day of DEBIC, 3 mL/kg/day of CMC-Na and 0.82 μmol/kg/day of warfarin for 7 consecutive days was examined and compared.
Results
Dimerization of DEBIC
ESI(+)-FT-ICR-MS spectra and dimerization
The dimerization of DEBIC was evidenced by ESI(+)-FT-ICR-MS and qCID spectra. ESI(+)-FT-ICR-MS spectrum of Figure 1A gives three ion peaks. Of three ion peaks, anion peak occurs at 831.34263 (dimer plus Na), anion peak occurs at 847.31764 (dimer plus K) and an ion peak occurs at 443.13819 (monomer plus K). This means that the ESI(+)-FT-ICR-MS spectrum of DEBIC simultaneously gives the peaks of the dimer and monomer.
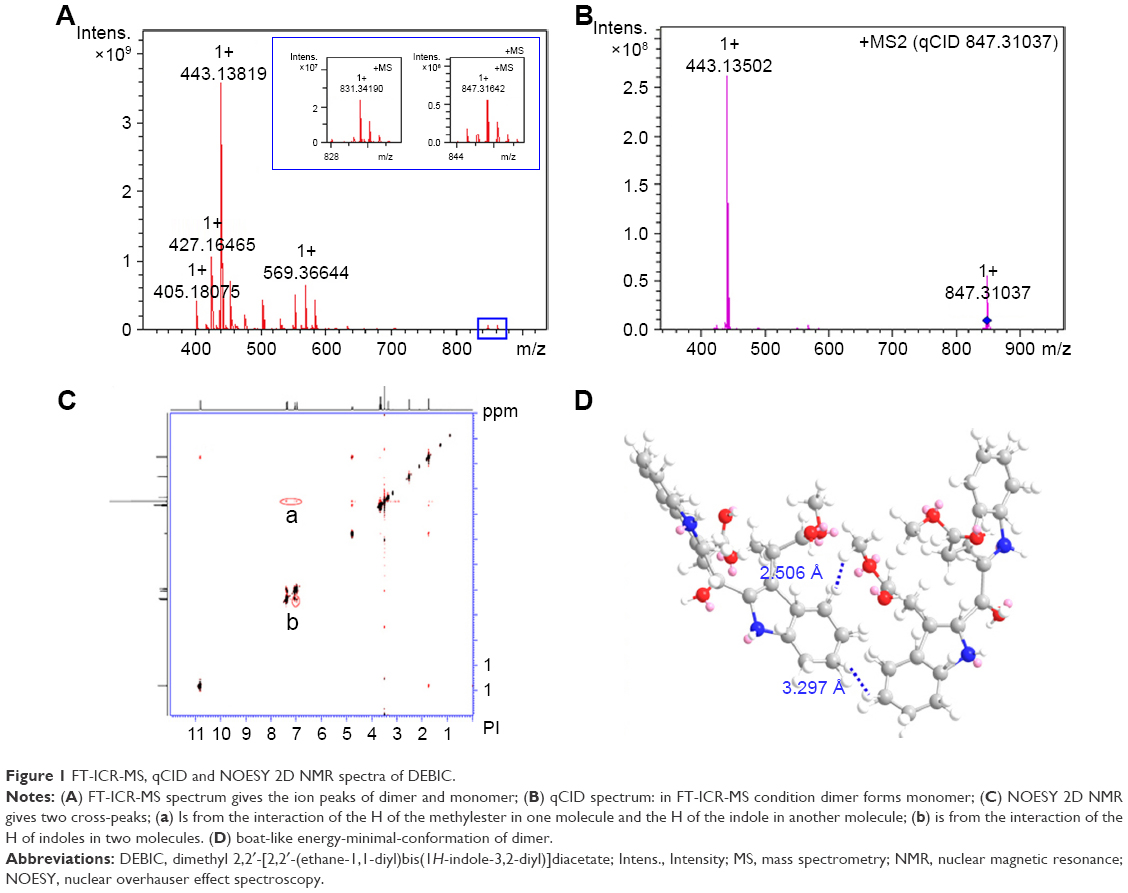 | Figure 1 FT-ICR-MS, qCID and NOESY 2D NMR spectra of DEBIC. |
The relationship between the dimer and monomer was defined by qCID spectrum. Figure 1B shows that the qCID spectrum of the dimer gives the peak of the monomer. This means that in ESI(+)-FT-ICR-MS condition, the dimer (occurring at 847.31764) is split to the monomer (occurring at 443.13502).
NOESY spectrum and dimerization pattern
The dimerization pattern of DEBIC was identified by the 2D nuclear magnetic resonance (NMR) spectrum. Figure 1C shows two interesting cross-peaks (marked by red circles). Cross-peak a is from the interaction of the H of the methylester in one molecule and the H of the indole in another molecule, and the distance between the H involved in this interaction is 2.506 Å. Cross-peak b is from the interaction of the H of indoles in two molecules, and the distances between the H involved in this interaction is 3.297 Å. In this case, when two molecules of DEBIC approach with energy minimal conformation a boat-like dimer could be obtained (Figure 1D).
Nano-scaled assembly of DEBIC
Faraday–Tyndall effect and nano-scaled assembly
The nano-scaled assembly and the formation of nano-particles were evidenced by the Faraday–Tyndall effect. Figure 2A, D, G and J indicates that the ultrapure water of pH 6.8, pH 2.0 and pH 5.8 as well as the PBS of pH 7.4 are clean. Figure 2B, E, H and K indicates that in the radiation of 650 nm laser the ultrapure water of pH 6.8, pH 2.0 and pH 5.8 as well as the PBS of pH 7.4 are still clean. Figures 2C, F, I and L indicate that the radiation of 650 nm laser induces the 20 μM solutions of DEBIC in the ultrapure water of pH 6.8, pH 2.0 and pH 5.8 as well as in the PBS of pH 7.4 for a Faraday–Tyndall effect to occur. This means that the solutions have nano-property.
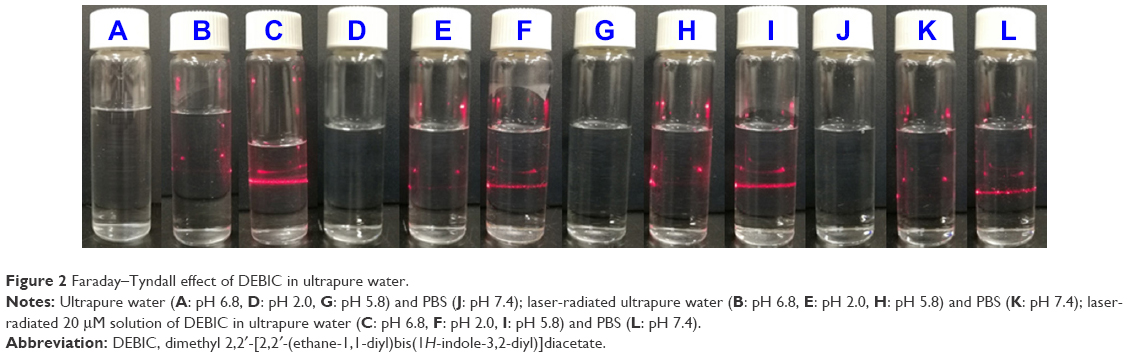 | Figure 2 Faraday–Tyndall effect of DEBIC in ultrapure water. |
Particle size and nano-scaled assembly
The nano-scale assembly and the formation of nano-particles were supported by size determination. On a nano-laser particle analyzer, the determination lasted for 7 days to observe the effect of time on the particle size. Table 1 shows that during 7 days the diameter of the particles in 2.5×10⁻⁴, 2.5×10⁻³ and 2.5×10⁻² μM solutions of DEBIC in ultrapure water (pH 2.0 and pH 6.8) and PBS (pH 7.4) falls within a range of 70–150 nm. The concentration and pH do not affect the particle size.
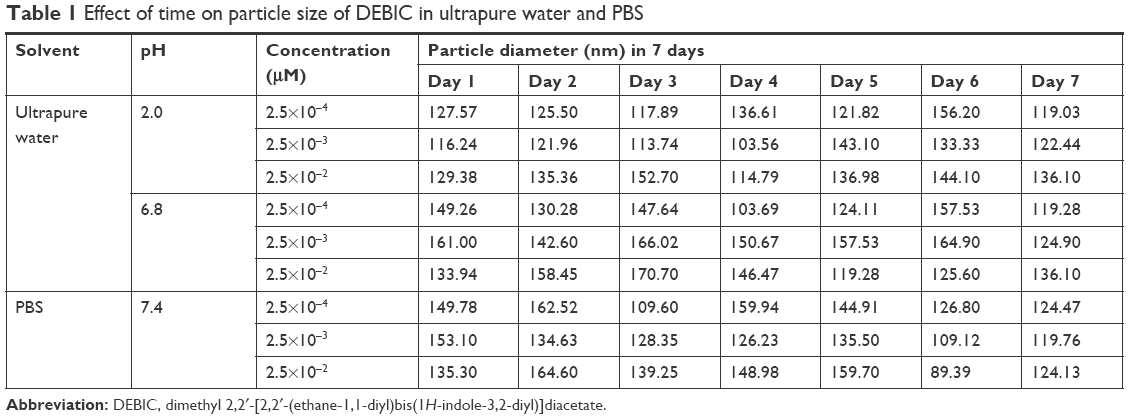 | Table 1 Effect of time on particle size of DEBIC in ultrapure water and PBS |
Apparent zeta potential and nano-scaled assembly
The nano-scaled assembly and the formation of nano-particles were supported by zeta potential determination. Table 2 shows that on seventh day the apparent zeta potentials of 2.5×10⁻⁴, 2.5×10⁻³ and 2.5×10⁻² μM solutions of DEBIC in pH 2.0 ultrapure water fall within a range of 5.95–11.17 mV. Table 2 also shows that on seventh day the apparent zeta potentials of 2.5×10⁻⁴, 2.5×10⁻³ and 2.5×10⁻² μM solutions of DEBIC in pH 6.8 ultrapure water fall within a range of −3.81 to −2.38 mV. Table 2 further shows that on seventh day the apparent zeta potentials of 2.5×10⁻⁴, 2.5×10⁻³ and 2.5×10⁻² μM solutions of DEBIC in pH 7.4 PBS fall within a range of −6.88 to −4.98 mV. Thus, concentration and pH slightly and greatly affect the apparent zeta potential, respectively.
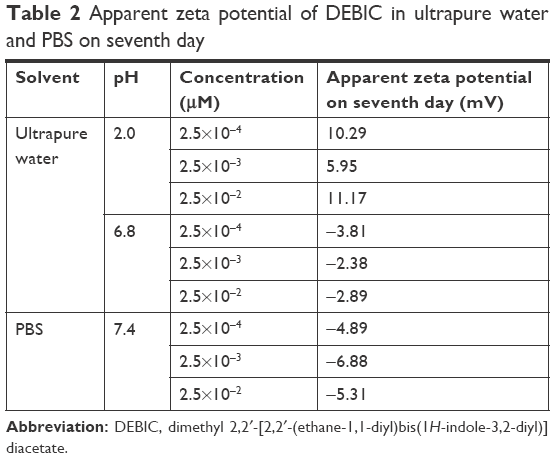 | Table 2 Apparent zeta potential of DEBIC in ultrapure water and PBS on seventh day |
TEM image and nano-scaled assembly
The nano-scale assembly and the formation of nano-particles were supported by the TEM image. Figure 3A–F shows that in pH 6.8 ultrapure water the particle diameters of 2.5×10⁻², 2.5×10⁻³ and 2.5×10⁻⁴ μM of DEBIC are 23–130, 37–163 and 56–105 nm, respectively, and most diameters are <100 nm. Figure 3G–J shows that in pH 2.0 and pH 5.8 ultrapure water the particle diameters of 2.5×10⁻² μM of DEBIC are 19–79 and 12–39 nm, respectively, and all diameters are <80 nm. Figure 3K and L shows that in PBS of pH 7.4 the particle diameter of 2.5×10⁻² μM of DEBIC is 46–123 nm.
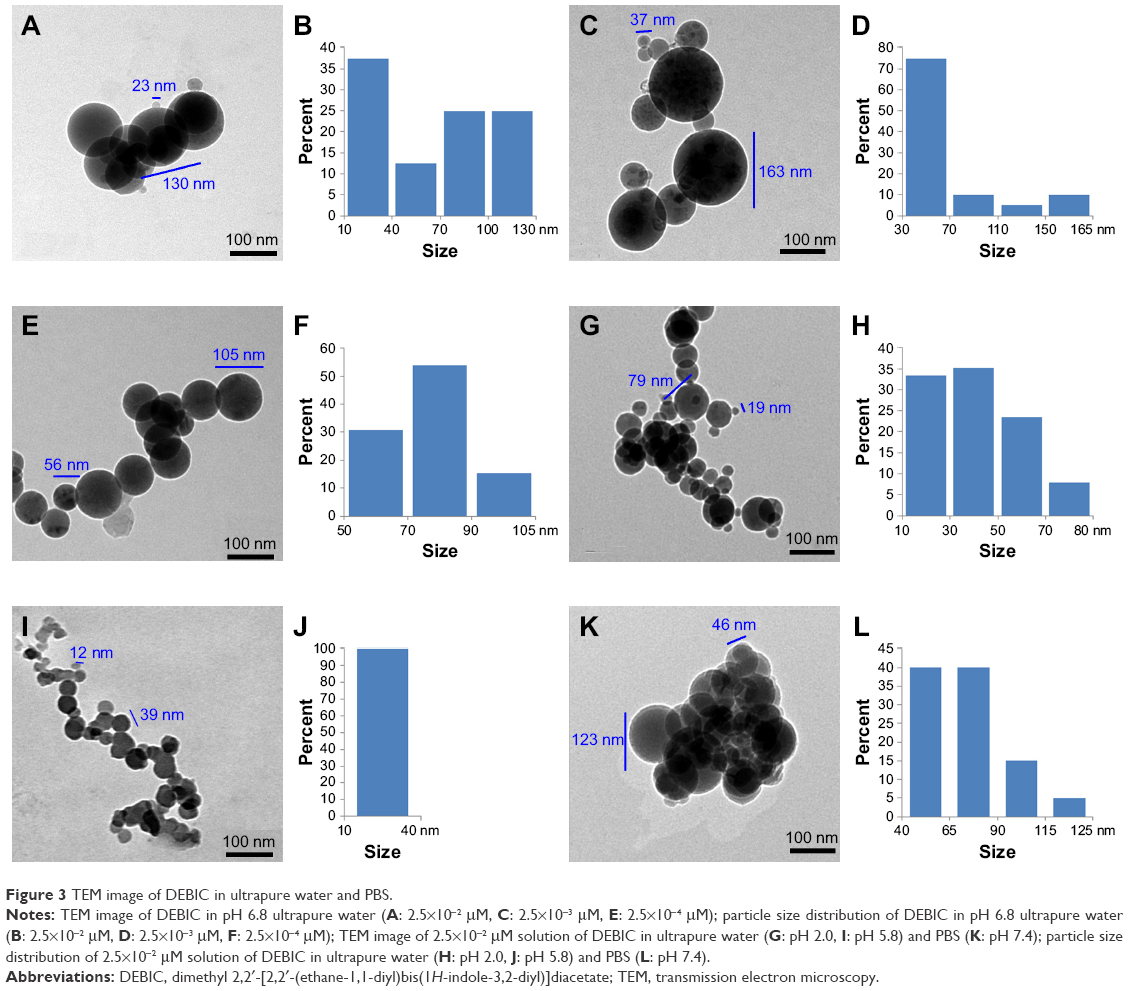 | Figure 3 TEM image of DEBIC in ultrapure water and PBS. |
SEM image and nano-scaled assembly
The nano-scaled assembly and the formation of nano-particles were supported by the SEM image. Figure 4A–F shows that when 2.5×10⁻², 2.5×10⁻³ and 2.5×10⁻⁴ μM solutions of DEBIC in pH 6.8 ultrapure water are lyophilized the nano-particles of 15–33, 21–28 and 25–49 nm in diameter are formed, respectively. Figure 4G–J shows that when 2.5×10⁻² μM solutions of DEBIC in pH 2.0 and pH 5.8 ultrapure water are lyophilized the nano-blocks of 36–82 and 42–83 nm in length are formed, respectively. Figure 4K and L shows that when 2.5×10⁻² μM solution of DEBIC in ultrapure water of pH 7.4 is lyophilized the nano-particles of 104–158 nm in diameter are formed.
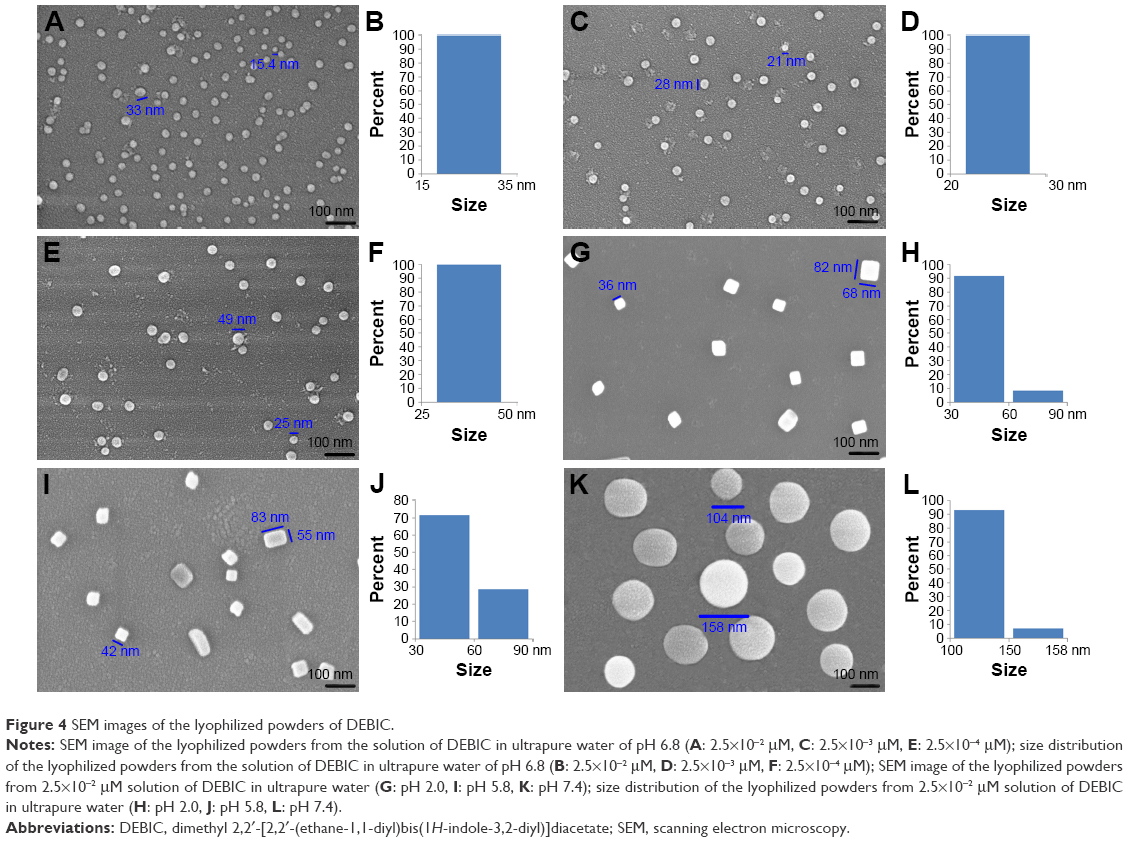 | Figure 4 SEM images of the lyophilized powders of DEBIC. |
AFM image and nano-scaled assembly
The nano-scaled assembly and the formation of nano-particles were supported by the AFM image. Figure 5A is the AFM image of rat plasma alone and gives no interesting particle. Figure 5B is the AFM image of DEBIC in rat plasma (2.5×10⁻⁶ μM) and gives a large number of nano-particles of 5.7–6.1 nm in height. Figure 5C indicates that the depth of most nano-particles falls within a range of 2–12 nm.
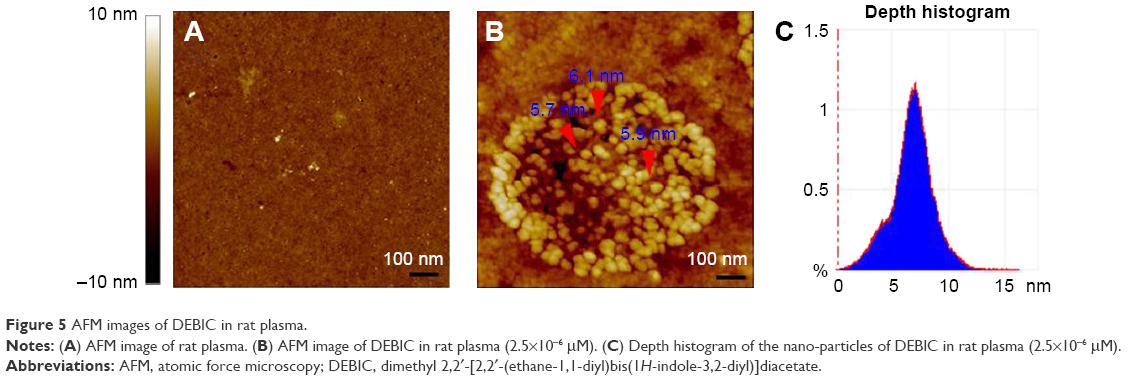 | Figure 5 AFM images of DEBIC in rat plasma. |
Molecular number and nano-particle size
To estimate the number of DEBIC molecule in a nano-particle with certain size, the mesoscale simulation was performed by using the software and a four-step procedure of the literature.35–37 Figure 6 shows that in a nano-particle of 144.4 nm in diameter there are 1,086 molecules of DEBIC. This enables us to optionally simulate a nano-particle and to estimate the molecular number of DEBIC involved in a nano-particle.
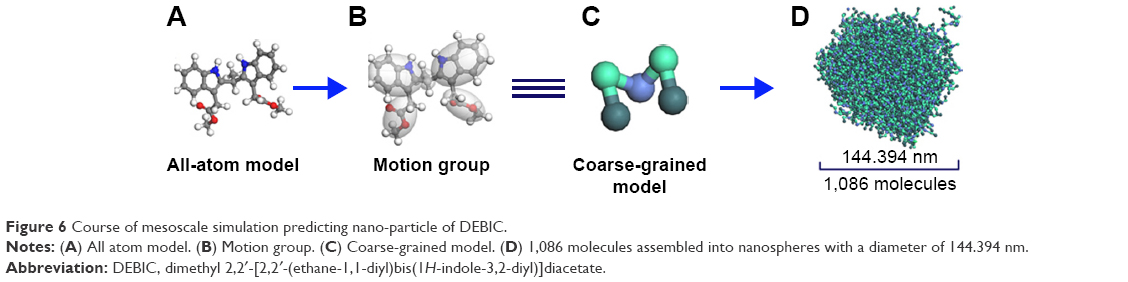 | Figure 6 Course of mesoscale simulation predicting nano-particle of DEBIC. |
Dose-dependent inhibition of DEBIC to DTV
To show the superiority of DEBIC therapy, the venous thrombus weights of the rats orally treated with CMC-Na, warfarin and DEBIC were measured. Figure 7 shows that the venous thrombus weight of the rats treated with 1.7 μmol/kg of DEBIC is significantly lower than that of the rats treated with CMC-Na and is equal to that of the rats treated with 4.8 μmol/kg of warfarin. Figure 7 also shows that the venous thrombus weight of the rats treated with 36 μmol/kg of DEBIC is significantly lower than those of the rats treated with 4.8 μmol/kg of warfarin and 1.7 μmol/kg of DEBIC. Thus, DEBIC dose dependently inhibits DVT, 1.7 μmol/kg is its minimal effective dose and its DVT-inhibition activity is 2.86-fold that of warfarin.
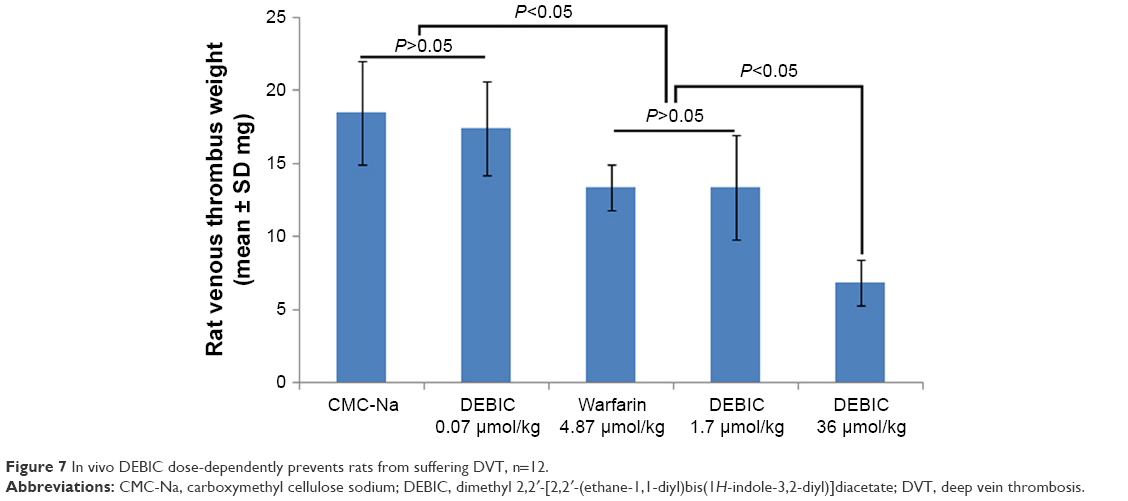 | Figure 7 In vivo DEBIC dose-dependently prevents rats from suffering DVT, n=12. |
DEBIC having no bleeding effect
The bleeding effect was defined by bleeding status of the DVT rats treated with 3 mL/kg/day of CMC-Na, 36 μmol/kg/day of DEBIC and 0.82 μmol/kg/day of warfarin for 7 consecutive days. Figure 8A–F indicates that in the brain, the chest and the abdomen of the DVT rats treated with DEBIC and CMC-Na, no blood could be found. Figure 8G–I indicates that in the brain, the chest and the abdomen of the DVT rats treated with warfarin, blood could be seen.
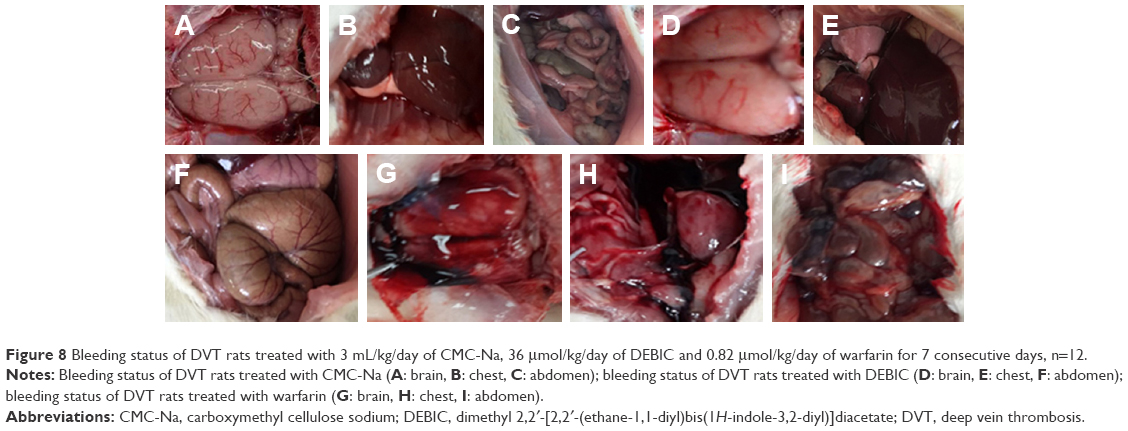 | Figure 8 Bleeding status of DVT rats treated with 3 mL/kg/day of CMC-Na, 36 μmol/kg/day of DEBIC and 0.82 μmol/kg/day of warfarin for 7 consecutive days, n=12. |
Discussion
DVT is one of the complications of cancer patients. It can worsen the outcome and raise the mortality rate of cancer patients receiving chemotherapy. The discovery of antitumor agent capable of simultaneously inhibiting DVT is of clinical importance. DEBIC is known to able to slow tumor growth and inhibit arterial thrombosis by downregulating P-selectin expression. Here, DEBIC was successfully prepared by a one-pot reaction to identify its nano-property and DVT inhibition.
ESI(+)-FT-ICR-MS and qCID spectra reveal that the dimer is the only existence form of DEBIC in solution state. NOESY spectrum reveals that to perform a dimerization the distance between the H of the methyl ester in one molecule with the H of the indole in another molecule, and the distance between the H of indoles of two molecules must be <4 Å. In this case, the dimer has a boat-like conformation. The experiments of Faraday–Tyndall effect explore that either in ultrapure water of pH 2.0 and pH 6.8 or in PBS of pH 7.4 the solutions of DEBIC are transparent and the size of the particles falls within a range of 70–150 nm. The connection between ESI(+)-FT-ICR-MS, qCID, NOESY and Faraday–Tyndall effect implies that the boat-like dimer is able to assemble for forming nano-species.
The feature of the nano-species is characterized with TEM, SEM and AFM tests. TEM visualizes that in the ultrapure water of pH 6.8 and in the PBS of pH 7.4 DEBIC concentration independently forms nano-particles of 23–163 nm in diameter.
SEM visualizes that the lyophilization of 2.5×10⁻², 2.5×10⁻³ and 2.5×10⁻⁴ μM solutions of DEBIC in pH 6.8 ultrapure water produces nano-particles, the diameter falls in a range of 15–49 nm and the concentration does not affect particle size. SEM also visualizes that the lyophilization of 2.5×10⁻² μM solutions of DEBIC in ultrapure water of pH 6.8, pH 5.8 and pH 2.0 produces nano-particles of 15–33 nm in diameter, nano-blocks of size ranging from 42×42 nm2 to 55×83 nm2, and nano-blocks of size ranging from 36×36 nm2 to 68×82 nm2, respectively, suggesting that the pH affects the feature and size of the nano-species. SEM further visualizes that the lyophilization of 2.5×10⁻² μM solutions of DEBIC in the ultrapure water of pH 6.8 and in the PBS of pH 7.4 produces nano-particles of 15–33 and 104–158 nm in diameter, respectively, suggesting that the solvent affects the particle size.
The analysis of the Faraday–Tyndall effect, TEM and SEM of DEBIC results in some information. First, the aqueous solution has nano-property. Second, the pH and the solvent regulate the feature and size of the nano-species. Third, the nano-particles of 12–123 nm in diameter are suitable for the delivery in blood circulation.
In vivo 0.07, 1.7 and 36 μmol/kg of DEBIC inhibit DVT in a dose-dependent manner, with 1.7 μmol/kg as its minimal effective dose. The efficacy of 1.7 μmol/kg of DEBIC is equal to that of 4.8 μmol/kg of warfarin. In other words, the activity of DEBIC is 2.86-fold that of warfarin. In contrast to the bleeding effect of 7-day treatment of 0.82 μmol/kg/day warfarin, the 7-day treatment of 36 μmol/kg/day of DEBIC induces no bleeding effect. Since 36 μmol/kg is 21.2 folds of 1.7 μmol/kg (the minimal effective dose) therefore DEBIC has a 21.2-fold safety window.
All the results of the present study support that DEBIC is superior to warfarin in DVT inhibition. With the previous findings that DEBIC is able to slow tumor growth and inhibit arterial thrombosis together, DEBIC is a promising candidate of slowing tumor growth, inhibiting arterial thrombosis and treating DVT.
Conclusion
DVT is one of the important complications of cancer patients. At 1.7 μmol/kg of oral dose DEBIC is able to effectively treat DVT. At 36 μmol/kg of oral dose, 21.2-fold the minimal effective dose 1.7 μmol/kg, DEBIC not only exhibits higher anti-venous thrombosis activity but also induces no bleeding effect. Together with the nano-property, DEBIC is a small molecule capable of assembly at nano-scale and inhibits venous thrombosis without bleeding effect.
Acknowledgment
The authors thank the Special Project of China (2018ZX097201003), NSFC (81673303 and 81703332), KZ201610025029, BNSF (7172028), 2016000020124G096, and 2017000020124G264 for financial support.
Disclosure
The authors report no conflicts of interest in this work.
References
Sørensen HT, Sværke C, Farkas DK, et al. Superficial and deep venous thrombosis, pulmonary embolism and subsequent risk of cancer. Eur J Cancer. 2012;48(4):586–593. | ||
Hisada Y, Mackman N. Mouse models of cancer-associated thrombosis. Thromb Res. 2018;164(Suppl 1):S48–S53. | ||
Liebman HA, O’Connell C. Incidental venous thromboembolic events in cancer patients: what we know in 2016. Thromb Res. 2016;140(Suppl 1):S18–S20. | ||
Davies GA, Lazo-Langner A, Gandara E, et al. A prospective study of Rivaroxaban for central venous catheter associated upper extremity deep vein thrombosis in cancer patients (Catheter 2). Thromb Res. 2018;162:88–92. | ||
Adelborg K, Horváth-Puhó E, Sundbøll J, Prandoni P, Ording A, Sørensen HT. Risk and prognosis of cancer after upper-extremity deep venous thrombosis: A population-based cohort study. Thromb Res. 2018;161:106–110. | ||
Delluc A, Le Gal G, Scarvelis D, Carrier M. Outcome of central venous catheter associated upper extremity deep vein thrombosis in cancer patients. Thromb Res. 2015;135(2):298–302. | ||
Aziz F, Comerota AJ. Deep venous thrombosis. J Radiol Nurs. 2013;32(4):160–164. | ||
Guy JB, Bertoletti L, Magné N, et al; RIETE investigators. Venous thromboembolism in radiation therapy cancer patients: findings from the RIETE registry. Crit Rev Oncol Hematol. 2017;113:83–89. | ||
Otani K, Ishihara S, Hata K, et al. Colorectal cancer with venous tumor thrombosis. Asian J Surg. 2018;41(3):197–202. | ||
Farge D, Bounameaux H, Bauersachs RM, Brenner B. Women, thrombosis, and cancer: a gender-specific analysis. Thromb Res. 2017;151(Suppl 1):S21–S29. | ||
Cohen JG, Prendergast E, Geddings JE, et al. Evaluation of venous thrombosis and tissue factor in epithelial ovarian cancer. Gynecol Oncol. 2017;146(1):146–152. | ||
Spavor M, Halton J, Dietrich K, et al. Age at cancer diagnosis, non-O blood group and asparaginase therapy are independently associated with deep venous thrombosis in pediatric oncology patients: a risk model. Thromb Res. 2016;144:27–31. | ||
Raper DM, Zukas AM, Schiff D, Asthagiri AR. Geographically remote cerebral venous sinus thrombosis in patients with intracranial tumors. World Neurosurg. 2017;98:555–562. | ||
Kashkoush AI, Ma H, Agarwal N, et al. Cerebral venous sinus thrombosis in pregnancy and puerperium: a pooled, systematic review. J Clin Neurosci. 2017;39:9–15. | ||
Castaman G. Risk of thrombosis in cancer and the role of supportive care (transfusion, catheters, and growth factors). Thromb Res. 2016;140(Suppl 1):S89–S92. | ||
Gheshmy A, Carrier M. Venous thromboembolism and occult cancer: impact on clinical practice. Thromb Res. 2016;140(Suppl 1):S8–S11. | ||
Eichinger S. Cancer associated thrombosis: risk factors and outcomes. Thromb Res. 2016;140(Suppl 1):S12–S17. | ||
Schomburg JL, Krishna S, Cotter KJ, Soubra A, Rao A, Konety BR. Preoperative incidence of deep venous thrombosis in patients with bladder cancer undergoing radical cystectomy. Urology. 2018;116:120–124. | ||
Gade IL, Brækkan S, Næss IA, et al. Epidemiology of venous thromboembolism in hematological cancers: the Scandinavian Thrombosis and Cancer (STAC) cohort. Thromb Res. 2017;158:157–160. | ||
Samuelson Bannow BT, Konkle BA. Laboratory biomarkers for venous thromboembolism risk in patients with hematologic malignancies: a review. Thromb Res. 2018;163:138–145. | ||
Kim Y, Kim OJ, Kim J. Cerebral venous thrombosis in a breast cancer patient taking tamoxifen: report of a case. Int J Surg Case Rep. 2015;6(10):77–80. | ||
Larsen AC, Frøkjær JB, Fisker RV, et al. Treatment-related frequency of venous thrombosis in lower esophageal, gastro-esophageal and gastric cancer – a clinical prospective study of outcome and prognostic factors. Thromb Res. 2015;135(5):802–808. | ||
Mukai M, Oka T. Mechanism and management of cancer-associated thrombosis. J Cardiol. 2018;72(2):89–93. | ||
Falanga A, Russo L, Milesi V, Vignoli A. Mechanisms and risk factors of thrombosis in cancer. Crit Rev OncolHematol. 2017;118:79–83. | ||
Aschermann M. Prevention of arterial and venous thrombosis in cancer patients. Cor Vasa. 2013;55(2):e196–e200. | ||
Romualdi E, Ageno W. Management of recurrent venous thromboembolism in cancer patients. Thromb Res. 2016;140(1):S128–S131. | ||
Culmer DL, Diaz JA, Hawley AE, et al. Circulating and vein wall P-selectin promote venous thrombogenesis during aging in a rodent model. Thromb Res. 2013;131(1):42–48. | ||
Antonopoulos CN, Sfyroeras GS, Kakisis JD, Moulakakis KG, Liapis CD. The role of soluble P selectin in the diagnosis of venous thromboembolism. Thromb Res. 2014;133(1):17–24. | ||
Bielinski SJ, Berardi C, Decker PA, et al. P-selectin and subclinical and clinical atherosclerosis: the Multi-Ethnic Study of Atherosclerosis (MESA). Atherosclerosis. 2015;240(1):3–9. | ||
Kazimierczyk R, Błaszczak P, Kowal K, et al. The significance of diminished sTWEAK and P-selectin content in platelets of patients with pulmonary arterial hypertension. Cytokine. 2018;107:52–58. | ||
Bryan LJ, Callas PW, Criqui MH, Cushman M. Higher soluble P-selectin is associated with chronic venous insufficiency: the San Diego Population Study. Thromb Res. 2012;130(5):716–719. | ||
Ay C, Kaider A, Koder S, Husslein P, Pabinger I. Association of elevated soluble P-selectin levels with fetal loss in women with a history of venous thromboembolism. Thromb Res. 2012;129(6):725–728. | ||
Vandy FC, Stabler C, Eliassen AM, et al. Soluble P-selectin for the diagnosis of lower extremity deep venous thrombosis. J Vasc Surg Venous Lymphat Disord. 2013;1(2):117–125. | ||
Mosevoll KA, Lindås R, Tvedt TH, Bruserud Ø, Reikvam H. Altered plasma levels of cytokines, soluble adhesion molecules and matrix metalloproteases in venous thrombosis. Thromb Res. 2015;136(1):30–39. | ||
Chen H, Wang W, Zhang X, et al. Discovery of DEBIC to correlate P-selectin inhibition and DNA intercalation in cancer therapy and complicated thrombosis. Oncotarget. 2018;9(63):32119–32133. | ||
Zhu H, Wang Y, Song C, et al. Docking of THPDTPI: to explore P-selectin as a common target of anti-tumor, anti-thrombotic and anti-inflammatory agent. Oncotarget. 2018;9(1):268–281. | ||
Wu J, Zhu H, Yang G, et al. Design and synthesis of nanoscaled IQCA-TAVV as a delivery system capable of antiplatelet activation, targeting arterial thrombus and releasing IQCA. Int J Nanomedicine. 2018;13:1139–1158. | ||
Wu J, Wang Y, Wang Y. Cu2+-RGDFRGDS: exploring the mechanism and high efficacy of the nanoparticle in antithrombotic therapy. Int J Nanomed. 2015;10:2925–2938. |
 © 2018 The Author(s). This work is published and licensed by Dove Medical Press Limited. The full terms of this license are available at https://www.dovepress.com/terms.php and incorporate the Creative Commons Attribution - Non Commercial (unported, v3.0) License.
By accessing the work you hereby accept the Terms. Non-commercial uses of the work are permitted without any further permission from Dove Medical Press Limited, provided the work is properly attributed. For permission for commercial use of this work, please see paragraphs 4.2 and 5 of our Terms.
© 2018 The Author(s). This work is published and licensed by Dove Medical Press Limited. The full terms of this license are available at https://www.dovepress.com/terms.php and incorporate the Creative Commons Attribution - Non Commercial (unported, v3.0) License.
By accessing the work you hereby accept the Terms. Non-commercial uses of the work are permitted without any further permission from Dove Medical Press Limited, provided the work is properly attributed. For permission for commercial use of this work, please see paragraphs 4.2 and 5 of our Terms.