")
Back to Journals » Vascular Health and Risk Management » Volume 17
Differentiation of Diabetic Foot Ulcers Based on Stimulation of Myogenic Oscillations by Transient Ischemia
Authors Los-Stegienta A , Katarzynska J , Borkowska A, Marcinek A , Cypryk K, Gebicki J
Received 19 February 2021
Accepted for publication 2 April 2021
Published 19 April 2021 Volume 2021:17 Pages 145—152
DOI https://doi.org/10.2147/VHRM.S307366
Checked for plagiarism Yes
Review by Single anonymous peer review
Peer reviewer comments 3
Editor who approved publication: Dr Konstantinos Tziomalos
Agnieszka Los-Stegienta,1 Joanna Katarzynska,2 Anna Borkowska,1 Andrzej Marcinek,2,3 Katarzyna Cypryk,1 Jerzy Gebicki2,3
1Department of Internal Diseases and Diabetology, Medical University of Lodz, Lodz, Poland; 2Angionica Ltd., Lodz, Poland; 3Institute of Applied Radiation Chemistry, Lodz University of Technology, Lodz, Poland
Correspondence: Jerzy Gebicki
Institute of Applied Radiation Chemistry, Lodz University of Technology, Lodz, 90-924, Poland
Tel +48 42 631 3171
Email [email protected]
Purpose: Diabetic foot ulceration is a chronic complication characterized by impaired wound healing. There is a great demand for a diagnostic tool that is able to monitor and predict wound healing.
Patients and Methods: Oscillations in the microcirculation, known as flowmotion, can be monitored very distinctly and precisely using the Flow Mediated Skin Fluorescence (FMSF) technique. The flowmotion response to hypoxia was measured quantitatively in 42 patients with diabetic foot ulcers.
Results: The flowmotion response to hypoxia parameters FM(R) and HS were used to differentiate the diabetic foot ulcers and correlate them with clinical status. In some cases, FMSF measurements were continued over the period of a year in order to monitor disease progress. The clinical status of the quarter of patients with the highest HS values (group A, HS = 50.2± 18.3) was compared to the quarter with the lowest HS values (group B, HS = 4.3± 1.7). The patients in the group B were identified as having low prognosis for healing and were characterized by higher incidences of hypertension, hyperlipidemia, prevalent CVD, neuropathy and nephropathy.
Conclusion: Impaired flowmotion responses to hypoxia induced by transient ischemia can be used for differentiation of diabetic foot ulcers and identification of cases with low prognosis for healing.
Keywords: vascular complications, microcirculation, hypoxia, diabetic foot, flowmotion, NADH fluorescence, FMSF technique
Introduction
Diabetic foot ulceration (DFU) is a chronic complication characterized by impaired wound healing.1 Diabetic foot is estimated to occur in 15 to 25% of people with diabetes and incurs very high costs for healthcare systems. There is great demand for a diagnostic tool able to monitor and predict wound healing. A number of reports have suggested that disturbed hypoxic sensitivity may be responsible for impaired wound healing.2–7 Cellular adaptive responses to hypoxia are mediated by the hypoxia-inducible factor (HIF). Stabilization of HIF-1α may be critical to improving wound healing.4 Since the vascular endothelial growth factor (VEGF) is an essential mediator of neovascularization, HIF-1α is directly responsible for up-regulation of VEGF expression. Therefore, a quantitative measure of the skin microcirculatory response to hypoxia could assist in the prognosis of diabetic foot healing.
We have developed a new diagnostic technique called Flow Mediated Skin Fluorescence (FMSF), which enables non-invasive evaluation of the vascular circulation and metabolic regulation.8,9 The diagnostic potential of the FMSF technique in cases of type 1 and type 2 diabetes has been presented elsewhere.10,11 Oscillations in the microcirculation, known as flowmotion, are a well-recognized characteristic of cutaneous blood flow.12,13 The mechanistic aspects of flowmotion have been the object of extensive study.14,15 Very recently, we demonstrated that skin flowmotion can be monitored very distinctly and precisely using the FMSF technique.16 The FMSF technique appears to be uniquely suited to the analysis of basal flowmotion and its hypoxia response, and may be used for characterization of microcirculatory status.17 Flowmotion parameters have been defined for quantitative assessment of basal flowmotion at rest (FM) and during reperfusion following post-occlusive reactive hyperemia (FM(R)).
In this paper, we present an analysis of skin flowmotion in patients with DFU. Special attention is given to the flowmotion response to hypoxia induced by transient ischemia, represented by the parameters FM(R) and Hypoxia Sensitivity (HS). The DFU were differentiated in terms of their sensitivity to hypoxia and correlated with the clinical status of the patients and the results of Doppler ultrasound. The analysis enabled the identification of DFU with low prognosis for healing.
Materials and Methods
The FMSF technique was used to assess disturbances in the microcirculation and macrocirculation of patients with DFU. The results were used to evaluate the potential of the FMSF technique as a tool for predicting foot healing.
Study Population and Clinical Characteristics
The study included 42 patients with DFU. The patients had all been diagnosed with long-term diabetes (lasting for at least 10 years), complicated by diabetic foot syndrome. Diabetic complications were identified on the basis of the patients’ previous medical history and specially performed tests. Neuropathy was defined on the basis of the following symptoms: sensory disturbances, numbness, tingling, burning, spontaneous pain and muscle cramps, mainly around the feet and lower legs. Other symptoms included muscle weakness, weakness or loss of sense of touch, vibration, pain and temperature sensation. The following tools were used to diagnose neuropathy: thermo feel, monofilament and turning fork. Proteinuria, the serum creatinine concentration and the estimated glomerular filtration rate (eGFR) were assessed as measures of the advancement of diabetic kidney disease. Diabetic retinopathy was identified on the basis of previous medical records or by a fundus examination if no previous documentation was available. Cardiovascular complications were assessed on the basis of previous medical history (including instances of ischemic stroke, myocardial infarction, or stent implantation), symptoms of cardiovascular issues, resting electrocardiography (ECG) and echocardiography. Patients with a tendency to faint, showing skin changes on the forearm or with systolic blood pressure above 160 mmHg were excluded from the study.
The study was conducted at the Medical University of Lodz, Poland. It conformed to the principles outlined in the Declaration of Helsinki and the study protocol was approved by the University Bioethics Committee. All the subjects gave written informed consent prior to participation.
The clinical characteristics of the participants are displayed in Table 1.
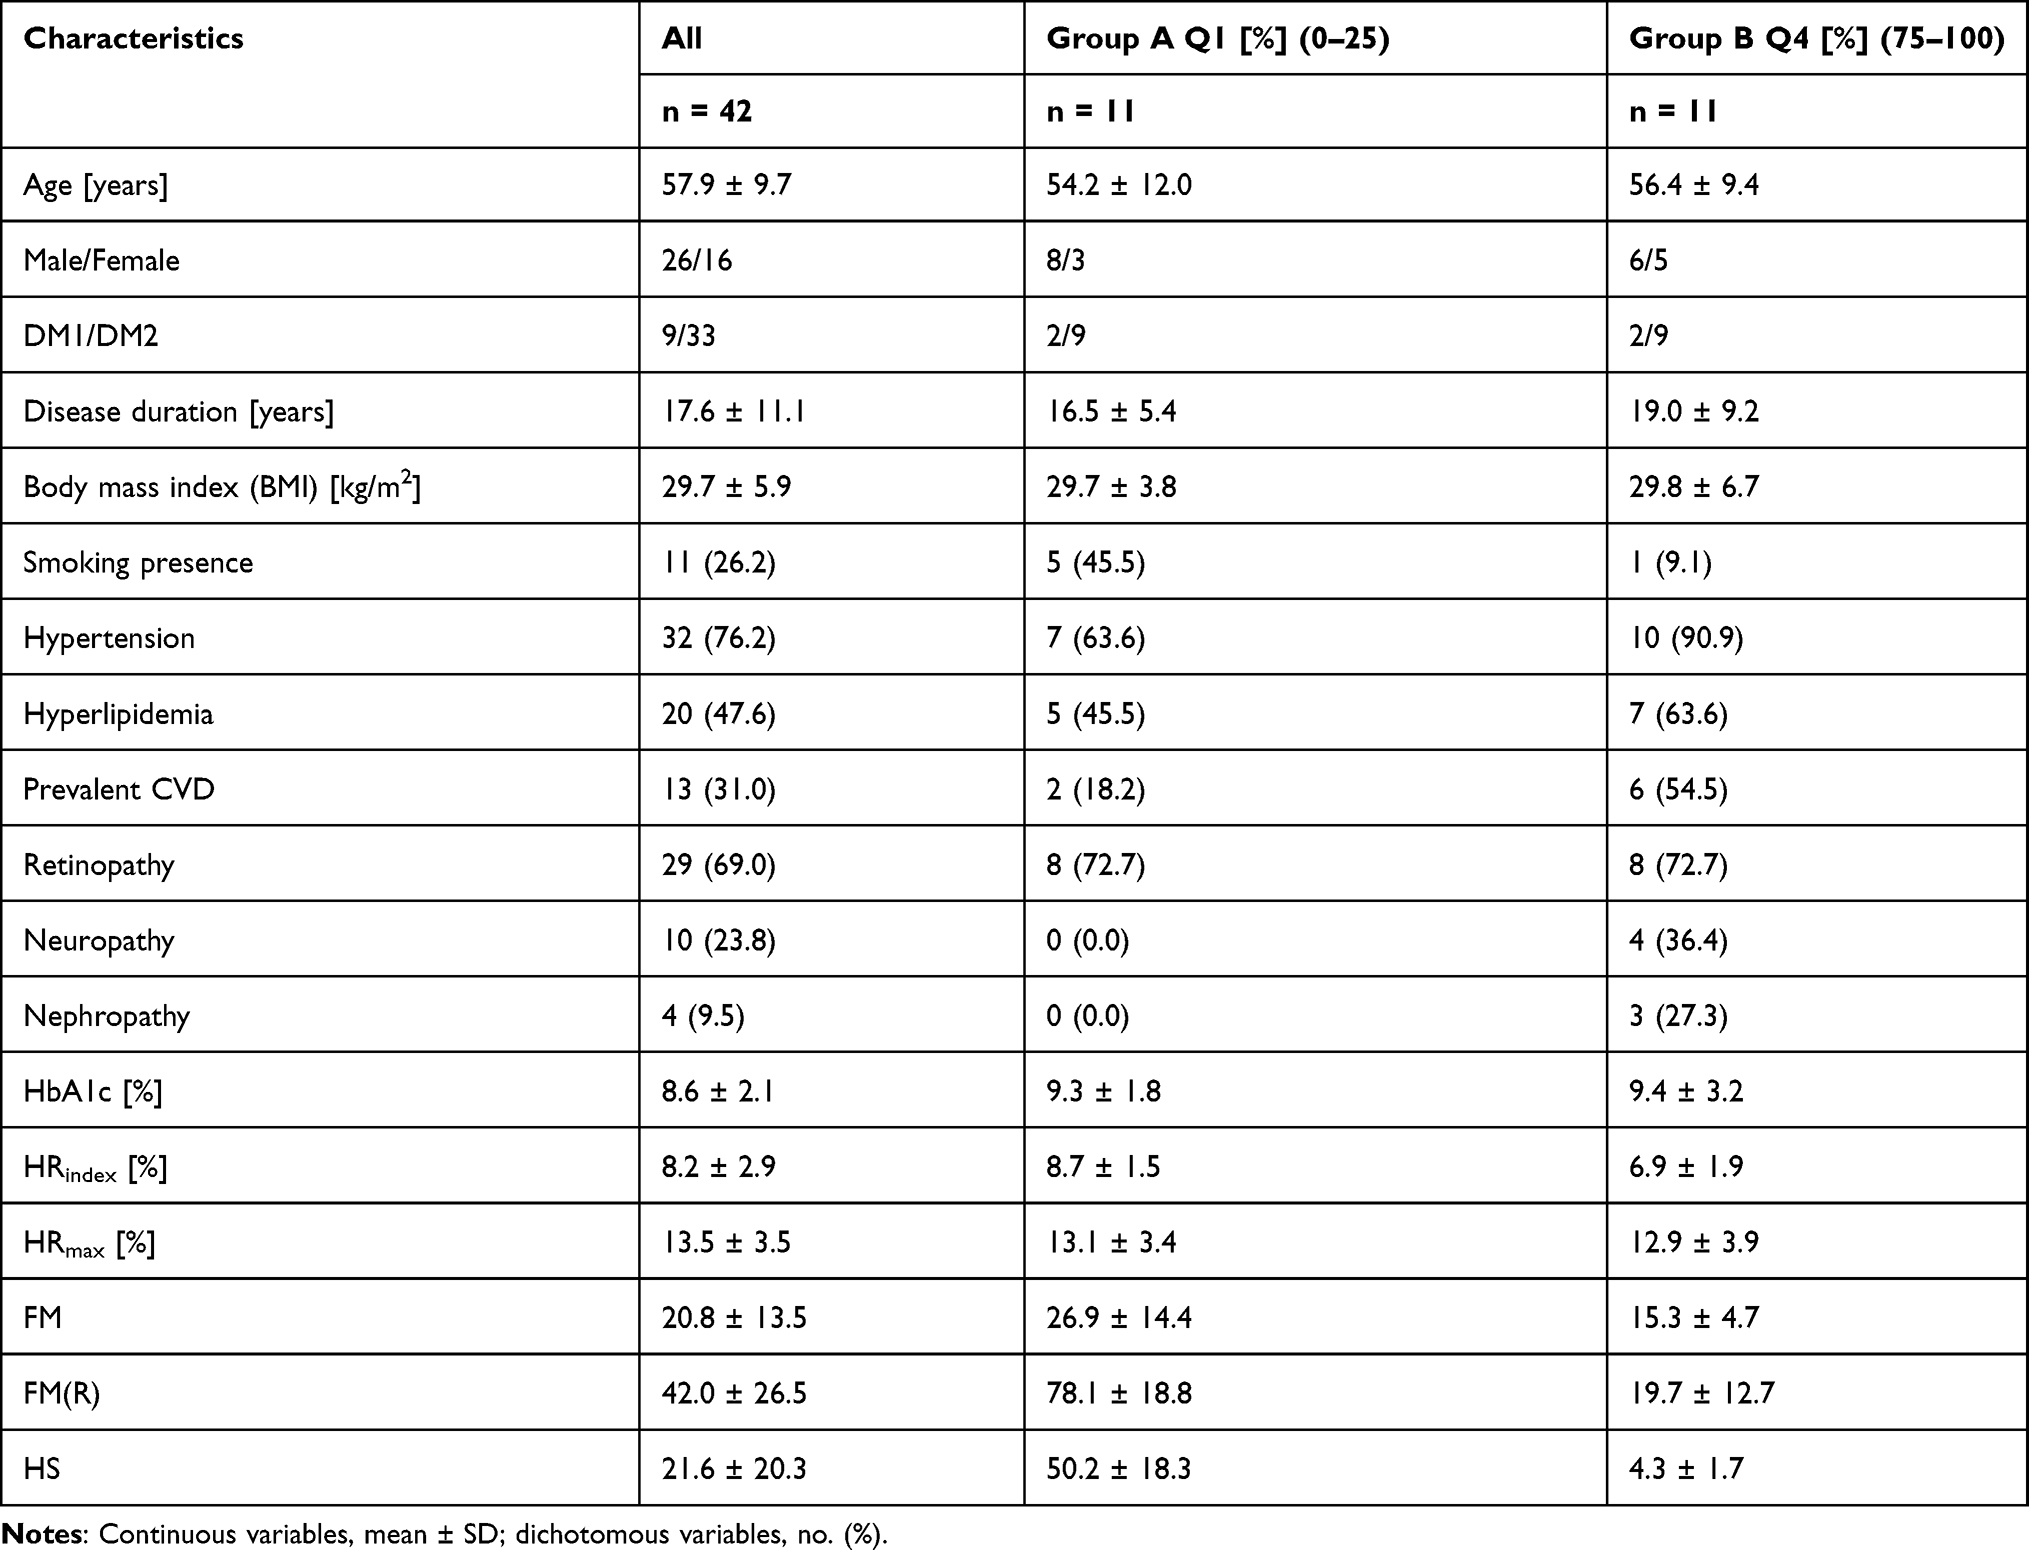 |
Table 1 Characteristics of the Studied Population |
Brief Description of the FMSF Technique and the Measurement Protocol
Measurements were performed using the AngioExpert, a device constructed by Angionica Ltd. The AngioExpert apparatus uses the Flow Mediated Skin Fluorescence (FMSF) technique, which measures changes in the intensity of nicotinamide adenine dinucleotide (NADH) fluorescence from the skin on the forearm in response to blocking and releasing blood flow. The skin is the largest organ of the human body, and is characterized by specific metabolism. The epidermal layer of the skin is not directly vascularized, and oxygen and nutrients are transported from the dermis by diffusion. Therefore, epidermal cell metabolism can be considered as a unique and sensitive marker of early dysfunction in vascular circulation and metabolic regulation.
The AngioExpert assesses the patient’s condition by analyzing changes in the NADH fluorescence signal emitted from epidermal cells in response to forced occlusion ischemia and subsequent hyperemia due to the removal of the occlusion. By interpreting the parameters and the shape of the obtained NADH fluorescence curve, disorders of the microcirculation can be identified that may be indicative of chronic diseases. The AngioExpert measures the NADH fluorescence excited by ultraviolet (UV) radiation with a wavelength of 340 nm (UVB). As the maximum UVB penetration light of 340 nm is approximately 0.3–0.5 mm, the results are determined by NADH fluorescence within the epidermis. The emitted wavelength of NADH fluorescence is 460 nm (blue light). The test is performed in a comfortable sitting position, after a minimum adaptation period of 5 minutes, in a quiet room with a controlled air temperature (24 ± 1 °C). The resting NADH fluorescence value emitted by the epidermal layer of the forearm is recorded for the first 3 minutes (180 s). The brachial artery is then occluded by inflating the cuff of the device to 60 mmHg above the systolic pressure. The ischemic response is recorded over a period of 3 minutes (180 s). During this time, ischemic changes in the NADH fluorescence signal are recorded. Upon completion of the occlusion, the cuff pressure is released abruptly, restoring flow in the brachial artery and inducing a hyperemic response, for a minimum duration of 4 minutes (240 s).
In our study, we used several quantitative measures of oscillations: a parameter characterizing basal flowmotion at rest, termed FM; a parameter representing flowmotion during the reperfusion phase, termed FM(R), which reflects the strong effect of hypoxia on flowmotion due mainly to the increased activity of the vessels, and a new parameter called Hypoxia Sensitivity (HS), which is the fraction of the FM(R) value covering the intensity of flowmotion related to myogenic oscillations (0.052–0.15 Hz) during reperfusion. Since myogenic oscillations are predominantly stimulated on the reperfusion line following transient ischemia, the HS parameter seems particularly well-suited for quantitative characterization of the microcirculatory response to hypoxia. Details of the experimental procedure and the measured FM(R) and HS parameters have been presented elsewhere.9–11,16,17 We also measured the HRindex, a parameter that characterizes the macrocirculation and metabolic response to hyperemia.
The patients in the study were tested twice using the AngioExpert device, on two consecutive days. The average values of the measured parameters were used for statistical analysis. Additional measurements were performed during re-hospitalization, which was most often associated with the exacerbation of diabetic foot syndrome and the appearance of new lesions.
Statistical Analysis
The data were analyzed using commercially available Origin2018b software. All probability values were two-tailed and a p-value <0.05 was considered statistically significant. An independent sample t-test was used to compare the HRindex parameters for different groups of subjects taking into consideration the tested conditions of normal distributions and homogeneity of variances. A Spearman correlation coefficient for dichotomous data was calculated to determine the correlation between the HS parameters and the USG Doppler results.
Results
Parameters Measured Using the FMSF Method for Patients in Groups A and B
The characteristics of the studied population are presented in Table 1. The DFU were differentiated based on the values of the HS parameter (Table 2). Group A comprised the quarter of patients with the highest values for HS (Q1). Group B was composed of the quarter with the lowest HS values (Q4). The measured FMSF parameters for the quarters Q2 and Q3 are presented in Supplementary Materials. An attempt to distinguish groups A and B using the Wagner Diabetic Foot Ulcer Grade Classification System (also known as the Merritt-Wagner) did not meet with sufficient success. It has been recognized that Wagner Classification does not adequately identify diabetic foot subtypes.18
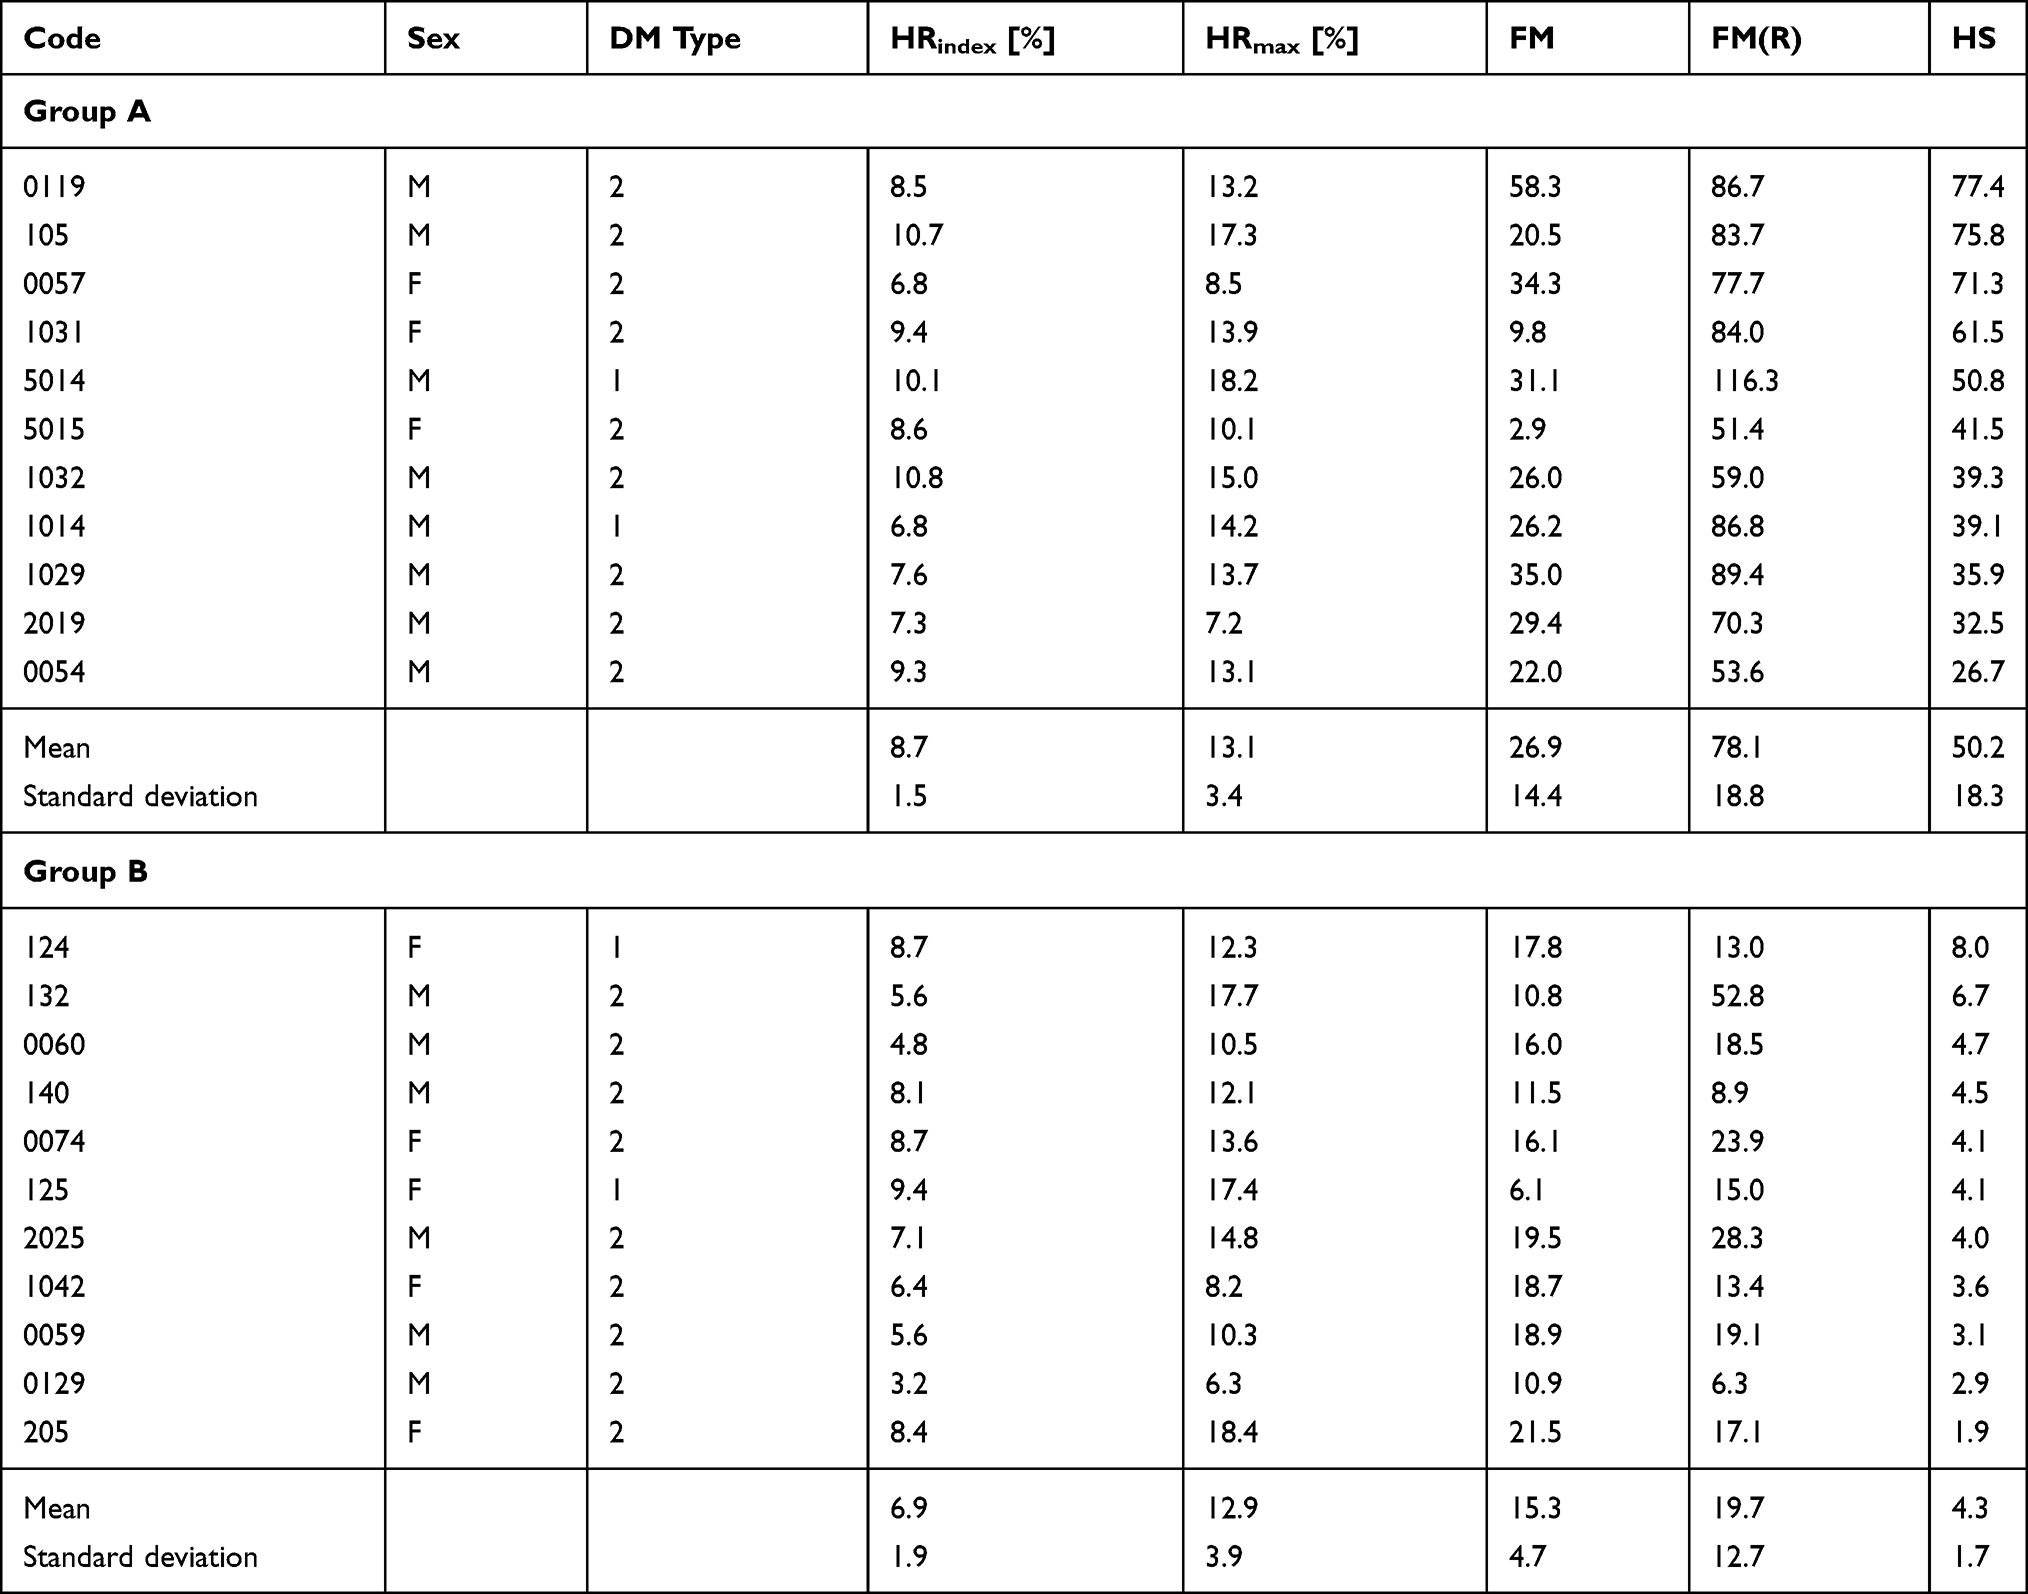 |
Table 2 Measured FMSF Parameters for Groups: A – the Quarter of the Patients with the Highest HS Values and B – the Quarter of the Patients with the Lowest HS Values |
Figure 1 compares the major hyperemic response parameter HRindex in the two groups. As can be seen, the values for this parameter were lower in group B. This indicates greater dysfunction of the macrocirculation among the patients in group B, which is in accord with the greater prevalence of CVD in this group (Table 1).
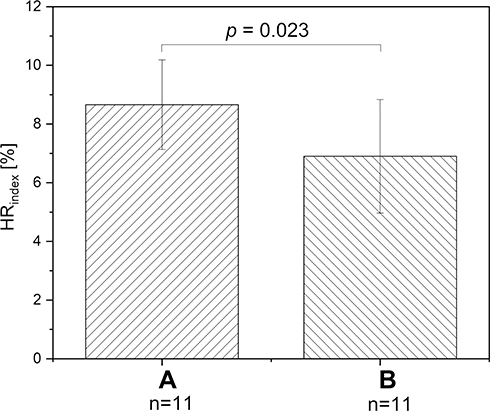 |
Figure 1 Comparison of HRindex parameter for groups A and B. |
Exemplary FMSF Traces for Selected Patients
Exemplary FMSF traces recorded for two representative patients from each group, A and B, are shown in Figure 2. Several features of the FMSF traces differentiate the patients. The typical trace recorded for the patient from group A (code 5015, Figure 2A) shows distinct oscillations on the reperfusion line (the average value for FM(R) = 51.4), with a typical proportion of myogenic oscillations (the average value of myo(R) = 79.1%). These are often observed for healthy individuals. This trace indicates a relatively good response of the microcirculation to hypoxia, although the oscillations on the baseline are rather poor and may indicate a pathological disturbance. In contrast, the FMSF trace recorded for the patient from group B (code 125, Figure 2B) shows weak oscillations on both the baseline and the reperfusion line. The ischemic response is also flat. There is no increase in myogenic oscillations from the baseline to the reperfusion line. The microcirculatory response to hypoxia is very poor.
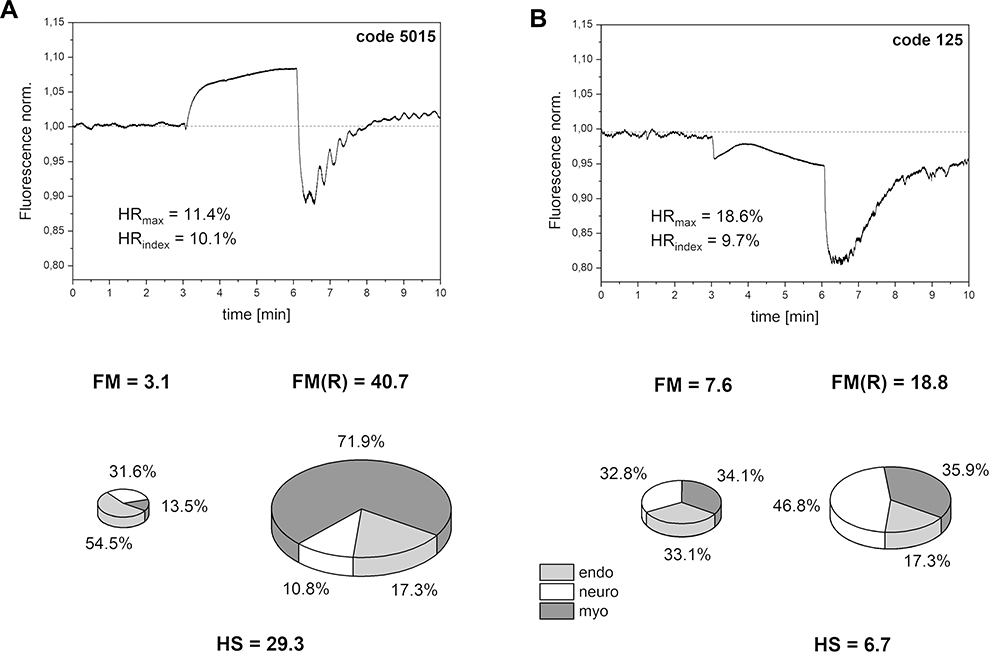 |
Figure 2 Exemplary FMSF traces recorded for two patients with diabetic foot ulcers: (A) group A, code 5015, female, age 41 y., DM2, (B) group B, code 125, female, age 40 y., DM1. |
Comparison of Doppler Ultrasound Results and Amputation History for Individual Groups
Some patients from groups A and B were subjected to lower extremity Doppler ultrasound. None of these patients who were in group A showed significant disturbances in blood flow (code 5014, code 1032, code 1014, code 1029, code 0054). Those in group B, however, showed constant disturbance of blood flow in their vessels (code 132, code 140, code 0074). One patient (code 0119) underwent revascularization and was excluded from the analysis. These results reveal that HS parameters correlate with USG Doppler results (r = −0.547, p = 0.035). It was also found that in group B amputation was more frequent (code 132, code 0060, code 0074, code 1042, code 0129, code 205). In group A, only one patient had a history of amputation (code 0119). The observed correlation between the HS parameter and USG Doppler results is expected to be rather moderate as both these variables represent different vascular beds.
Discussion
HS Parameter in Relation to Other Diabetic Complications in the Studied Groups
The HS parameter was found to provide clear differentiation of DFU with high accuracy. The results were further correlated with clinical status, as shown in Table 1. Group B showed a severely impaired microcirculatory response to hypoxia compared with group A. Perhaps unsurprisingly, the patients in group B had higher incidences of hypertension, hyperlipidemia, and cardiovascular disease (CVD), as well as neuropathy and nephropathy. Therefore, it seems that many factors contribute to the development of impaired microcirculatory response to hypoxia, which can in turn impair healing.
HRindex Parameter and CVD Complication
In a previous study, we showed that CVD in type 2 diabetes is associated with lower values for the HRindex parameter.11 Based on the data presented in Figure 1, it seems that CVD may both have a negative impact on sensitivity to hypoxia and impair wound healing. The association between diabetic foot ulceration and CVD has been documented previously.19
In the present study, the HRindex parameter was lower for patients in group B compared to those in group A (Table 2). This means that macrovascular disorders are more common in group B. The proportion of patients suffering from CVD is also greater in group B than in group A (Table 1). Based on these results, it can be concluded that in group B there were patients with both impaired microcirculation and macrocirculation disorders. Group A consisted of patients with weakened microcirculation but relatively better macrocirculation.
No Difference in the Incidence of Retinopathy in the Studied Groups
Interestingly, no difference was observed between groups A and B in terms of retinopathy (Table 1). This is explained by the fact that a dominant process leading to retinopathy is based on ischemia-induced retinal neovascularization. According to mechanistic arguments, the correlation between retinopathy and HS should be rather weak. Indeed, no association was found between DFU and diabetic retinopathy.20
Importance of the HS Parameter for the Prediction of Diabetic Foot Healing
Given the results of this study, it can be concluded that the HS parameter representing the microcirculatory response to hypoxia induced by transient ischemia can be used to identify DFU with low prognosis for healing. Some patients in group B were also monitored during re-hospitalization and no improvement was observed, indicating the chronic status of their diabetic ulcers. The satisfactory response to hypoxia seen in patients from group A does not mean that their prognosis for healing is high. In Figure 3, we present FMSF traces for a patient initially assigned to group A (code 1032), together with a measurement performed a year later that would qualify him for group B. Evidently, in this case the disease progressed quickly, as the average value of the HS parameter dropped from 39.3 to 3.1.
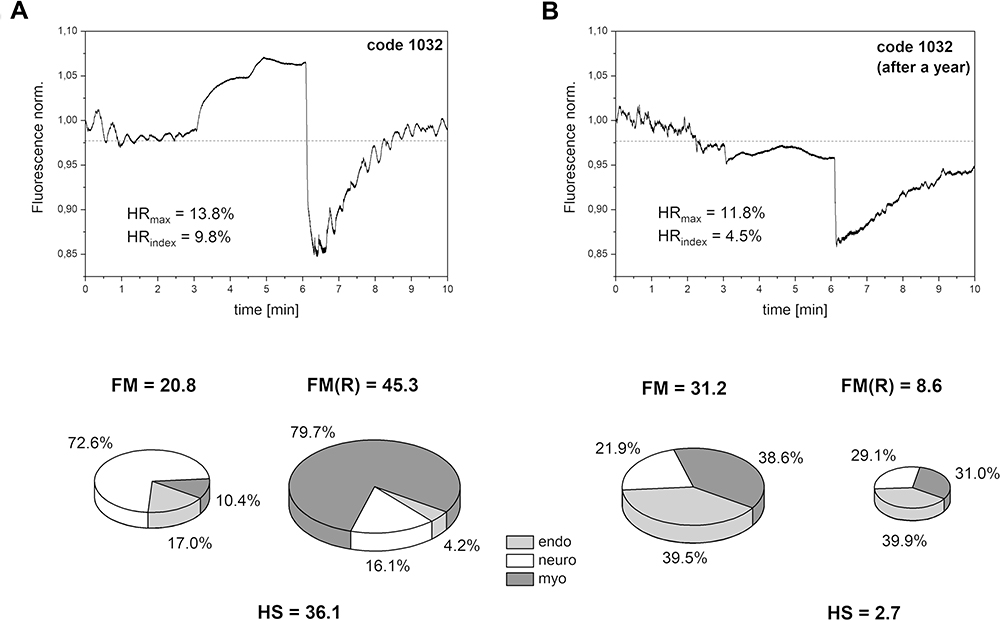 |
Figure 3 Significant changes in FMSF traces recorded at different time points for one patient (group A, code 1032, male, age 67 y., DM2): (A) first measurement, (B) measurement performed after a year. |
A very low value for the HS parameter signifies serious microcirculation disorders. Doppler ultrasound measures macrovascular disturbances. Since changes in microcirculation occur sooner, the FMSF method allows for the detection of disorders at an early stage, allowing for prophylactic or therapeutic interventions or more accurate and complex diagnostic tests.
Although the preliminary results presented here appear very promising, much larger clinical studies are required to establish the threshold below which the healing of diabetic ulcers becomes unlikely. The FMSF technique can be recommended to both monitor the health status diabetic patients and to predict vascular complications including DFU.
Conclusion
The following conclusions can be drawn from the this study:
- the FMSF technique appears to be uniquely suitable for the analysis of basal flowmotion and its response to hypoxia induced by transient ischemia;
- the parameters FM(R) and HS can be used to characterize the flowmotion response to hypoxia;
- DFU can be differentiated based on the flowmotion response to hypoxia and correlated with Doppler ultrasound;
- impaired flowmotion responses to hypoxia can be used to predict DFU with a low prognosis for healing.
Funding
This work was supported by the European Union from the resources of the European Regional Development Fund under the Smart Growth Operational Program, Grant No. POIR. 01.01.01-00-0540/15-00.
Disclosure
JG and AM are inventors of the patents protecting the use of FMSF technology. Prof. Dr. Jerzy Gebicki reports grants from European Regional Development Fund, during the conduct of the study. The authors report no other conflicts of interest in this work.
References
1. Armstrong DG, Boulton AJM, Bus SA. Diabetic foot ulcers and their recurrence. N Engl J Med. 2017;376(24):2367–2375. doi:10.1056/NEJMra1615439
2. Thangarajah H, Vial IN, Grogan RH, et al. HIF-1α dysfunction in diabetes. Cell Cycle. 2010;9(1):75–79. doi:10.4161/cc.9.1.10371
3. Thangarajah H, Yao D, Chang EI, et al. The molecular basis for impaired hypoxia-induced VEGF expression in diabetic tissues. Proc Natl Acad Sci U S A. 2009;106(32):13505–13510. doi:10.1073/pnas.0906670106
4. Botusan IR, Sunkari VG, Savu O, et al. Stabilization of HIF-1α is critical to improve wound healing in diabetic mice. Proc Natl Acad Sci U S A. 2008;105(49):19426–19431. doi:10.1073/pnas.0805230105
5. Catrina S-B, Zheng X. Disturbed hypoxic responses as a pathogenic mechanism of diabetic foot ulcers. Diabetes Metab Res Rev. 2016;32(S1):179–185. doi:10.1002/dmrr.2742
6. Catrina SB, Zheng X. Hypoxia and hypoxia-inducible factors in diabetes and its complications. Diabetologia. 2021;64(4):709–716. doi:10.1007/s00125-021-05380-z
7. Lin C, Yin G, Ou M, Zheng S. The effects of HIF-1α and VEGF on wound healing in diabetic mice. Biomed Res. 2017;28(18):8121–8124.
8. Piotrowski L, Urbaniak M, Jedrzejczak B, Marcinek A, Gebicki J. Note: flow mediated skin fluorescence - a novel technique for evaluation of cutaneous microcirculation. Rev Sci Instrum. 2016;87(3):036111. doi:10.1063/1.4945044
9. Katarzynska J, Lipinski Z, Cholewinski T, et al. Non-invasive evaluation of microcirculation and metabolic regulation using flow mediated skin fluorescence (FMSF): technical aspects and methodology. Rev Sci Instrum. 2019;90(10):104104. doi:10.1063/1.5092218
10. Katarzynska J, Borkowska A, Czajkowski P, et al. Flow mediated skin fluorescence technique reveals remarkable effect of age on microcirculation and metabolic regulation in type 1 diabetes. Microvasc Res. 2019;124:19–24. doi:10.1016/j.mvr.2019.02.005
11. Katarzynska J, Borkowska A, Los A, Marcinek A, Cypryk K, Gebicki J. Flow-mediated skin fluorescence (FMSF) technique for studying vascular complications in type 2 diabetes. J Diabetes Sci Technol. 2020;14(3):693–694. doi:10.1177/1932296819895544
12. Nilsson H, Aalkjaer C. Vasomotion: mechanisms and physiological importance. Mol Interv. 2003;3(2):79–89. doi:10.1124/mi.3.2.79
13. Rossi M, Carpi A, Galetta F, Franzoni F, Santoro G. The investigation of skin blood flowmotion: a new approach to study the microcirculatory impairment in vascular diseases? Biomed Pharmacother. 2006;60(8):437–442. doi:10.1016/j.biopha.2006.07.012
14. Aalkjær C, Boedtkjer D, Matchkov V. Vasomotion – what is currently thought? Acta Physiol. 2011;202(3):253–269. doi:10.1111/j.1748-1716.2011.02320.x
15. Cole WC, Gordon GR, Braun AP. Cellular and ionic mechanisms of arterial vasomotion. In: Hashitani H, Lang RJ, editors. Smooth Muscle Spontaneous Activity: Physiological and Pathological Modulation. Singapore: Springer Singapore; 2019:297–312.
16. Gebicki J, Katarzynska J, Cholewinski T, Sieron L, Marcinek A. Flowmotion monitored by flow mediated skin fluorescence (FMSF): a tool for characterization of microcirculatory status. Front Physiol. 2020;11:702. doi:10.3389/fphys.2020.00702
17. Gebicki J, Marcinek A, Zielinski J. Assessment of microcirculatory status based on stimulation of myogenic oscillations by transient ischemia: from health to disease. Vasc Health Risk Manag. 2021;17:33–36. doi:10.2147/VHRM.S292087
18. Stang D, Young M. Selection and application of a diabetic foot ulcer classification system in Scotland: part 2. Diabet Foot J. 2018;21(2):100–105.
19. Brownrigg JRW, Davey J, Holt PJ, et al. The association of ulceration of the foot with cardiovascular and all-cause mortality in patients with diabetes: a meta-analysis. Diabetologia. 2012;55(11):2906–2912. doi:10.1007/s00125-012-2673-3
20. Hwang DJ, Lee KM, Park MS, et al. Association between diabetic foot ulcer and diabetic retinopathy. PLoS One. 2017;12(4):e0175270. doi:10.1371/journal.pone.0175270
 © 2021 The Author(s). This work is published and licensed by Dove Medical Press Limited. The full terms of this license are available at https://www.dovepress.com/terms.php and incorporate the Creative Commons Attribution - Non Commercial (unported, v3.0) License.
By accessing the work you hereby accept the Terms. Non-commercial uses of the work are permitted without any further permission from Dove Medical Press Limited, provided the work is properly attributed. For permission for commercial use of this work, please see paragraphs 4.2 and 5 of our Terms.
© 2021 The Author(s). This work is published and licensed by Dove Medical Press Limited. The full terms of this license are available at https://www.dovepress.com/terms.php and incorporate the Creative Commons Attribution - Non Commercial (unported, v3.0) License.
By accessing the work you hereby accept the Terms. Non-commercial uses of the work are permitted without any further permission from Dove Medical Press Limited, provided the work is properly attributed. For permission for commercial use of this work, please see paragraphs 4.2 and 5 of our Terms.