")
Back to Journals » Journal of Asthma and Allergy » Volume 7
Differential serum protein markers and the clinical severity of asthma
Authors Meyer N, Nuss SJ, Rothe T, Siebenhüner A, Akdis CA, Menz G
Received 3 September 2013
Accepted for publication 29 October 2013
Published 25 April 2014 Volume 2014:7 Pages 67—75
DOI https://doi.org/10.2147/JAA.S53920
Checked for plagiarism Yes
Review by Single anonymous peer review
Peer reviewer comments 3
Norbert Meyer,1,2 Sarah Janine Nuss,1 Thomas Rothe,1 Alexander Siebenhüner,1 Cezmi A Akdis,2 Günter Menz1
1Hochgebirgsklinik Davos, Davos-Wolfgang, Switzerland; 2Swiss Institute of Allergy and Asthma Research (SIAF), Davos Platz, Switzerland
Background: Asthma is a heterogeneous disease characterized by different clinical phenotypes and the involvement of multiple inflammatory pathways. During airway inflammation, many cytokines and chemokines are released and some are detectable in the sera.
Objective: Serum chemokines and cytokines, involved in airway inflammation in asthma patients, were investigated.
Methods: A total of 191 asthma patients were classified by hierarchical cluster analysis, including the following parameters: forced expiratory volume in 1 second (FEV1), eosinophil cationic protein (ECP) serum levels, blood eosinophils, Junipers asthma symptom score, and the change in FEV1, ECP serum levels, and blood eosinophils after 3 weeks of asthma therapy. Serum proteins were measured by multiplex analysis. Receiver operating characteristic (ROC) curves were used to evaluate the validity of serum proteins for discriminating between asthma clusters.
Results: Classification of asthma patients identified one cluster with high ECP serum levels, increased blood eosinophils, low FEV1 values, and good FEV1 improvement in response to asthma therapy (n=60) and one cluster with low ECP serum levels, low numbers of blood eosinophils, higher FEV1 values, and no FEV1 improvement in response to asthma therapy (n=131). Serum interleukin (IL)-8, eotaxin, vascular endothelial growth factor (VEGF), cutaneous T-cell-attracting chemokine (CTACK), growth-related oncogene (GRO)-α, and hepatocyte growth factor (HGF) were significantly different between the two clusters of asthma patients. ROC analysis for serum proteins calculated a sensitivity of 55.9% and specificity of 75.8% for discriminating between them.
Conclusion: Serum cytokine and chemokine levels might be predictors for the severity of asthmatic inflammation, asthma control, and response to therapy, and therefore might be useful for treatment optimization.
Keywords: asthma, cluster, phenotype, serum cytokines
Introduction
Asthma is a chronic inflammatory disorder of the airways, characterized by reversible airflow obstruction, airway hyper-responsiveness, and typical clinical symptoms such as wheezing, breathlessness, and chest tightness as a result of inflammation in the airways. The heterogeneity of the clinical presentation of asthma patients suggests that different inflammatory pathways play a role in the pathogenesis of asthma.1 Many cell types, including immune cells and tissue cells, are involved in asthmatic inflammation, and several molecular and cellular pathways are activated for the release of chemokines and cytokines.2 In allergic asthma, allergen-specific T-helper (Th)-2 lymphocytes release interleukin (IL)-4, -9, and -13, which are essential for the production of allergen-specific immunoglobulin E (IgE).3 IgE binding on the high-affinity FC ε receptor 1 (FcεR1) activates mast cells and eosinophils, which subsequently secrete inflammatory mediators.4 These mediators cause bronchial smooth muscle contraction and increase airway hyper-reactivity, a cardinal feature of asthma.5 Additionally, other effector T-cell subsets, like Th1 or Th17 cells, can contribute to airway inflammation.6 Th17 cells are thought to be mainly involved in rhinovirus-induced asthma7 and neutrophil recruitment to the airways,8 whereas Th1 cells are important for induction of apoptosis in tissue cells.9
The identification of inflammatory proteins that are specific for clinical asthma phenotypes is one important approach to facilitate the diagnosis, therapy, and monitoring of asthma. Recently, it was demonstrated that the presence of serum IL-8, vascular endothelial growth factor (VEGF), and metalloproteinase-9 was associated with diisocyanate-induced asthma.10 In addition, increased IL-17 levels in sera of patients with severe asthma were described,11 and an association between serum IL-32 levels and treatment response in asthma patients was demonstrated.12 Moreover, differences in serum cytokine levels between allergic and non-allergic asthma have been demonstrated.13
In this study, we investigated serum and chemokine levels in 191 asthma patients who were classified into two groups according to several clinical and physiological parameters and the response to asthma therapy. Our hypotheses were that these two clinically different groups of asthma patients are characterized by different cytokine and chemokine serum levels and that the upregulation of cytokine and chemokine serum levels might indicate poorly controlled asthma.
Methods
Study design
Adult patients had a physician diagnosis of asthma according to Global Strategy for Asthma Management and Prevention, Global Initiative for Asthma (GINA) guidelines.To exclude chronic obstructive pulmonary disease, asthma patients had to show a reversibility in forced expiratory volume in 1 second (FEV1) in response to a short-acting β2-agonist of at least 12% predicted. Asthma patients with an acute respiratory infection were excluded. All asthma patients included in the study were admitted to, and treated for at least 3 weeks at, the high-altitude clinic Davos-Wolfgang, which is located 1,600 m above sea level in the Swiss Alps. The patients were admitted for a rehabilitation and asthma treatment optimization program and were treated according to the recent GINA guidelines; there were no acute hospitalizations. All medications related to asthma treatment and changes to it during the stay in the high-altitude clinic are shown in Table 1. To classify these patients as atopic or non-atopic, we evaluated their medical history, and skin prick tests were performed with animal dander, food allergens, pollens, fungi, and latex. The NIOX system (Aerocrine, Solna, Sweden) was used to measure fractional exhaled nitric oxide (NO) according to the manufacturer’s instructions. Blood eosinophils and eosinophil cationic protein (ECP) were analyzed in the laboratory of the high-altitude clinic. All clinical features and examinations were evaluated on the day that the patients arrived in the clinic (entry) and after 3 weeks (discharge) and are shown in Table 1. The multidisciplinary treatment at high altitude, consisting of personalized treatment plans with physiotherapy and education, aimed to achieve full asthma control with the lowest possible dose of asthma medication. The six-item Asthma Control Questionnaire (Junipers symptom score) was used to assess the level of asthma control.14 Responses to each item were rated on a six-point scale; the mean was subsequently calculated and ranged between 0 (totally controlled) and 6 (severely uncontrolled). Informed consent was obtained from all asthma patients. The study was approved by the local ethical committees of the Cantons of Grissons and Zürich. Data were stored in a database and analyzed using SPSS 17.0 (SPSS Schweiz AG, Zürich, Switzerland) and Graphpad Prism 4 (GraphPad Software, Inc., La Jolla, CA, USA).
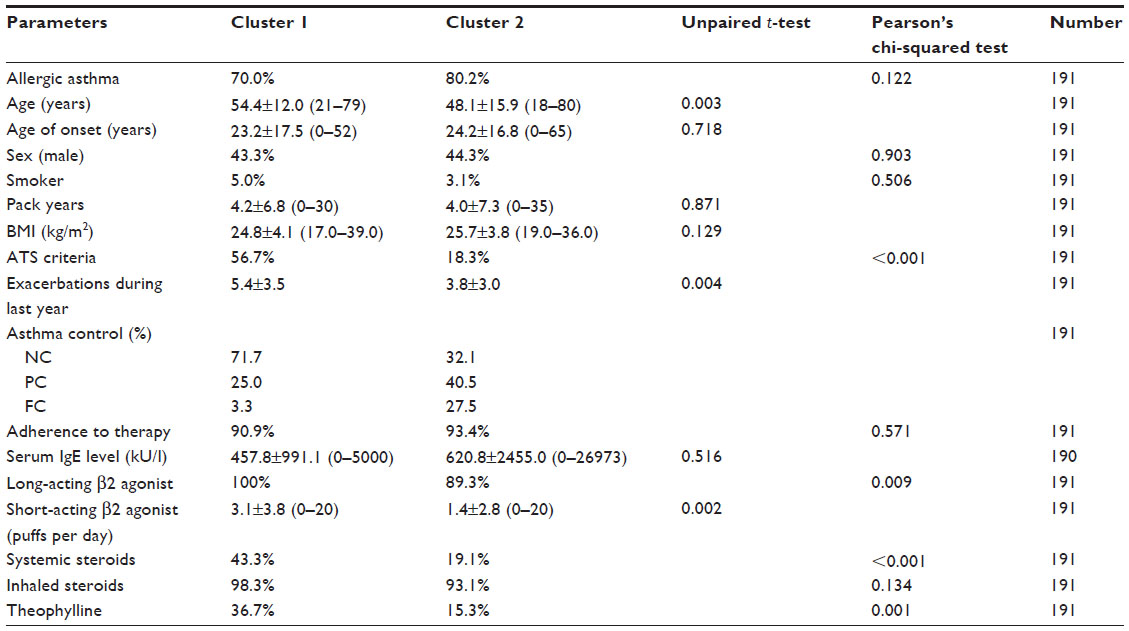 | Table 1 Characterization of asthma patients |
Statistical analysis and cluster formation
Because the total number of patients was limited to 191 in this study, we divided the asthma patients into two groups by hierarchical cluster analysis. Power analysis calculated a total sample size of 59 patients for each group (effect size =0.4, α=0.05, 1 – β =0.95). Pearson’s chi-squared test was used for statistical analyses of categorical variables because the datasets in each cluster were large enough and the values of cluster 1 and 2 are independent. Mann–Whitney U test was used for statistical analyses of cytokine concentrations because they were not normally distributed. Multiple testing correction was performed by the Benjamini and Hochberg false discovery rate test. Unpaired t-test analyses were used for clinical and therapy features, and the calculations are shown as mean ± standard error of the mean. The paired t-test was used to compare parameters before and after therapy. P-values below 0.05 were considered significant. Cytokines, which were significantly different between the asthma clusters, were used for principal component analysis to reduce the variables to a principal component. Subsequently, receiver operating characteristic (ROC) analysis with the identified principal component was performed.
Cytokine and chemokine measurements
Serum probes from asthma patients were taken upon entry of the patients and stored at −80°C until they were analyzed. Serum cytokines were quantified by multiplex measurements (Bioplex; Bio-Rad Laboratories, Hercules, CA, USA). Of 48 serum cytokines or chemokines, 36 were in the detection range in at least 50% of the asthma patients and used for analyses.
Results
Classification of asthma patients according to markers for clinical asthma severity and treatment response
Asthma patients were classified according to Junipers symptom score, FEV1, serum ECP, circulating eosinophils, and the improvement in FEV1, ECP, and circulating eosinophils after 3 weeks of therapy in the high-altitude clinic in Davos-Wolfgang. Using hierarchical cluster analysis, two clusters of asthma patients were obtained (Figure 1A). Asthma patients in cluster 1 (n=60) had significantly higher Junipers symptom scores, lower FEV1 values, higher ECP serum levels, and a tendency towards higher blood eosinophils than asthma patients in cluster 2 (n=131) on the day they arrived in the clinic (Figure 1B). The response to asthma therapy differed between these two groups. Asthma patients in cluster 1 showed a higher FEV1 improvement, blood eosinophil decrease, and serum ECP decrease after 3 weeks of intensive asthma therapy (Figure 1C).
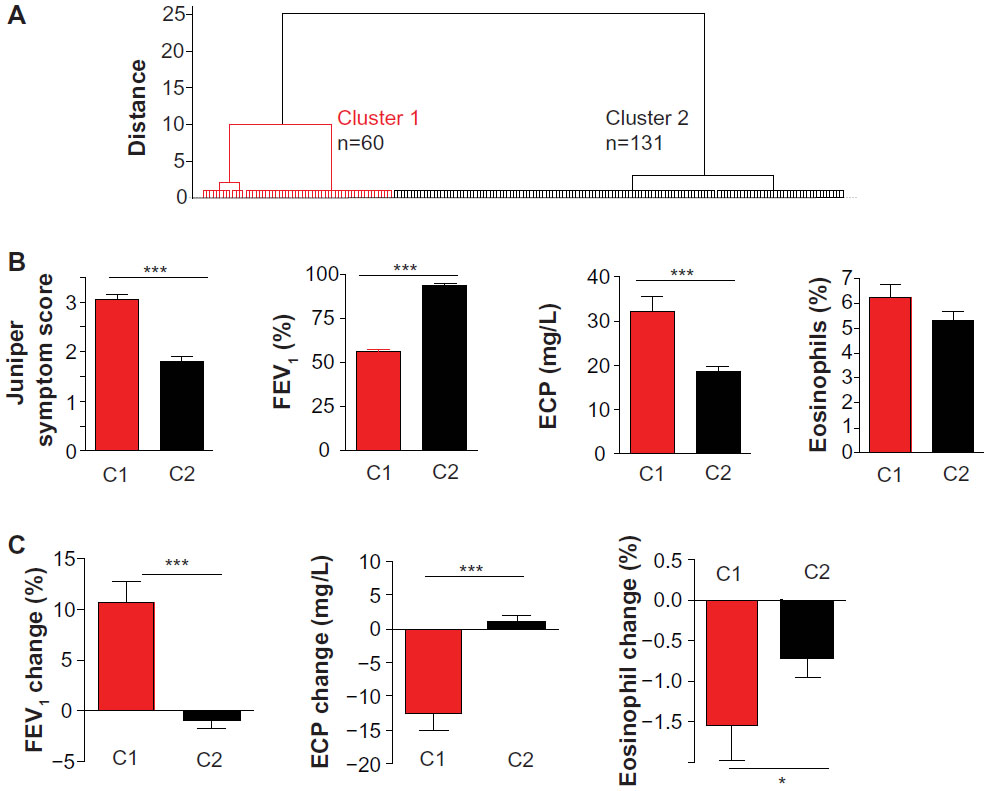 | Figure 1 Classification of asthma patients according to airway inflammation. |
Characterization of asthma patients in clusters 1 and 2
Asthma patients in clusters 1 and 2 were further characterized by physical examination results, medications, and questionnaire data. The frequency of asthma patients fulfilling American Thoracic Society criteria (for detailed information see http://www.thoracic.org) for severe asthma was significantly higher in cluster 1 than in cluster 2. The average age of patients in cluster 1 was higher (54.4±12.0 years) than of those in cluster 2 (48.1±15.9 years), the asthma patients in cluster 1 had significantly more asthma exacerbations over the previous 12 months and less well controlled asthma. In addition, asthma patients in cluster 1 received systemic steroids, β2-mimetics (long and short acting), and theophylline as asthma medications more frequently as at the day of entry. There was no difference between these two groups in terms of age of onset, sex, exposure to cigarette smoke, body mass index, serum IgE levels, allergic sensitization, adherence to therapy, and therapy with inhaled steroids (see Table 1).
To further specify the response to asthma therapy, FEV1, serum ECP, blood eosinophils, and exhaled NO were measured on the day of entry and at discharge after 3 weeks. FEV1 increased significantly from 56.0%±13.6% to 66.7%±19.1% in asthma patients belonging to cluster 1, whereas there was no significant change in FEV1 in asthma patients in cluster 2 (entry 93.8%±16.3%; discharge 92.9%±18.2%, Figure 2A). In addition, ECP serum levels decreased from 32.3±25.8 μg/L to 19.8±16.2 μg/L in asthma patients in cluster 1, whereas they did not change for those in cluster 2 (entry 18.7±12.5 μg/L, discharge 19.4±13.9 μg/L, Figure 2A). Blood eosinophils and exhaled NO significantly decreased in both groups after 3 weeks of therapy. Concerning asthma medication, there was no significant change in systemic steroids, inhaled steroids, and long-acting β2 agonists between entry and discharge in both clusters, whereas the frequency of short-acting β2 agonist usage decreased significantly in both groups after asthma therapy (Figure 2B).
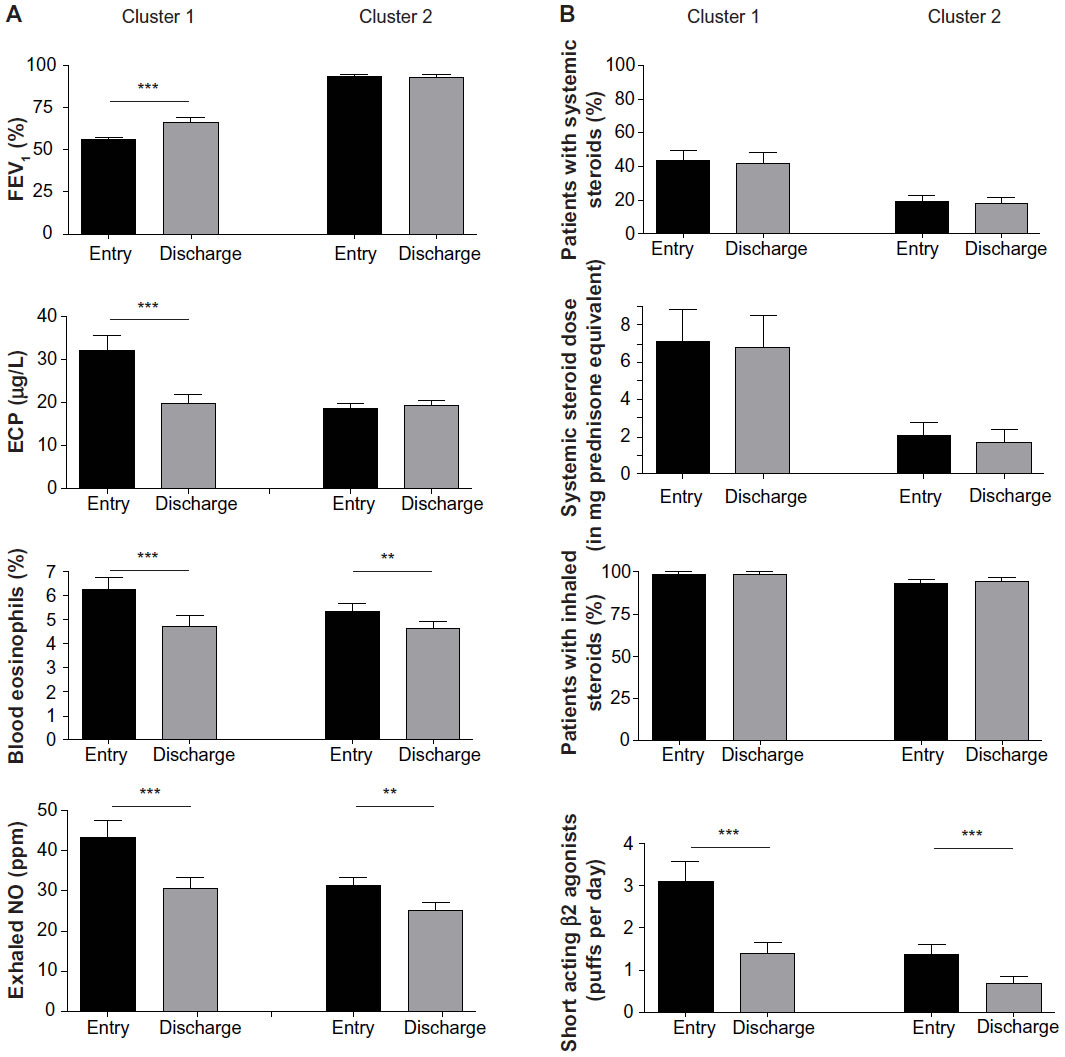 | Figure 2 Asthma patients in cluster 1 respond better to asthma therapy. |
Taken together, asthma patients in cluster 1 are characterized by a less well controlled disease and better response to asthma therapy than asthma patients in cluster 2.
Increased serum inflammatory protein levels in asthma patients between cluster 1 and cluster 2
Next, inflammatory serum protein levels in all asthma patients were analyzed. IL-8, eotaxin, VEGF, cutaneous T-cell-attracting chemokine (CTACK), growth-related oncogene (GRO)-α, and hepatocyte growth factor (HGF) in the sera of asthma patients belonging to cluster 1 were significantly higher than in patients in cluster 2 (Figure 3A; for full names of the following cytokines and chemokines, see Table S1). There was no significant difference in IL-1Ra, IL-2, -4, -6, -9, -10, -13, -15, -16, -17, -18, IFN-γ, TNF-α, MIP-1α, MIP-1β, MIF, MIG, SCF, SCGFβ, G-CSF, IFN-α, LIF, MCP-3, MCSF, FGF, SDF-1α, MCP-1, IP-10, and TRAIL levels (see Table S1).
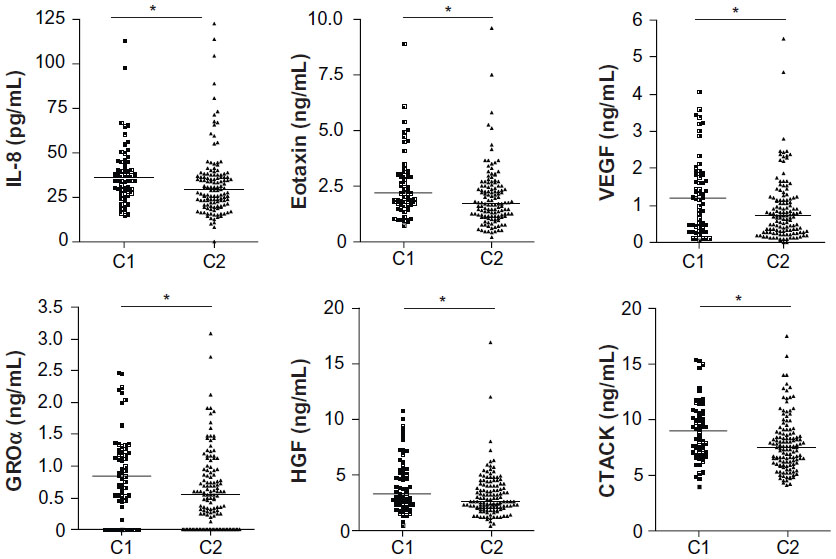 | Figure 3 Upregulation of serum cytokines and chemokines in asthma patients belonging to cluster 1. |
Principal component analysis of the concentrations of all cytokines and chemokines that are upregulated in cluster 1 was performed. An ROC for the principal component revealed a sensitivity of 55.9% and a specificity of 75.8% for distinguishing between asthma patients in clusters 1 and 2 (area under the curve [AUC] 0.683; Figure 4A). The AUC for single cytokines was lower than the principal component analysis of all upregulated cytokines in cluster 1 (AUC IL-8: 0.645; CTACK: 0.639; eotaxin: 0.640; GROα: 0.632; HGF: 0.625; VEGF: 0.627; Figure 4B). In addition, there is a significant negative correlation between cytokine serum levels of the upregulated cytokines in cluster 1 and FEV1 (Figure 4C).
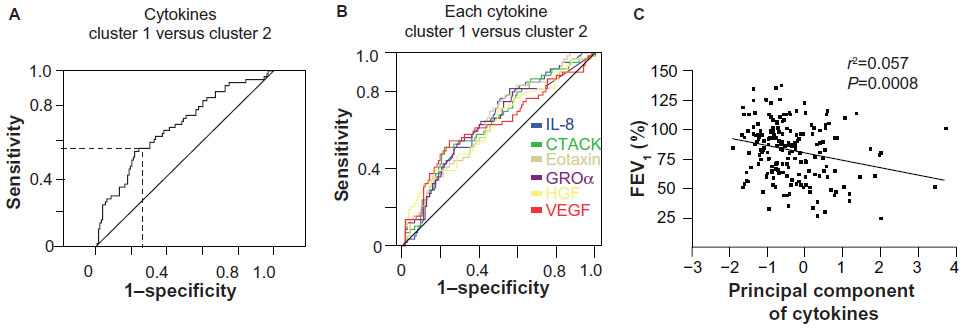 | Figure 4 Prognostic value of serum cytokines to distinguish between asthma patients belonging to cluster 1 or 2. |
Discussion
Using hierarchical cluster analysis with the clinical routine parameters FEV1, ECP serum levels, blood eosinophil levels, or Junipers asthma symptom score, we were able to classify our population of asthma patients into two groups. One group of asthma patients (cluster 1) was characterized by higher ECP serum levels, higher numbers of circulating eosinophils, lower FEV1 values, and better response to asthma therapy. Further characterization of these asthma patients demonstrated that they had less well controlled asthma with more exacerbations over the previous year. Importantly, these asthma patients had higher serum levels of certain pro-inflammatory cytokines and chemokines. In addition, the profile of serum cytokines could predict, with a sensitivity of 55.9% and specificity of 75.8%, the cluster to which asthma patients belonged.
Asthma is a heterogeneous disease, which could be divided into subgroups according to therapy response, fixed airway obstruction, obesity, or trigger factors such as allergens, air pollution, occupational irritants, cigarette smoke, aspirin, and exercise.15 The identification of asthma phenotype-specific inflammatory pathways is one important approach to improve the diagnosis and treatment of asthma. In this context, the term endotype16 was recently introduced, which suggests that asthma phenotypes are characterized by certain inflammatory mechanisms, which correlate with treatment response.1 Accordingly, we classified the asthma patients into two groups by parameters used routinely in our clinic and that reflected clinical asthma severity and response to asthma treatment. Serum cytokine and chemokine levels were measured to investigate if different inflammatory pathways were activated in asthma patients from clusters 1 and 2. Interestingly, in asthma patients from cluster 1, higher serum levels of IL-8, eotaxin, VEGF, CTACK, GROα, and HGF were present, indicating that different inflammatory and molecular mechanisms were activated. In addition, IL-17 had the tendency to be elevated in cluster 1 compared with cluster 2. Serum IL-17 is elevated in severe asthma11 and amplifies local airway inflammation by induction of IL-6 in bronchial epithelial cells17 or IL-8 in human airway epithelial cells.18 IL-17 and Th2 cytokine-producing T-cells also promote asthmatic inflammation via the upregulation of eotaxin in bronchial epithelial cells.19 In addition, in bronchial biopsies from asthmatic patients, there is a high expression of VEGF,20 which is a key regulator of blood vessel growth in the airways of asthma patients via the promotion of proliferation and differentiation of endothelial cells and inducing vascular leakage and increased permeability.21 One possible explanation for elevated inflammation-related cytokines and chemokines in the sera of asthma patients with lower FEV1 values and more frequent exacerbations may be that airway inflammation may lead to the generation of large amounts of cytokines, which may enter into the circulation, resulting in elevated serum concentrations. Therefore, the upregulation of certain cytokines and chemokines in the sera may be an indicator for physicians to optimize or initiate asthma treatment. Interestingly, asthma patients in cluster 1 and 2 were all mostly compliant with the medication therapy, indicating that the FEV1 improvement in asthma patients with clinically more severe asthma (cluster 1) might be due to treatment optimization and not to an improvement in medication compliance.
Although treatment management of asthma patients by measurement of sputum eosinophils could decrease the number of asthma exacerbations and steroid dose,22 eosinophils may not be useful in the prediction of exacerbations for all asthma types because, besides eosinophilic asthma, neutrophilic, mixed granulocytic, and paucigranulocytic asthma subgroups also exist.23 In addition, the induction of induced sputa may not be technically possible in all asthma patients. Analysis of serum eosinophils is a simple method that is routinely undertaken for asthma patients. However, in our study, serum eosinophils were not significantly elevated in patients with clinically more severe asthma (cluster 1) in contrast with the identified serum proteins, suggesting that they are also upregulated in exacerbated non-eosinophilic asthma. The higher levels of pro-inflammatory cytokines and chemokines in the serum indicate asthma patients with poorly controlled asthma. Therefore, measuring serum cytokines as a diagnostic tool might be useful for the optimization of asthma treatment. However, this study has not assessed the direct effect of asthma medications on serum cytokines. Therefore, the effect of asthma treatment on the serum cytokines upregulated in cluster 1 should be investigated in future studies. Less invasive methods for the assessment of local airway inflammation include analysis of nitrates24 or pH values25 in exhaled breath condensates, which are related to asthma control and may be interesting tools for asthma management in the future. These methods may also be combined with the measurement of serum cytokines and chemokines.
Repeated airway inflammation causes structural airway changes, known as airway remodeling, including smooth muscle hypertrophy, goblet cell hyperplasia, subepithelial fibrosis, and angiogenesis.21 These structural changes influence the reversibility of airway obstruction and increase disease severity.26 Inflammatory markers, which can predict the severity of airway inflammation, could be important for optimal asthma treatment decisions to avoid airway remodeling caused by chronic inflammation. We demonstrate that certain serum cytokines and chemokines could identify asthma patients with clinically more severe asthma and better treatment response.
Conclusion
Certain pro-inflammatory serum cytokines and chemokines are important markers for the severity and activity of asthma, asthma control, and treatment response. The assessment of systemic immune response by serum levels of cytokines and chemokines in asthma patients might be an important tool for monitoring asthma patients and for asthma therapy optimization.
Disclosure
The NM, CAA and GM are supported by the European Allergy and Asthma Center Davos (EACD), SNF grants No 32-132899 and the Christine Kühne Center for Allergy Research and Education (CK-CARE).
References
Lötvall J, Akdis CA, Bacharier LB, et al. Asthma endotypes: a new approach to classification of disease entities within the asthma syndrome. J Allergy Clin Immunol. 2011;127(2):355–360. | |
Kim HY, DeKruyff RH, Umetsu DT. The many paths to asthma: phenotype shaped by innate and adaptive immunity. Nat Immunol. 2010;11(7):577–584. | |
Robinson DS, Hamid Q, Ying S, et al. Predominant TH2-like bronchoalveolar T-lymphocyte population in atopic asthma. N Engl J Med. 1992;326(5):298–304. | |
Walker C, Bauer W, Braun RK, et al. Activated T cells and cytokines in bronchoalveolar lavages from patients with various lung diseases associated with eosinophilia. Am J Respir Crit Care Med. 1994;150(4):1038–1048. | |
Akdis CA, Akdis M. Mechanisms and treatment of allergic disease in the big picture of regulatory T cells. J Allergy Clin Immunol. 2009;123(4):735–746; quiz 747–748. | |
Palomares O, Yaman G, Azkur AK, Akkoc T, Akdis M, Akdis CA. Role of Treg in immune regulation of allergic diseases. Eur J Immunol. 2010;40(5):1232–1240. | |
Wiehler S, Proud D. Interleukin-17A modulates human airway epithelial responses to human rhinovirus infection. Am J Physiol Lung Cell Mol Physiol. 2007;293(2):L505–L515. | |
Hellings PW, Kasran A, Liu Z, et al. Interleukin-17 orchestrates the granulocyte influx into airways after allergen inhalation in a mouse model of allergic asthma. Am J Respir Cell Mol Biol. 2003;28(1):42–50. | |
Meyer N, Zimmermann M, Bürgler S, et al. IL-32 is expressed by human primary keratinocytes and modulates keratinocyte apoptosis in atopic dermatitis. J Allergy Clin Immunol. 2010;125(4):858–865. e10. | |
Kim JH, Kim JE, Choi GS, Him HY, Ye YM, Park HS. Serum cytokines markers in toluene diisocyanate-induced asthma. Respir Med. 2011;105(7):1091–1094. | |
Agache I, Ciobanu C, Agache C, Anghel M. Increased serum IL-17 is an independent risk factor for severe asthma. Respir Med. 2010;104(8):1131–1137. | |
Meyer N, Christoph J, Makrinioti H, et al. Inhibition of angiogenesis by IL-32: possible role in asthma. J Allergy Clin Immunol. 2012;129(4):964–973. e7. | |
Pukelsheim K, Stoeger T, Kutschke D, Ganguly K, Wjst M. Cytokine profiles in asthma families depend on age and phenotype. PLoS One. 2010;5(12):e14299. | |
Juniper EF, O’Byrne PM, Guyatt GH, Ferrie PJ, King DR. Development and validation of a questionnaire to measure asthma control. Eur Respir J. 1999;14(4):902–907. | |
Balzar S, Strand M, Nakano T, Wenzel SE. Subtle immunodeficiency in severe asthma: IgA and IgG2 correlate with lung function and symptoms. Int Arch Allergy Immunol. 2006;140(2):96–102. | |
Anderson GP. Endotyping asthma: new insights into key pathogenic mechanisms in a complex, heterogeneous disease. Lancet. 2008;372(9643):1107–1119. | |
Burgler S, Ouaked N, Bassin C, et al. Differentiation and functional analysis of human T(H)17 cells. J Allergy Clin Immunol. 2009;123(3):588–595,595. e1–e7. | |
Jones CE, Chan K. Interleukin-17 stimulates the expression of interleukin-8, growth-related oncogene-alpha, and granulocyte-colony-stimulating factor by human airway epithelial cells. Am J Respir Cell Mol Biol. 2002;26(6):748–753. | |
Wang YH, Voo KS, Liu B, et al. A novel subset of CD4(+) T(H)2 memory/effector cells that produce inflammatory IL-17 cytokine and promote the exacerbation of chronic allergic asthma. J Exp Med. 2010;207(11):2479–2491. | |
Hoshino M, Nakamura Y, Hamid QA. Gene expression of vascular endothelial growth factor and its receptors and angiogenesis in bronchial asthma. J Allergy Clin Immunol. 2001;107(6):1034–1038. | |
Detoraki A, Granata F, Staibano S, Rossi FW, Marone G, Genovese A. Angiogenesis and lymphangiogenesis in bronchial asthma. Allergy. 2010;65(8):946–958. | |
Green RH, Brightling CE, McKenna S, et al. Asthma exacerbations and sputum eosinophil counts: a randomised controlled trial. Lancet. 2002;360(9347):1715–1721. | |
Simpson JL, Scott R, Boyle MJ, Gibson PG. Inflammatory subtypes in asthma: assessment and identification using induced sputum. Respirology. 2006;11(1):54–61. | |
Malinovschi A, Pizzimenti S, Sciascia S, Heffler E, Badiu I, Rolla G. Exhaled breath condensate nitrates, but not nitrites or FENO, relate to asthma control. Respir Med. 2011;105(7):1007–1013. | |
Kostikas K, Papaioannou AI, Tanou K, et al. Exhaled NO and exhaled breath condensate pH in the evaluation of asthma control. Respir Med. 2011;105(4):526–532. | |
Tillie-Leblond I, de Blic J, Jaubert F, Wallaert B, Scheinmann P, Gosset P. Airway remodeling is correlated with obstruction in children with severe asthma. Allergy. 2008;63(5):533–541. |
Supplementary material
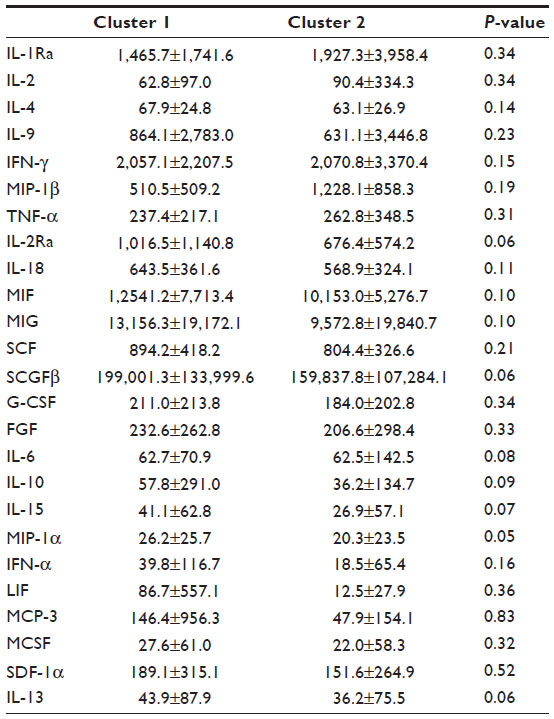 | Table 1 Serum cytokine and chemokine levels in asthma patients belonging to cluster 1 or to cluster 2 |
 © 2014 The Author(s). This work is published and licensed by Dove Medical Press Limited. The full terms of this license are available at https://www.dovepress.com/terms.php and incorporate the Creative Commons Attribution - Non Commercial (unported, v3.0) License.
By accessing the work you hereby accept the Terms. Non-commercial uses of the work are permitted without any further permission from Dove Medical Press Limited, provided the work is properly attributed. For permission for commercial use of this work, please see paragraphs 4.2 and 5 of our Terms.
© 2014 The Author(s). This work is published and licensed by Dove Medical Press Limited. The full terms of this license are available at https://www.dovepress.com/terms.php and incorporate the Creative Commons Attribution - Non Commercial (unported, v3.0) License.
By accessing the work you hereby accept the Terms. Non-commercial uses of the work are permitted without any further permission from Dove Medical Press Limited, provided the work is properly attributed. For permission for commercial use of this work, please see paragraphs 4.2 and 5 of our Terms.