")
Back to Journals » OncoTargets and Therapy » Volume 10
Differential radiation response between normal astrocytes and glioma cells revealed by comparative transcriptome analysis
Authors Gong L, Gu JC, Ge JW, Wu X, Zhang C, Yang C, Weng WJ, Gao GY, Feng JF, Mao Q
Received 15 June 2017
Accepted for publication 9 October 2017
Published 4 December 2017 Volume 2017:10 Pages 5755—5764
DOI https://doi.org/10.2147/OTT.S144002
Checked for plagiarism Yes
Review by Single anonymous peer review
Peer reviewer comments 2
Editor who approved publication: Dr William C. Cho
Liang Gong,1,* Jiacheng Gu,2,* Jianwei Ge,2 Xiang Wu,2 Chao Zhang,2 Chun Yang,2 Weiji Weng,2 Guoyi Gao,2 Junfeng Feng,2 Qing Mao2
1Department of Neurosurgery, Punan Hospital of Shanghai, 2Department of Neurosurgery, Renji Hospital, School of Medicine, Shanghai Jiao Tong University, Shanghai, People’s Republic of China
*These authors contributed equally to this work
Abstract: Normal astrocytes are more resistant to radiation than glioma cells. Radiation-resistant glioma cells and normal astrocytes usuallly share similar mechanisms of radioresistance. Investigation of the underlying mechanisms of differential radiation response between normal astrocytes and glioma cells is thus significant for improvement of glioma treatment. Here, we report on the differential radiation responses between normal astrocytes and glioma cells at the transcriptome level. Human astrocytes (HA) and U251 glioma cell lines were used as in vitro models. The transcriptome profiles of radiation-treated and nontreated HA and U251 cells were generated by next-generation sequencing. In total, 296 mRNAs and 224 lncRNAs in HA and 201 mRNAs and 107 lncRNAs in U251 were found to be differentially expressed after radiation treatment. Bioinformatics analyses indicated that radiation causes similar alterations in HA and U251 cells, while several key pathways involved in cancer development and radiation resistance, including P53, TGF-β, VEGF, Hippo and serotonergic synapse pathways, were oppositely regulated by radiation treatment, suggesting their important role in this process. Furthermore, we showed the critical role of Hippo/YAP signaling in radiation resistance of glioma cells. In summary, our findings revealed novel insights about differential responses between normal astrocytes and glioma cells. Our work suggested that YAP inhibitor could not be used in combination with radiation for glioma treatment.
Keywords: radiation response, radiation resistance, transcriptome, glioma
Introduction
Glioma is the most common and aggressive brain tumor that accounts for high rates of cancer-related mortality.1,2 Even with aggressive treatment, therapy resistance and tumor recurrence occur in a majority of patients.3,4 Thus, there is a clear need to develop new therapeutic strategies to improve outcome for glioma patients.
The current standard of treatment for glioma is surgical resection followed by radiation treatment.5 Radiation therapy has been demonstrated as an effective tool for glioma, which is usually applied in a course of multiple fractions over weeks to reduce the normal cell toxicity.3,6 The rationale of using radiation to treat glioma is based on the fact that the proliferating glioma cancer cells are more sensitive to the radiation treatment than normal astrocytes.7 However, the exact mechanisms underlying the differential response between glioma cells and normal astrocytes have remained elusive. Understanding these mechanisms is critical for improvement of radiation treatment by both enhancing the cytotoxicity to glioma cancer cells and reducing the side effects to normal astrocytes.
On the other hand, glioma cells develop radiation resistance to enhance survival by regulating signaling pathways involving cancer stem cells,8,9 hypoxia,10 proliferation,11 infiltration and angiogenesis.12 Some of these share the similar mechanism with normal astrocytes.7 For example, normal cells are less sensitive than rapidly proliferating cancer cells for the DNA damage response.1 The glioma cells develop radiation resistance by a similar mechanism that they overexpress effectors, such as ATM, ATR, Chk1, Chk2 and Rad17, to activate P53 or inactivate cyclin-dependent kinases, thereby halting cell cycle progression and starting DNA repair.13 Thus, improvement of our understanding about the differential responses between normal astrocytes and glioma cells is necessary for developing radiosensitizers for glioma.
In this study, to explore the underlying molecular mechanisms of differential response between normal astrocytes and glioma cells, we characterized the transcriptome profile of a radiation-treated and nontreated normal astrocyte cell line (human astrocyte [HA]) and glioma cell line (U251) by next-generation sequencing. Our results pointed to potential pathways related to radiation resistance of glioma cells and identified the critical role of Hippo/YAP signaling pathway in this process.
Material and methods
Cell culture and radiation treatment
U251 and SNB19 cells were purchased from American Type Culture Collection (ATCC) were cultured in Eagle’s Minimum Essential Medium (EMEM) (Thermo Fisher Scientific, Waltham, MA, USA) supplemented with 2 mM glutamine, 1% nonessential amino acids, 1 mM sodium pyruvate and 10% fetal bovine serum. HA cell line was purchased from ScienCell™ Research Laboratories and was cultured in the astrocyte medium (Gibco) with 10% fetal bovine serum and 1% penicillin/streptomycin and was maintained at 37°C in an air atmosphere. Radiation was performed using an RS-2000 biological irradiator (Rad Source Technologies, Inc., Suwanee, GA, USA) with 160 kV X-rays with a 0.3 mm copper filter at a dose rate of ~1.2 Gy/min.
Experiment design for comparative transcriptome study
To explore the radiation response of HA and U251 cells at the molecular level, transcriptome profiles of radiation-treated and nontreated HA and U251 cells were characterized by next-generation sequencing. As shown in Figure 1, the differentially expressed genes (DEGs) between radiation-treated and nontreated HA cells were named DEG1. Similarly, the DEGs between radiation-treated and nontreated U251 cells were named DEG2. The DEGs between normal HA and U251 cells were named DEG3. The DEGs between radiation-treated HA and U251 cells were named DEG4.
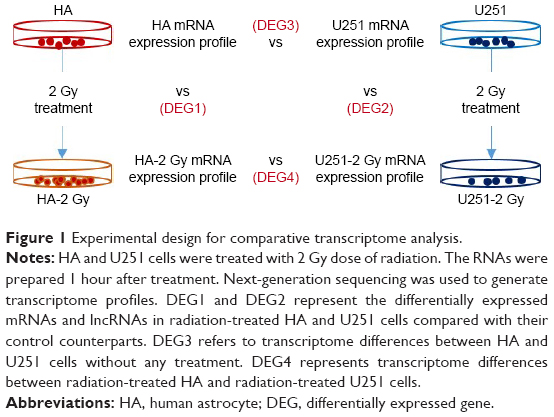 | Figure 1 Experimental design for comparative transcriptome analysis. |
Cell viability assay and growth curve generation
The cells were seeded into 96-well plates at a density of 3,000 cells/well. After attachment, the cells were treated with or without 10 Gy radiation. After another 24 or 48 hours of culture, cell number was measured by cell counting kit-8 (CCK-8; Sigma-Aldrich Co., St Louis, MO, USA) according to the manufacturer’s manual. For growth curve generation, cells in the wells of three parallel plates were subjected to CCK-8 analysis every 12 hours. Population doubling level (PDL), the number of times cells double their population during a given time period, was calculated using the following formula: PDL (log10F − log10I)/log, where F indicates cell numbers at the end of the passage and I equals cell numbers initially plated. Population doubling (PD) time was calculated by the formula: hours in culture/PDL.
Colony formation assay
The cells were plated into six-well plates or 35 mm dishes. After treatment with or without 10 Gy radiation, the cells were cultured for another 15 days. For visualization, the cells were stained by crystal violet. The colonies >50 cells were counted under a dissecting scope. For statistics, the number of colonies was normalized to the control group.
Total RNA extraction
Total RNA was extracted using RNeasy Mini Kit (Qiagen NV, Venlo, the Netherlands) according to the manual. In brief, up to 1×10⁷ cells were disrupted in lysis buffer and homogenized. Ethanol was added into the lysate. The sample was then applied to the RNeasy Mini Spin Column and eluted in RNase-free water. For RNA sequencing and cell-based experiment, the total RNA from the cells was prepared for analysis 1 hour after 2 Gy of radiation treatment.
cDNA library construction, sequencing and quality control
RNA fragments were randomly broken into short fragments. The first chain of cDNA was generated using RNA fragments as templates and 6 bp random primers. The second chain of the cDNA was synthesized following the kit’s manual (Takara, Dalian, China). Base A and sequencing joint were added into purified and end-repaired cDNA, followed by fragmentation with uracil N-glycosylase (UNG). After screening by size, polymerase chain reaction (PCR) amplification was performed to establish the complete sequencing cDNA library. Both mRNAs and lncRNAs were sequenced with HiSeq 2500 sequencer (Illumina, San Diego, CA, USA). Trim Galore software was used to dynamically remove joint sequence fragments and low-quality segments from the 3′-end. FastQC software was used for quality control.
Total number of reads, read length distribution and the nucleotide distribution across cycles were used as quality control for sequencing experiments.14,15 For a perfect sequencing run, the distribution of the four nucleotides (A, T, C and G) across all reads should remain relatively stable.16 As shown in Figure S1 and Tables S1 and S2, the total number of reads, high-quality reads and alignment results were reliable. In addition, as shown in Figure S2A–D, except for the 5′-end unbalanced composition preference caused by the random primer, the frequency of reads in every position (A, T, C and G) is close to 25%.
Sequence alignment and assembly of transcripts
TopHat software was used to align RNA-seq reads to the reference genome. Genome Homo_sapiens.GRCh37 was chosen as the reference genome and was downloaded from the website ftp://ftp.ensembl.org/pub/release-73/fasta/homo_sapiens/dna/. Homo_sapiens.GRCh37.74.gtf, the location information of known transcripts in the genome, was downloaded from the website ftp://ftp.ensembl.org/pub/release-73/gtf/homo_sapiens/Homo_sapiens.GRCh37.73.gtf.gz. The alignment parameters included: 2 bp mismatch was allowed, maximal 20 bp match records for every read, considering the variable shear, the length of segment as 25 bp, maximal mismatch number in every fragment as 2 bp, maximal insert and deletion length as 3 bp, alternative splicing position must be aligned completely, minimum intron length as 50 bp and maximum intro length as 50,000 bp. For each sample, Cufflinks software was used for assembly of transcripts based on location information of known transcripts in the genome.
Bioinformatics analysis and statistical analysis
Pathway analysis and gene ontology (GO) classification were performed using iPathwayGuide online bioinformatics tool (https://apps.advaitabio.com).17 GO clustering was performed by DAVID online software (https://david.ncifcrf.gov/).18 YAP gene expression data were downloaded from R2: Genomics Analysis and Visualization Platform (http://r2.amc.nl). The R2 program was used to generate a Kaplan–Meier survival curve (http://r2.amc.nl).
Real-time PCR
Total RNA was isolated from cells by TRIzol reagent (Thermo Fisher Scientific). Complementary DNA was synthesized by reverse transcription using PrimeScript RT reagent kit (Takara). Real-time PCR was performed with gene-specific primers in the presence of CYBR green reagents. Relative abundance of mRNA was calculated by normalization to GAPDH mRNA. Information on primers is shown in Table S3.
Plasmids, shRNAs and reagents
Two independent small hairpin (sh) RNAs (Table S4) against YAP were used for the experiments and were cloned into PLKO.1 vector. All other common reagents were purchased from Sigma-Aldrich Co.
Lentiviral generation and infection
Lentiviruses were generated using Lenti-X Packaging Single Shots (Clontech, Palo Alto, CA, USA) according to the manufacturer’s procedures. Media containing lentivirus were used to infect the cells. A stable cell line was selected by culturing in complete media containing puromycin for 10 days. Knockdown and overexpression efficiency were determined by Western blot.
Immunoblotting
Cells were lyzed using radioimmunoprecipitation assay (RIPA) reagents (Thermo Fisher Scientific). The lysates were centrifuged for 10 min at 4°C. The supernatants were used for immunoblotting. Immunoblotting was performed using standard protocol. Information for antibodies is shown in Table S5.
Statistical analysis
The data represent mean ± SD from three independent experiments except where indicated. Data analysis was performed using the Student’s t-test on raw data with Statistical Package of the Social Sciences (SPSS; SPSS Inc., Chicago, IL, USA) at a significance level of P<0.05.
Results
Establishment of in vitro model for normal astrocytes and glioma cells
Normal HA and U251 cell lines were used as models for normal astrocytes and glioma cells. We first measured their growth curves. As shown in Figure S3A, HA cells grow more slowly than U251 cells. The PD times of HA and U251 cells were 33.2 and 25.1 hours, respectively. Next, to confirm their differential radiation responses, we performed cell viability and colony formation assays. As shown in Figure S3B, the result from the cell viability assay showed that radiation treatment resulted in a significantly higher reduction in cell number of U251 cells than HA cells. Consistently, a similar result was obtained by long-term colony formation assay (Figure S3C), which suggested that HA cells are more tolerant to radiation treatment than U251 cells. These results demonstrated that HA and U251 cells could serve as in vitro models for normal astrocytes and glioma cells.
Comparative analysis of the transcriptome of radiation-treated and nontreated HA and U251 cells
To explore the differential radiation responses of HA and U251 cells at the molecular level, the transcriptome profiles of radiation-treated and nontreated HA and U251 cells were characterized by next-generation sequencing. In total, we identified 296 and 262 differentially expressed mRNAs (Figure 2A) and lncRNAs (Table S6), respectively, between radiation-treated and nontreated HA cells. In addition, we identified 201 and 139 differentially expressed mRNAs (Figure 2B) and lncRNAs (Table S7), respectively, between radiation-treated and nontreated U251 cells. In addition, there were 124 and 260 differentially expressed mRNAs (Figure S4A) and lncRNAs (Table S8), respectively, between nontreated HA and U251 cells. Whereas, there were 193 and 100 differentially expressed mRNAs (Figure S4B) and lncRNAs (Table S9), respectively, between radiation-treated HA and U251 cells. Furthermore, five genes (Figure 2C) and 13 lncRNAs (Figure S5) were oppositely regulated by radiation in HA and U251 cells, which may represent the major differential radiation responses between HA and U251 cells.
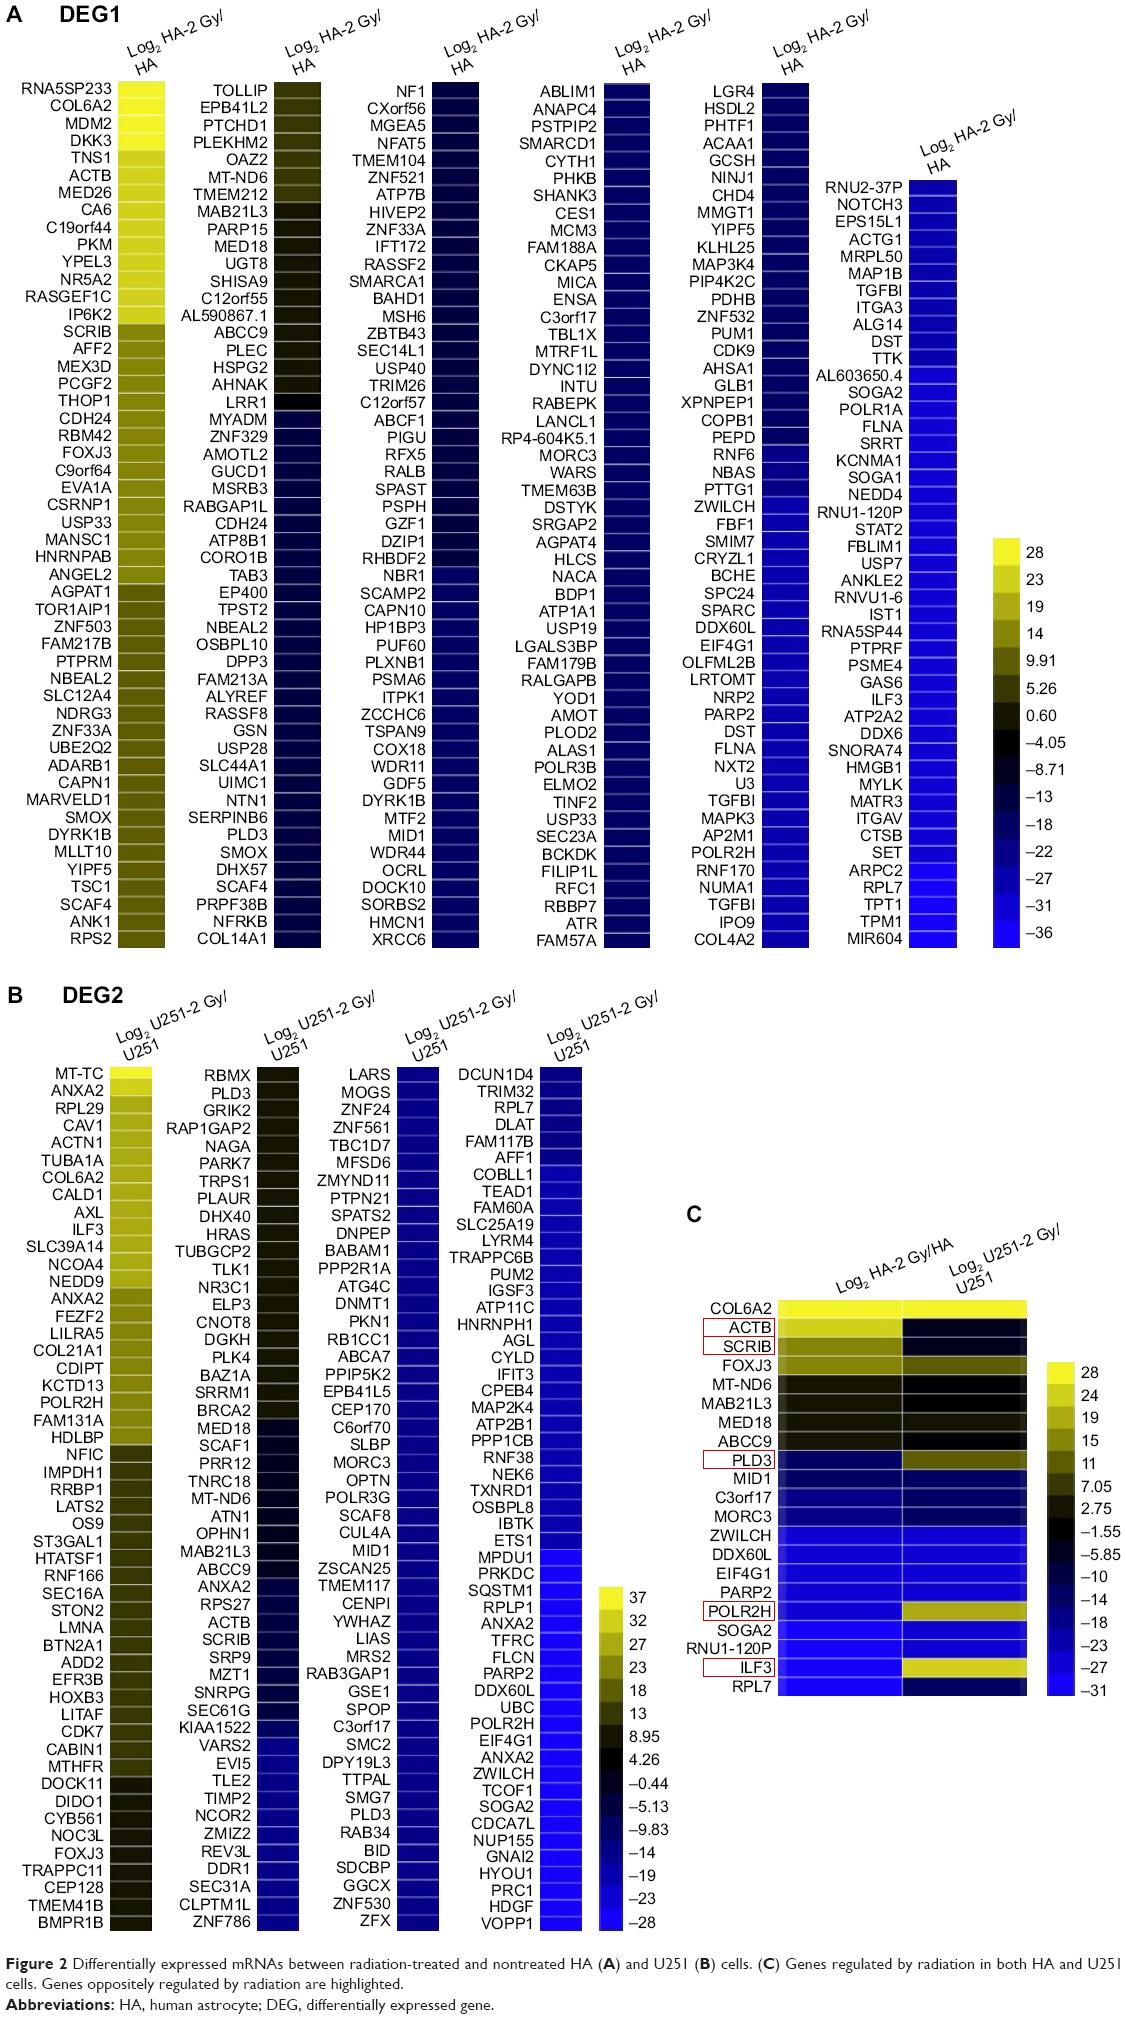 | Figure 2 Differentially expressed mRNAs between radiation-treated and nontreated HA (A) and U251 (B) cells. (C) Genes regulated by radiation in both HA and U251 cells. Genes oppositely regulated by radiation are highlighted. |
GO and pathway analyses of DEGs
To further investigate the functional roles of the DEGs, we performed GO and pathway analyses. As shown in Figure 3A and B, GO analysis showed that radiation causes alterations in similar functional modules in HA and U251 cells, including cellular component organization, ion binding, membrane and vesicle, which suggested that the major effects of radiation on HA and U251 cells were similar. As shown in Figure S6A and B, the DEGs between normal HA and U251 cells and between radiation-treated HA and U251 cells were also enriched in similar functional modules, including cellular component organization, ion binding, RNA binding, membrane and vesicle, which confirms the finding that radiation treatment leads to similar alterations in HA and U251 cells.
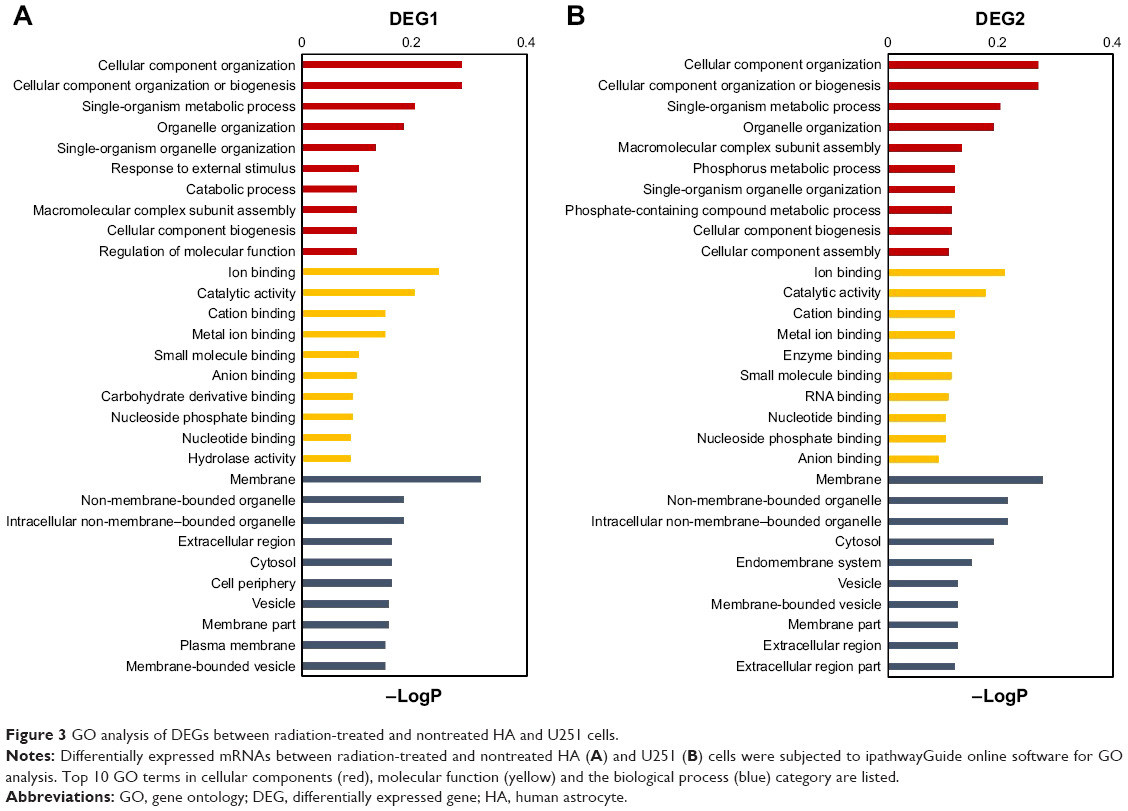 | Figure 3 GO analysis of DEGs between radiation-treated and nontreated HA and U251 cells. |
Next, pathway analysis of the DEGs was performed. In HA cells, radiation treatment altered genes involved in Hippo, gap junction, platelet activation, glioma, TGF-β and MAPK signaling pathways (Figure 4A). In U251 cells, genes regulated by radiation treatment are mostly distributed in Hippo, cell cycle, central carbon metabolism in cancer and VEGF signaling pathways (Figure 4B). In addition, genes differentially expressed between HA and U251 cells (including both normal and radiation treated) are mostly involved in P53, TGF-β, VEGF, Jak-STAT, Hippo, regulation of actin cytoskeleton and tight junction signaling pathways (Figure S7A and B).
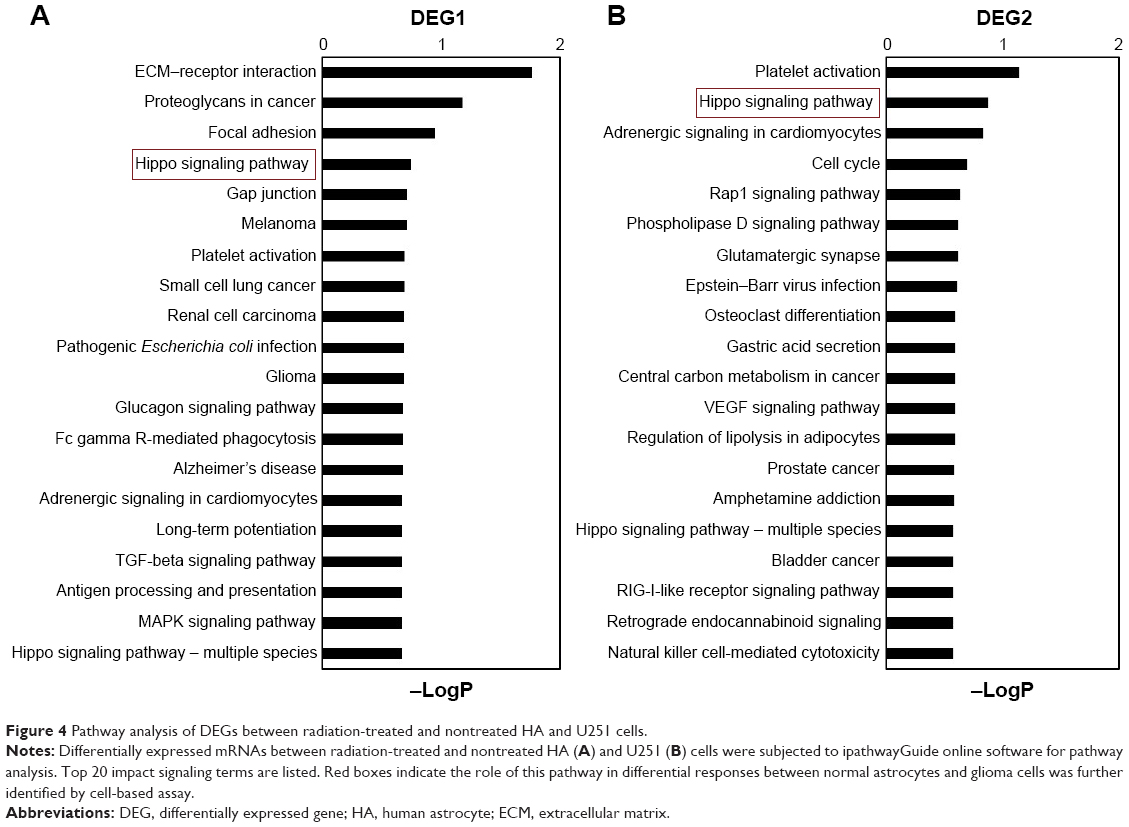 | Figure 4 Pathway analysis of DEGs between radiation-treated and nontreated HA and U251 cells. |
Interestingly, we found that the activation status of Hippo signaling pathway is different between HA and U251 cells. Several key genes in the Hippo pathway, such as SCRIB, are oppositely regulated by radiation treatment (Figure 2C) in HA and U251 cells. Hippo signaling pathway controls cell proliferation in developmental tissues, which is normally suppressed in developed tissues and reactivated in cancer cells.19 This result is consistent with the traditional standpoint that rapidly proliferating cancer cells are more sensitive to radiation treatment. Thus, we postulated that inactivation of Hippo/YAP signaling pathway is critical for maintaining radiation resistance in normal astrocytes and radiation-resistant glioma cells.
Suppression of Hippo/YAP signaling pathway induces radiation resistance
To investigate the role of Hippo/YAP signaling pathway in differential responses between normal astrocytes and glioma cells, we first measured the activation status of Hippo signaling pathway in normal astrocyte and glioma cell lines. As YAP is the main signaling output of Hippo pathway, we first determined the level of phosphorylated YAP (inactive YAP) in glioma cell lines (U251 and SNB19) and HA normal astrocyte cell line. As shown in Figure 5A, results from Western blot indicated that the levels of phosphorylated YAP were lower in U251 and SNB19 cells than in HA cells. In addition, we found that the levels of nuclear YAP were higher in U251 and SNB19 cells than in HA cells (Figure 5B). Moreover, quantitative real-time polymerase chain reaction (qRT-PCR) analysis showed that the mRNA levels of YAP target genes (CTGF, AREG) were higher in U251 and SNB19 cells than in HA cells (Figure 5C). Furthermore, by Kaplan–Meier analysis of YAP expression dataset downloaded from R2: Genomics Analysis and Visualization Platform, we found that a high expression of YAP predicts poor outcome of patients with glioma (Figure S8A). These results demonstrated that the Hippo/YAP signaling is more active in glioma cells than in normal astrocytes.
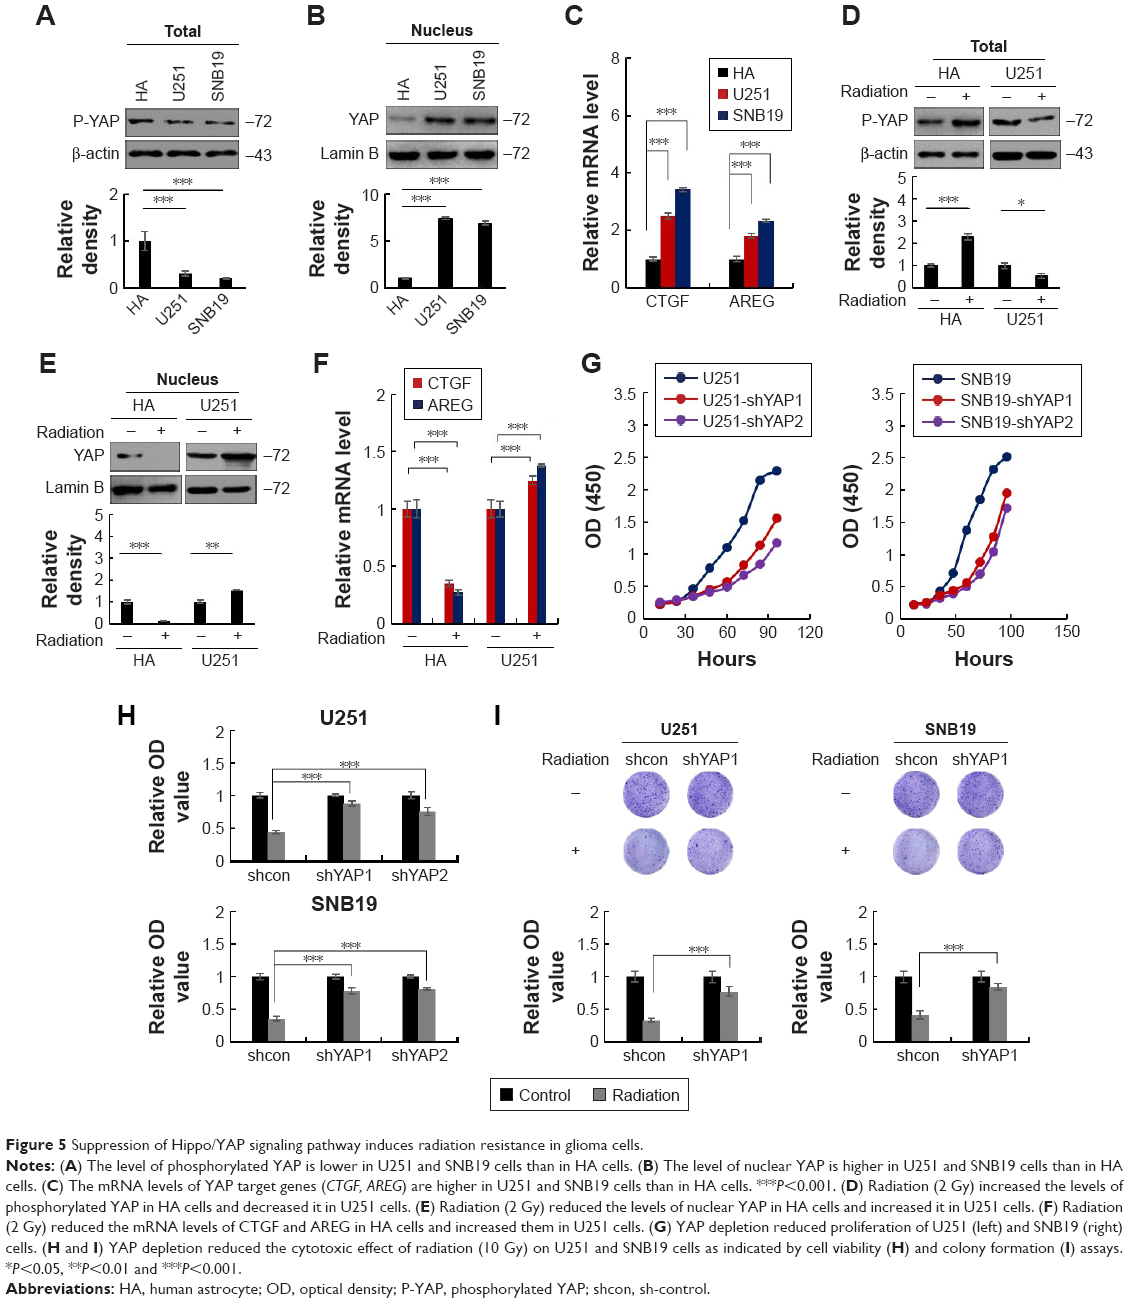 | Figure 5 Suppression of Hippo/YAP signaling pathway induces radiation resistance in glioma cells. |
Next, we investigated the effect of radiation on Hippo/YAP signaling pathway in HA and U251 cells. As shown in Figure 5D, radiation treatment increased the level of phosphorylated YAP in HA cells but decreased it in U251 cells. In addition, the levels of nuclear YAP were decreased in radiation-treated HA cells but were increased in radiation-treated U251 cells (Figure 5E). Moreover, analysis from qRT-PCR indicated that radiation treatment decreased the mRNA levels of YAP target genes in HA cells but increased them in U251 cells (Figure 5F). These results confirmed the previous finding that Hippo/YAP signaling pathway is oppositely regulated by radiation in HA and U251 cells.
To further confirm the role of Hippo/YAP signaling pathway in radiation resistance of glioma cells, we generated YAP-knockdown U251 and SNB19 stable cell lines by lentivirus-mediated shRNA expression system (Figure S8B). As shown in Figure 5G, the growth curves showed that YAP depletion decreased the proliferation of U251 and SNB19 cells, which suggested that Hippo/YAP signaling pathway is at least partially necessary for the proliferation of glioma cells. Then, the effect of YAP depletion on radiation sensitivity of U251 and SNB19 cells was measured. As shown in Figure 5H and I, results from both cell viability assay and colony formation assay showed that silence of YAP reduced the cytotoxic effects of radiation on glioma cells. Similar results were observed in U251 and SNB19 cells treated with YAP inhibitor (verteporfin; Figure S8C). Collectively, these results demonstrated that suppression of Hippo/YAP signaling induces radiation resistance in glioma cells.
Discussion
In this study, we characterized and compared the transcriptome profiles of radiation-treated and nontreated HA normal astrocytes and U251 glioma cells. The signaling pathways related to differential responses between normal astrocytes and U251 glioma cells were revealed. In addition, the role of Hippo/YAP signaling pathway in intrinsic and acquired radiation resistance was investigated. Our work provided novel insights about the underlying mechanism of differential responses between normal astrocytes and glioma cells and acquired radiation resistance of glioma cells.
Radiation treatment is the major therapeutic method in glioma treatment.3 The rationale of using radiation to treat glioma is based on the fact that the proliferating glioma cancer cells are more sensitive to the radiation treatment than normal brain cells.7 Thus, understanding the underlying mechanism of differential responses between normal astrocytes and glioma cells would be useful to improve the therapeutic efficiency. Meanwhile, acquisition of radiation resistance occurs frequently in glioma cells, and in some cases, induced radiation-resistant glioma cells and normal astrocytes share similar mechanism of radiation-resistance.7 Hence, it is important to understand the differential radiation responses between normal astrocytes and glioma cells to improve glioma treatment.
In this study, we chose HA and U251 cells as normal astrocyte and glioma cell models, respectively. HAs are normal human cells derived from human cerebral cortex with typical star-like morphology.20 Because of its high degree of biological relevance, HA cell line serves as an ideal model for studies of human neurological pathways. On the other hand, U251 cell line was derived from a malignant glioblastoma tumor and had been previously used in the studies of cell signaling, drug or radiation response and cancer stem cells in glioma.21 By using the cell viability assay, we found that HA cells were more resistant to radiation treatment (Figure S1), which confirmed that HA and U251 cells could serve as normal astrocyte and glioma cell models to investigate the differential responses between normal brain and glioma cells.
mRNA and lncRNA profiles of radiation-treated and nontreated HA and U251 cells were generated by next-generation sequencing. By comparative analysis of these profiles, we identified several classic pathways involved in radiation response of astrocytes and glioma cells. For example, genes involved in response to external stimulus were found to be differentially expressed in both cell lines after radiation treatment, which confirmed the effect of the radiation treatment in these cells. In addition, genes associated with ion binding were changed by radiation treatment in HA and U251 cells. This result is consistent with the previous observation that radiation produces free radicals and changes the expression of ion-binding proteins in the cells.7 Moreover, several key pathways involved in cancer development and therapeutic resistance have been found in the results from pathway analysis of DEGs, such as focal adhesion, Hippo signaling, and gap junction pathways, which indicated their roles in radiation response of astrocytes and glioma cells.
Hippo/YAP signaling pathway is an evolutionally conserved cascade, which controls organ size by regulation of proliferation, cell cycle and apoptosis of the cells.22 The key components of Hippo signaling consist of MTS1/2 and LATS1/2. In developed organs, Hippo signaling phosphorylates and limits YAP, the major output of Hippo/YAP signaling, in the cytoplasm. However, in developing organs or cancer cells, the Hippo signaling pathway is suppressed and the dephosphorylated YAP translocates into the nucleus and serves as a transcriptional coactivator to promote gene expression by forming a complex with TEAD transcription factors. The association between Hippo/YAP signaling and radiation resistance has been reported in several studies. YAP is a double-edged sword in response to DNA damage.22 YAP could induce apoptosis and reduce proliferation of the cells by stabilization of p73 in HCT116 and H1299 cells after cisplatin-induced DNA damage.23 However, in some cells, YAP protects cells from DNA damage-induced apoptosis and promotes proliferation with unrepaired DNA through IGF-2 and AKT signaling pathways.24 In our study, we found the YAP activity was reduced in radiation-resistant normal astrocytes and was slightly enhanced in radiation-sensitive glioma cells (Figure 5D–F). Subsequent experiments with YAP-knockdown U251 and SNB19 cells demonstrated that YAP plays an important role in the proliferation of glioma cells (Figure 5G) and knockdown of YAP induces radiation resistance in glioma cells (Figure 5H and I). This information indicated that suppression of YAP is one of the mechanisms underlying acquired radiation resistance of glioma cells. Furthermore, we found that YAP inhibitor induced radiation resistance in U251 and SNB19 cells (Figure S8C), which indicated that YAP inhibitor could not be used in combination with radiation for glioma treatment. However, the role of YAP suppression in radiation resistance of glioma cells still needs further study.
In addition, we found that several lncRNAs were oppositely regulated in HA and U251 cells. Several studies reported the association between lncRNAs and radiation resistance of cancer. For example, Fan et al25 reported the role of lncRNAs in glucose metabolism in cancer, which partially contributes to radiation resistance. Jiang et al26 reported that downregulation of lncRNA TUG1 enhances radiosensitivity in bladder cancer via suppressing HMGB1 expression. However, the functional roles of lncRNAs in radiation resistance of glioma cells are still being revealed.
Conclusion
In summary, we characterized and compared the transcriptome profiles of radiation-treated and nontreated normal astrocytes and glioma cells. Key pathways involved in intrinsic and acquired radiation resistance were identified. We also demonstrated that suppression of YAP activity is at least one of the mechanisms underlying radiation resistance in glioma. Our work is useful for improvement of our understanding about the differential responses between normal astrocytes and glioma cells and would be useful for advancement of glioma therapy.
Acknowledgment
This work was partly supported by grants from the National Natural Science Foundation of China (numbers 81571883 and 83452705).
Disclosure
The authors report no conflicts of interest in this work.
References
Weller M, Wick W, Aldape K, et al. Glioma. Nat Rev Dis Primers. 2015;1:15017. | ||
Schwartzbaum JA, Fisher JL, Aldape KD, Wrensch M. Epidemiology and molecular pathology of glioma. Nat Clin Pract Neurol. 2016;2(9):494–503. | ||
Wen PY, Reardon DA. Neuro-oncology in 2015: progress in glioma diagnosis, classification and treatment. Nat Rev Neurol. 2016;12(2): 69–70. | ||
Khan MN, Sharma AM, Pitz M, et al. High-grade glioma management and response assessment-recent advances and current challenges. Curr Oncol. 2016;23(4):e383–e391. | ||
Jones TS, Holland EC. Standard of care therapy for malignant glioma and its effect on tumor and stromal cells. Oncogene. 2012;31(16):1995–2006. | ||
Marvaso G, Barone A, Amodio N, Cascini GL, Scotti V, Bianco C. The current status of novel PET radio-pharmaceuticals in radiotherapy treatment planning of glioma. Curr Pharm Biotechnol. 2014;14(13):1099–1104. | ||
Baskar R, Dai J, Wenlong N, Yeo R, Yeoh KW. Biological response of cancer cells to radiation treatment. Front Mol Biosci. 2014;1:24. | ||
Liebelt BD, Shingu T, Zhou X, Ren J, Shin SA, Hu J. Glioma stem cells: signaling, microenvironment, and therapy. Stem Cells Int. 2016;2016:7849890. | ||
Rizzo AE, Yu JS. Radiation therapy for glioma stem cells. Adv Exp Med Biol. 2015;853:85–110. | ||
Kaur B, Khwaja FW, Severson EA, et al. Hypoxia and the hypoxia-inducible-factor pathway in glioma growth and angiogenesis. Neuro Oncol. 2005;7(2):134–153. | ||
Hatanpaa KJ, Burma S, Zhao D, Habib AA. Epidermal growth factor receptor in glioma: signal transduction, neuropathology, imaging, and radioresistance. Neoplasia. 2010;12(9):675–684. | ||
Hardee ME, Zagzag D. Mechanisms of glioma-associated neovascularization. Am J Pathol. 2012;181(4):1126–1141. | ||
Cuddapah VA, Robel S, Watkins S, Sontheimer H. A neurocentric perspective on glioma invasion. Nat Rev Neurosci. 2014;15(7):455–465. | ||
Wilson ML, Cai Y, Hanlon R, et al. Sequence verification of synthetic DNA by assembly of sequencing reads. Nucleic Acids Res. 2013;41(1):e25. | ||
Schmutz J, Wheeler J, Grimwood J, et al. Quality assessment of the human genome sequence. Nature. 2004;429(6990):365–368. | ||
Macmanes MD. On the optimal trimming of high-throughput mRNA sequence data. Front Genet. 2014;5:13. | ||
Draghici S, Khatri P, Tarca AL, et al. A systems biology approach for pathway level analysis. Genome Res. 2007;17(10):1537–1545. | ||
Huang DW, Sherman BT, Lempicki RA. Systematic and integrative analysis of large gene lists using DAVID bioinformatics resources. Nat Protoc. 2009;4(1):44–57. | ||
Yu FX, Meng Z, Plouffe SW, Guan KL. Hippo pathway regulation of gastrointestinal tissues. Annu Rev Physiol. 2015;77:201–227. | ||
Zhang Y, Zhu T, Zhang X, et al. Role of high-mobility group box 1 in methamphetamine-induced activation and migration of astrocytes. J Neuroinflammation. 2015;12:156. | ||
Binello E, Germano IM. Targeting glioma stem cells: a novel framework for brain tumors. Cancer Sci. 2011;102(11):1958–1966. | ||
Mao B, Gao Y, Bai Y, Yuan Z. Hippo signaling in stress response and homeostasis maintenance. Acta Biochim Biophys Sin (Shang hai). 2015;47(1):2–9. | ||
Levy D, Adamovich Y, Reuven N, Shaul Y. The yes-associated protein 1 stabilizes p73 by preventing itch-mediated ubiquitination of p73. Cell Death Differ. 2007;14(4):743–751. | ||
Mao B, Hu F, Cheng J, et al. SIRT1 regulates YAP2-mediated cell proliferation and chemoresistance in hepatocellular carcinoma. Oncogene. 2014;33(11):1468–1474. | ||
Fan C, Tang Y, Wang J, et al. Role of long non-coding RNAs in glucose metabolism in cancer. Mol Cancer. 2017;6(1):130. | ||
Jiang H, Hu X, Zhang H, Li W. Down-regulation of LncRNA TUG1 enhances radiosensitivity in bladder cancer via suppressing HMGB1 expression. Radiat Oncol. 2017;12(1):65. |
 © 2017 The Author(s). This work is published and licensed by Dove Medical Press Limited. The full terms of this license are available at https://www.dovepress.com/terms.php and incorporate the Creative Commons Attribution - Non Commercial (unported, v3.0) License.
By accessing the work you hereby accept the Terms. Non-commercial uses of the work are permitted without any further permission from Dove Medical Press Limited, provided the work is properly attributed. For permission for commercial use of this work, please see paragraphs 4.2 and 5 of our Terms.
© 2017 The Author(s). This work is published and licensed by Dove Medical Press Limited. The full terms of this license are available at https://www.dovepress.com/terms.php and incorporate the Creative Commons Attribution - Non Commercial (unported, v3.0) License.
By accessing the work you hereby accept the Terms. Non-commercial uses of the work are permitted without any further permission from Dove Medical Press Limited, provided the work is properly attributed. For permission for commercial use of this work, please see paragraphs 4.2 and 5 of our Terms.