")
Back to Journals » International Journal of General Medicine » Volume 14
Differential Expression of COL1A1, COL1A2, COL6A3, and SULF1 as Prognostic Biomarkers in Gastric Cancer
Authors Hu Y, Li J, Luo H, Song W, Yang J
Received 21 May 2021
Accepted for publication 27 August 2021
Published 17 September 2021 Volume 2021:14 Pages 5835—5843
DOI https://doi.org/10.2147/IJGM.S321265
Checked for plagiarism Yes
Review by Single anonymous peer review
Peer reviewer comments 3
Editor who approved publication: Dr Scott Fraser
Yan Hu, Jingjing Li, Haifeng Luo, Wenli Song, Jiyuan Yang
Department of Oncology, The First People’s Hospital of Jingzhou, Jingzhou, Hubei, 434000, People’s Republic of China
Correspondence: Yan Hu
Department of Oncology, The First People’s Hospital of Jingzhou, Jingzhou, Hubei, 434000, People’s Republic of China
Tel +86 716 8513623
Email [email protected]
Background: Gastric cancer (GC) is among the most prevalent cancers globally. As such, there is a need to explore the mechanism underlying its pathogenesis and identify potential biomarkers for its prognosis.
Methods: ONCOMINE was used to screen differentially expressed genes between GC and normal gastric mucosa. GEPIA was used to analyze the expression and correlation of candidate genes in tumor node metastasis (TNM) stage. STRING was used to construct protein interaction network. Kaplan–Meier plotter was used to analyze survival. TIMER was used to evaluate the association between candidate genes and immune cell infiltration.
Results: From the ONCOMINE database, we found COL1A1, COL1A2, COL6A3, and SULF1 genes were significantly upregulated in stomach adenocarcinomas. There was a considerable correlation between the expression of COL1A1 (p = 0.029), COL1A2 (p = 0.004), COL6A3 (p = 0.002), SULF1 (p = 0.001), and the TNM stage. COL1A1 was positively correlated with ERBB2 (R = − 0.037, p = 0.46), while the other three genes were negatively correlated with ERBB2 (p > 0.05). The Kaplan–Meier plotter showed that low transcriptional levels of COL1A1 (p = 0.0020), COL1A2 (p = 0.0015), COL6A3 (p = 0.0015), and SULF1 (p = 0.0016) in gastric cancer patients were remarkably related to longer overall survival. In addition, there was a close relationship between chemokine expression and infiltration of the six immune cell types: B cells, macrophages, CD4+ T cells, CD8+ T cells, dendritic cells, and neutrophils, implying that the genes acted as indicators of both prognosis and immune status.
Conclusion: Our findings implicate COL1A1, COL1A2, COL6A3, and SULF1 as candidate biomarkers for the prognosis of gastric cancer.
Keywords: gastric cancer, biomarker, prognosis
Introduction
Gastric cancer (GC) is among the most prevalent cancers worldwide. The highest gastric cancer incidence rates occur in East Asia, South and Central America, and Eastern Europe.1 Rates of GC are exceptionally high in Japan and Korea, where it is the most common cancer in men, and in China, where it is the most common cause of cancer-associated death.2 Globally, there were about 1.03 million cases of GC, which led to the deaths of over 780,000 people in 2018, indicating that the disease is the fifth most prevalent and the third most common cause of cancer-associated deaths worldwide.3,4 According to their anatomic location and histologic type, over 95% of GC are categorized as adenocarcinomas.5
The main reason for the short overall survival (OS) and poor prognosis of gastric cancer patients is that the patients can not be diagnosed early. Advanced gastric cancer patients still account for a large proportion. Nowadays, various progressive treatment methods can not bring good curative effect for patients with advanced gastric cancer. Early diagnosis is still the primary and extremely important means to reduce the mortality of gastric cancer patients. So far, the diagnosis of gastric cancer in the world mainly depends on the pathological biopsy of gastroscope, but it is very difficult to carry out large-scale pathological biopsy. In addition, patients with gastric cancer have no specific clinical symptoms, especially early gastric cancer, which is easy to miss diagnosis.6 The lack of sensitive and specific predictive factors for gastric cancer diagnosis is the fundamental reason why gastric cancer patients can not be diagnosed early. Therefore, it is very important to find high specificity and sensitivity biomarkers for early diagnosis and prognosis of gastric cancer.7
Bioinformatics analysis, which can screen out the key genes related to diseases, has been widely used in clinical disease research.8,9 How to further analyze the existing data resources with bioinformatics has become a research hotspot in cancer and bioinformatics. Herein, we employed many open databases to analyze the expression of COL1A1, COL1A2, COL6A3, and SULF1 in gastric cancer and assess their potential application as prognostic markers and therapeutic targets. Our results provide theoretical basis for further study of the molecular mechanism of gastric cancer and its diagnosis and prognosis.
Materials and Methods
ONCOMINE
We obtained the microarrays data from the ONCOMINE database (www.oncomine.org) and identified five datasets involving COL1A1, COL1A2, COL6A3, and SULF1 after using the following filters: (a) analysis type: differential analysis–cancer versus normal analysis; (b) cancer type: gastric cancer–diffuse gastric adenocarcinoma. The rank for a gene is the median rank for the genes across each of the analyses. The p-value given for a gene is for the median-ranked analysis. The parameter was set to the default value.
GEPIA
GEPIA (http://gepia2.cancer-pku.cn/index.html) is an analysis tool that uses RNA sequence data. A differential mRNA expression analysis involving the tumor node metastasis (TNM) stage and ERBB2 correlative analysis of COL1A1, COL1A2, COL6A3, and SULF1 was performed. The p-value, which was set at 0.05, was generated by Student’s t-test for TNM stage analysis.
STRING
STRING (http://string-db.org) is used to acquire, score, and integrate protein-protein interaction (PPI) data from open data sources. In addition, it can be used to predict the potential functions of the identified genes. Here, STRING was employed to perform PPI network analysis on differentially expressed COL1A1, COL1A2, COL6A3, and SULF1 genes to examine their interactions. The interaction score was set to be ≥ 0.5 and the node degree was set to be ≥ 10. The protein interaction data were obtained and exported, and the data were analyzed and visualized by Cytoscape tool.
Kaplan–Meier Plotter
The effect of the key genes screened in this study on the overall survival (OS) of patients with gastric cancer was analyzed by Kaplan–Meier plotter (http://kmplot.com/analysis/). The patient samples were divided into high expression and low expression groups by medium expression, and evaluated by Kaplan Meier survival map, At the same time, the 95% confidence interval of hazard ratio (HR) and the significant difference value (log rank P) based on time series test (log rank test) were displayed.
TIMER
TIMER (http://cistrome.shinyapps.io/timer) can be used to systematically evaluate the infiltration of various immune cells, including their clinical significance. The association between COL1A1, COL1A2, COL6A3, SULF1 gene levels, and immune cell infiltration was assessed using the “Gene module.” Meanwhile, the relationship between clinical outcomes and immune cell infiltration, as well as COL1A1, COL1A2, COL6A3, and SULF1 gene expression, was evaluated by the “Survival module.” The inspection level was based on α=0.05.
Results
To retrieve significantly upregulated genes in GC, we subsequently selected five datasets comparing all genes performed by the ONCOMINE online tool. Five independent microarray datasets were chosen to identify genes linked to gastric cancer pathogenesis (Figure 1). Among these five datasets, datasets 1 and 2 were from Chen et al,10 and datasets 3, 4 and 5 were from Cho et al.,11 Cui et al12 and Wang et al,13 respectively. All datasets were from public databases and did not involve interest disputes, and relevant research were approved by ethical review.Among the 20 genes that were overexpressed in gastric cancer according to the five independent microarray datasets, four genes (COL1A1, COL1A2, COL6A3, and SULF1) were stably and consistently upregulated.
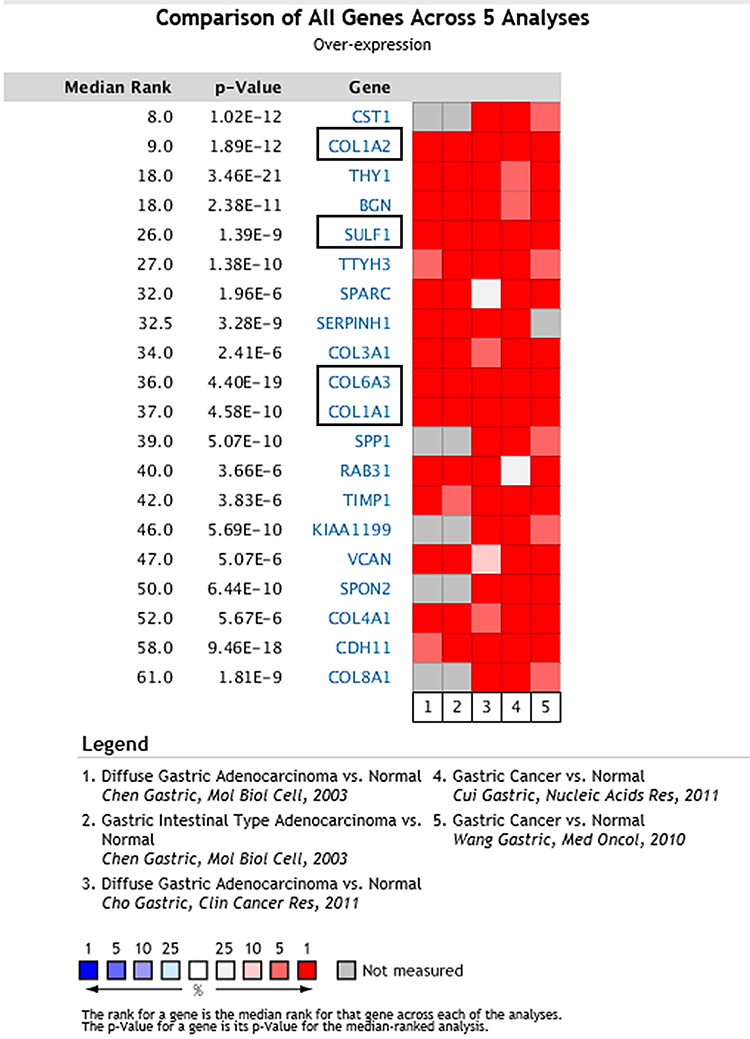 |
Figure 1 The top 20 genes upregulated in microarrays. COL1A1, COL1A2, COL6A3, and SULF1 mRNA were statistically significantly overexpressed in Chen Gastric,10 Cho Gastric,11 Cui Gastric,12 and Wang Gastric13 datasets from the ONCOMINE database. Genes with red had significant and consistent overexpression in the five studies. |
The relationship between the expression of differentially expressed COL1A1, COL1A2, COL6A3, and SULF1 genes and the TNM stage of gastric cancer patients is a significant correlation between the expression of COL1A1 (p = 0.029), COL1A2 (p = 0.004), COL6A3 (p = 0.002), SULF1 (p = 0.001), and the TNM stage (Figure 2). The upregulation of COL1A1, COL1A2, COL6A3, and SULF1 was consistent with tumor progression. These data suggest that the COL1A1, COL1A2, COL6A3, and SULF1 genes could play a crucial function in GC progression.
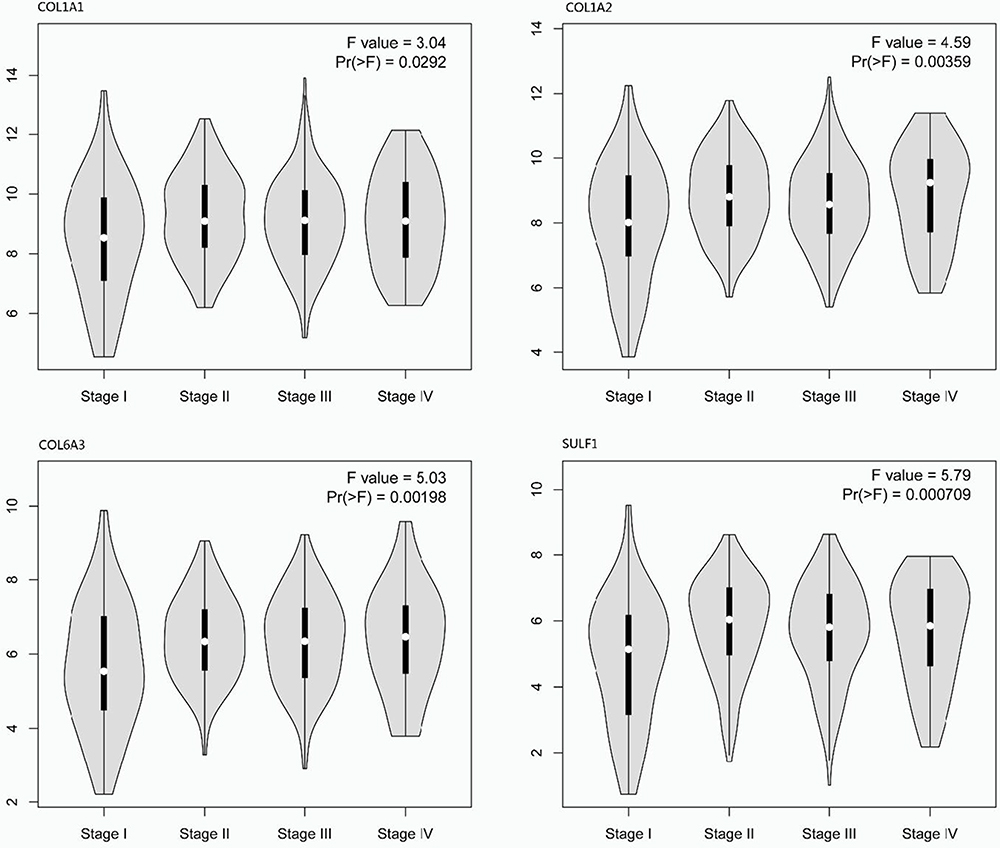 |
Figure 2 Correlation between different expressed COL1A1, COL1A2, COL6A3, and SULF1 chemokines, and the tumor node metastasis (TNM) stage of gastric cancer patients (GEPIA2) p < 0.05. |
HER-2 positive is vital in GC. In addition, Pearson correlation analyses between EBRR2 and COL1A1, COL1A2, COL6A3, and SULF1 were presented (Figure 3). Results revealed that COL1A1 was positively correlated with ERBB2 (R = −0.037, p = 0.46), while the other three genes were negatively correlated with ERBB2 (p > 0.05).
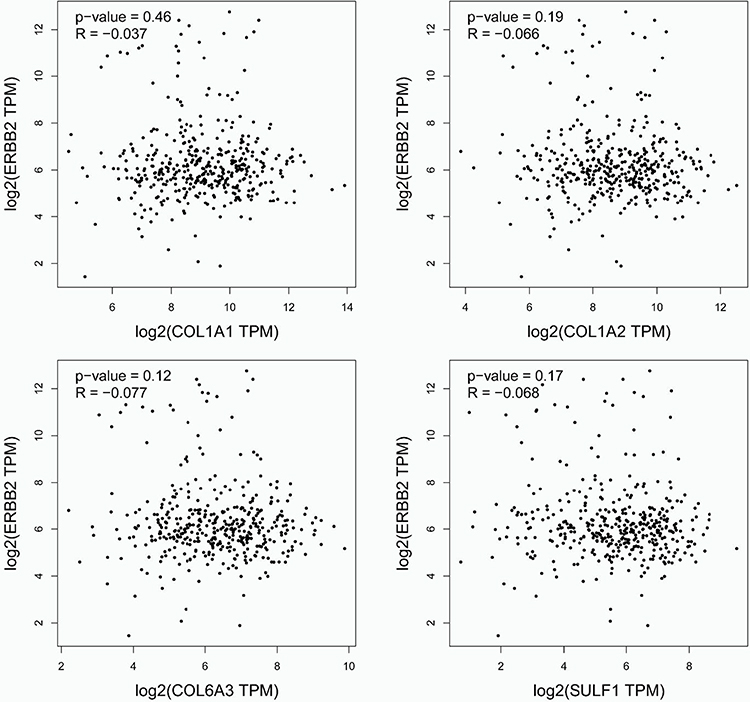 |
Figure 3 Pearson correlation analyses between ERBB2 and COL1A1, COL1A2, COL6A3, and SULF1 genes. |
From the PPI network analysis, we explored the potential interactions among them (Figure 4). COL1A1, COL1A2, and COL6A3 were in the same family of proteins, while SULF1 was bridging through the COL3A1 protein.
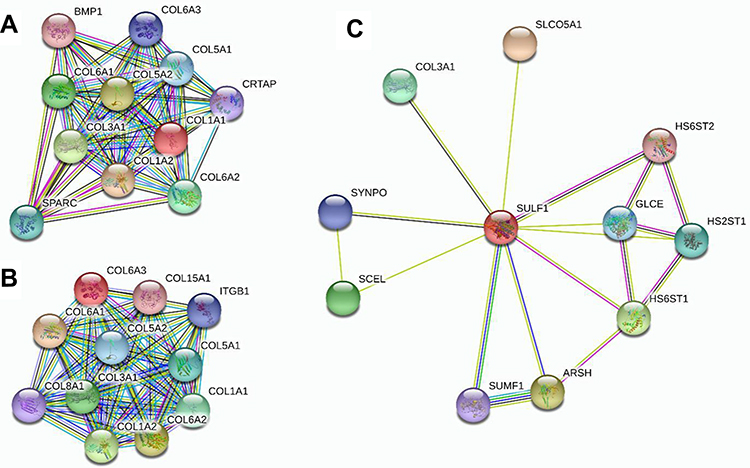 |
Figure 4 Protein-protein interaction network of different expressions of COL1A1, COL1A2, COL6A3, and SULF1 genes. (A) related to COL1A1; (B) related to COL6A3; (C) related to SULF1 genes. |
Kaplan–Meier plotter was utilized to assess the association between differentially expressed and clinical outcomes to assess the significance of differentially expressed COL1A1, COL1A2, COL6A3, and SULF1 in GC progression. Overall survival curves are presented in Figure 5. Low transcriptional levels of COL1A1 (p = 0.0020), COL1A2 (p = 0.0015), COL6A3 (p = 0.0015), and SULF1 (p = 0.0016) in gastric cancer patients were strongly linked to longer overall survival.
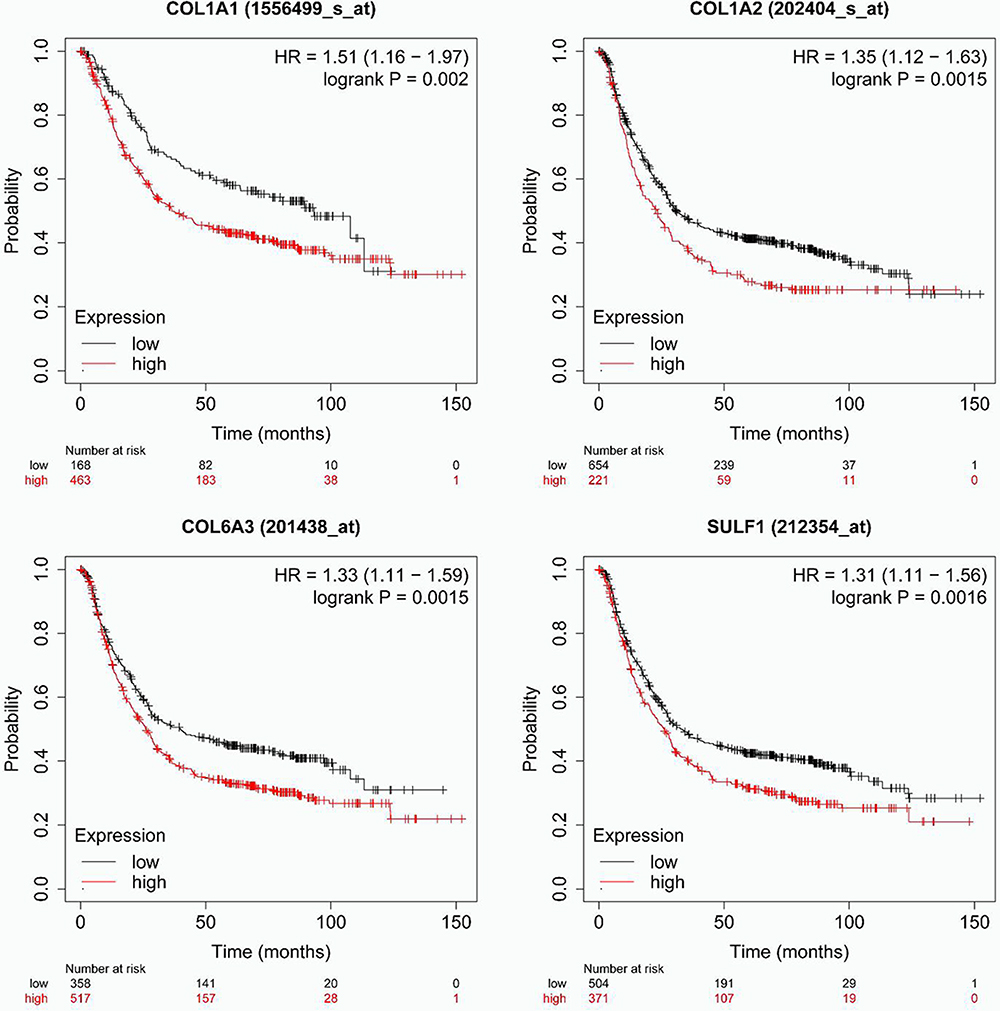 |
Figure 5 The prognostic value of different expressed COL1A1, COL1A2, COL6A3, and SULF1 chemokines in gastric cancer patients in the overall survival curve (Kaplan–Meier plotter). |
The four genes participate in inflammatory responses and infiltration of immune cells, thereby influencing clinical outcome of gastric cancer (Figure 6). We examined the relationship between differentially expressed COL1A1, COL1A2, COL6A3, SULF1, and immune cell infiltration using the TIMER database. An inverse association between COL1A1 expression, B cell infiltration (Cor = −0.214, p = 3.50e-05) and CD8+ T cells (Cor = 0.072, p = 1.65e-01) was observed. On the contrary, COL1A1 expression was positively related to CD4+ T cell infiltration (Cor = 0.14, p = 7.30e-03), macrophages (Cor = 0.357, p = 1.41e-12), neutrophils (Cor = 0.218, p = 2.32e-05), and dendritic cells (Cor = 0.297, p = 5.21e-09). Similarly, the expression of COL1A2 was inversely related to B cell infiltration (Cor = −0.185, p = 3.42e-04) and CD8+ T cells (Cor = 0.113, p = 2.98e-02) and positively associated with the infiltration of CD4+ T cells (Cor = 0.163, p = 1.81e-03), macrophages (Cor = 0.47, p = 1.01e-21), neutrophils (Cor = 0.268, p = 1.57e-07), and dendritic cells (Cor = 0.353, p = 2.46e-12). There was a negative correlation between COL6A3 (Cor = 0.094, p = 7.10e-02) and SULF1 (Cor = −0.208, p = 5.7e-05) expression and the infiltration of B cells, and a direct correlation between COL6A3 and SULF1 expression and the infiltration of CD8+ T cells, CD4+ T cells, macrophages, dendritic cells, and neutrophils (p < 0.05).
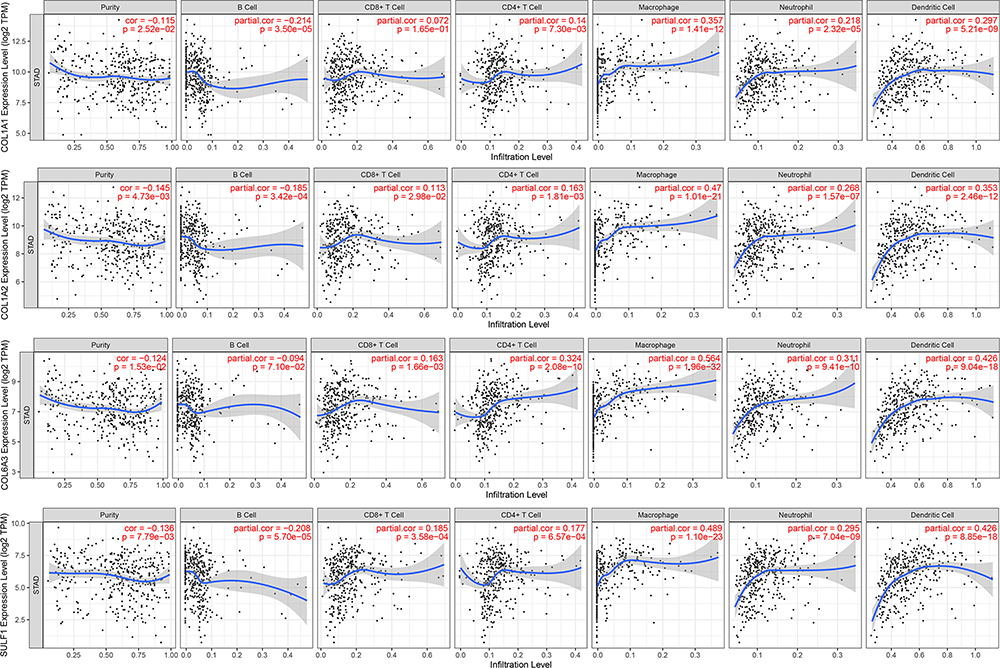 |
Figure 6 The correlation between different expressions of COL1A1, COL1A2, COL6A3, and SULF1 chemokines and immune cell infiltration (TIMER). |
Discussion
Given that there was a significant differential expression of several genes in gastric cancer, selecting the genes with high significance was crucial. According to Jun,14 COL1A1 mRNA levels were overtly abnormal in cancer and precancer tissues relative to normal tissues. On the other hand, the levels of COL1A2 mRNA were substantially higher in cancer tissues relative to precancer normal tissues. Also, COL1A2 expression had a direct association with tumor size and invasion depth. Thus, the upregulation of COL1A1 and COL1A2 were linked to lower OS. A study revealed that collagen type VI α3 chain (COL6A3) expression is fibroblast-specific and has been implicated in stromal cancer.15 Keun16 reported that in GC, the upregulation of SULF1 was strongly linked to higher recurrence rates (p = 0.0002) and, therefore, worse OS (p < 0.0001). Based on multivariate analysis, SULF1 was identified as an independent prognostic factor (p = 0.0123) and a predictive factor for lymph node metastasis (p = 0.0003) in GC patients.
Thus far, the TNM staging classification is primarily used for the prognosis of GC patients.17 In this study, we found that the expression of COL1A1, COL1A2, COL6A3, and SULF1 genes was significantly correlated with TNM stage of gastric cancer patients. The results suggested that COL1A1, COL1A2, COL6A3, and SULF1 genes may play a crucial function in GC progression. Kaplan–Meier plotter showed gastric cancer patients with low transcriptional levels of COL1A1, COL1A2, COL6A3, and SULF1 were strongly linked to longer OS. Therefore, we believed that COL1A1, COL1A2, COL6A3, and SULF1 genes have the potential to be biomarkers for predicting the overall survival of gastric cancer.
HER-2 is an essential biomarker in gastric cancer. The proportion of GC patients who are HER2 positive ranges from 12 to 23%. Some studies suggest that HER2 positive is an independent prognosis.18 We used person analysis to seek the correlation between COL1A1, COL1A2, COL6A3, SULF1 genes and HER2. Results showed that COL1A1 was positively correlated with ERBB, while the other three genes in each gene were negatively correlated with ERBB. This revealed that the expression of these four genes were related to the biological development mechanism of HER-2, whose specific mechanism need further experimental research. This also suggested that COL1A1, COL1A2, COL6A3, and SULF1 genes had the potential to be a biomarker for predicting HER-2 positive GC.
COL1A1, COL1A2, and COL6A3 are family proteins. Target gene interaction maps predicted by the STRING database showed SULF1 linkage by COL3A1. More experiments may be needed to verify the upstream and downstream signal pathways.
Compared with previous studies,19,20 we also found COL1A1, COL1A2, COL6A3, and SULF1 genes participated in inflammatory responses and infiltration of immune cells. According to our results, there was a strong association in chemokine expression versus the infiltration of the following types of immune cells: B cells, CD4+ T cells, CD8+ T cells, macrophages, dendritic cells, and neutrophils, suggesting that these genes might serve as indicators of prognosis, as well as immune status.
This study had some shortcomings. In addition, we need more clinical data, such as age, sex, tumor size, lymph node, Lauren subtypes, and EBV status. Tumor Epstein–Barr virus (EBV) status is increasingly becoming a biomarker of choice for personalized treatment approaches in gastric cancer. An estimated 8–10% of gastric cancers are associated with EBV infection, making EBV-positive gastric cancer the largest group of EBV-associated malignancies.21,22 In future experiments, exploring the correlation between EBV and those four genes in gastric cancer may be needed.
In conclusion, these findings may offer new insights into the development of new immune-therapeutic drugs against gastric cancer. Our results may also assist in identifying potential biomarkers for the timely diagnosis and prognosis of gastric cancer.
Conclusion
In this study, we found COL1A1, COL1A2, COL6A3, and SULF1 genes were significantly upregulated in stomach adenocarcinomas and related to the TNM stage, closely related to overall survival, and participated in inflammatory responses and infiltration of immune cells. These findings revealed that COL1A1, COL1A2, COL6A3, and SULF1 can be used as a candidate biomarker for the prognosis of gastric cancer.
Disclosure
The authors report no conflicts of interest in this work.
References
1. Torre LA, Siegel RL, Ward EM, Jemal A. Global cancer incidence and mortality rates and trends-an update. Cancer Epidemiol Biomarkers Prev. 2016;25:16–27. doi:10.1158/1055-9965.EPI-15-0578
2. Zhao JK, Wu M, Kim CH, et al. Jiangsu Four Cancers Study: a large case-control study of lung, liver, stomach, and esophageal cancers in Jiangsu Province, China. Eur J Cancer Prev. 2017;26:357–364. doi:10.1097/CEJ.0000000000000262
3. World Health Organization. GLOBOCAN 2018: Stomach cancer fact sheet. Geneva: International Agency for Research on Cancer; 2018.
4. Torre LA, Bray F, Siegel RL, et al. Global cancer statistics 2012. CA Cancer J Clin. 2015;65:87–108. doi:10.3322/caac.21262
5. Ma J, Shen H, Kapesa L, Zeng S. Lauren classification and individualized chemotherapy in gastric cancer. Oncol Lett. 2016;11:2959–2964. doi:10.3892/ol.2016.4337
6. Zhou D, Lu M, Jiang M. Study on early diagnosis of gastric cancer. Chin J Gastroenterol Hepatol. 2021;30(06):606–611.
7. Hamashima C. Current issues and future perspectives of gastric cancer screening. World J Gastroenterol. 2014;20(38):13767–13774. doi:10.3748/wjg.v20.i38.13767
8. Li L, Chen Y, Lin C. Screening of prognosis biomarkers in human gastric carcinoma based on bioinformatics analysis. J Fujian Normal Univ. 2020;36(06):66–72.
9. Chen Y, Wang W, Wang L, He J. Expression and Clinical Prognosis of COL4A1 in gastric cancer based on bioinformatics prediction. Anti-Tumor Pharmacy. 2019;9(4):
10. Chen X, Leung SY, Yuen ST, et al. Variation in gene expression patterns in human gastric cancers. Mol Biol Cell. 2003;14(8):3208–3215. doi:10.1091/mbc.e02-12-0833
11. Cho JY, Lim JY, Cheong JH, et al. Gene expression signature-based prognostic risk score in gastric cancer. Clin Cancer Res. 2011;17(7):1850–1857. doi:10.1158/1078-0432.CCR-10-2180
12. Cui J, Chen Y, Chou WC, et al. An integrated transcriptomic and computational analysis for biomarker identification in gastric cancer. Nucleic Acids Res. 2011;39(4):1197–1207. doi:10.1093/nar/gkq960
13. Wang J, Yang YH, Wang AQ, et al. Immunohistochemical detection of the Raf kinase inhibitor protein in nonneoplastic gastric tissue and gastric cancer tissue. Med Oncol. 2010;27(2):219–223. doi:10.1007/s12032-009-9194-z
14. Li J, Ding YM, Li AQ. Identification of COL1A1 and COL1A2 as candidate prognostic factors in gastric cancer. World J Surg Oncol. 2016;14:297. doi:10.1186/s12957-016-1056-5
15. Liu W, Li L, Ye H, Tao H, He H. Role of COL6A3 in colorectal cancer. Oncol Rep. 2018;39(6):2527–2536.
16. Hur K, Han T-S, Jung E-J, et al. Up-regulated expression of sulfatases (SULF1 and SULF2) as prognostic and metastasis predictive markers in human gastric cancer. J Pathol. 2012;228(1):88–98. doi:10.1002/path.4055
17. Yasui W, Oue N, Aung PP, et al. Molecular-pathological prognostic factors of gastric cancer: a review. Gastric Cancer. 2005;8:86–94. doi:10.1007/s10120-005-0320-0
18. Chua TC, Merrett ND. Clinicopathologic factors associated with HER2 positive gastric cancer and its impact on survival outcomes- a systematic review. Int J Cancer. 2012;130:2845–2856. doi:10.1002/ijc.26292
19. Li Z, Liu Z, Shao Z, et al. Identifying multiple collagen gene family members as potential gastric cancer biomarkers using integrated bioinformatics analysis. PeerJ. 2020;8:e9123. doi:10.7717/peerj.9123
20. Cheng L, Zhang Q, Yang S, et al. A 4-gene panel as a marker at chromosome 8q in Asian gastric cancer patients. Genomics. 2013;102(4):323–330. doi:10.1016/j.ygeno.2013.05.004
21. Sousa H, Pinto-Correia AL, Medeiros R, Dinis-Ribeiro M. Epstein-Barr virus is associated with gastric carcinoma: the question is what is the significance? World J Gastroenterol. 2008;14:4347–4351. doi:10.3748/wjg.14.4347
22. Jacome AA, Lima EM, Kazzi AI, et al. Epstein-Barr virus-positive gastric cancer: a distinct molecular subtype of the disease? Rev Soc Bras Med Trop. 2016;49:150–157. doi:10.1590/0037-8682-0270-2015
 © 2021 The Author(s). This work is published and licensed by Dove Medical Press Limited. The full terms of this license are available at https://www.dovepress.com/terms.php and incorporate the Creative Commons Attribution - Non Commercial (unported, v3.0) License.
By accessing the work you hereby accept the Terms. Non-commercial uses of the work are permitted without any further permission from Dove Medical Press Limited, provided the work is properly attributed. For permission for commercial use of this work, please see paragraphs 4.2 and 5 of our Terms.
© 2021 The Author(s). This work is published and licensed by Dove Medical Press Limited. The full terms of this license are available at https://www.dovepress.com/terms.php and incorporate the Creative Commons Attribution - Non Commercial (unported, v3.0) License.
By accessing the work you hereby accept the Terms. Non-commercial uses of the work are permitted without any further permission from Dove Medical Press Limited, provided the work is properly attributed. For permission for commercial use of this work, please see paragraphs 4.2 and 5 of our Terms.