")
Back to Archived Journals » Open Access Animal Physiology » Volume 7
Different stimulating effects of caseins and whey proteins of processed cow and buffalo milk on lymphocyte proliferation in vitro
Authors Shandilya U, Kapila R, Kapila S, Kansal VK
Received 24 February 2015
Accepted for publication 11 May 2015
Published 13 July 2015 Volume 2015:7 Pages 121—127
DOI https://doi.org/10.2147/OAAP.S83321
Checked for plagiarism Yes
Review by Single anonymous peer review
Peer reviewer comments 3
Editor who approved publication: Dr Peter Koulen
Umesh Kumar Shandilya, Rajeev Kapila, Suman Kapila, Vinod K Kansal
Animal Biochemistry Division, National Dairy Research Institute, Karnal, Haryana, India
Abstract: In this study, caseins and whey proteins after thermal processing of cow and buffalo milk (pasteurized, boiled, and sterilized) were evaluated for their effects on proliferation of mouse splenic lymphocytes with concanavalin A (ConA), lipopolysaccharide (LPS), and milk proteins. Swiss albino mice (3 weeks old) were sensitized by intraperitoneal injections of caseins or whey proteins (20 µg/200 µL of phosphate-buffered saline) with aluminum hydroxide (alum) as adjuvant, while the positive and negative control groups were sensitized with ovalbumin and normal saline, respectively. The in vitro experiments showed that boiling and sterilization of milk decreases proliferation of cultured lymphocyte with mitogens and milk proteins as well. On the contrary, an increase of proliferation index was observed after pasteurization. These results highlight the impact of thermal processing of caseins and whey proteins on the host's specific and nonspecific immune responses.
Keywords: processing, milk proteins, allergenicity, splenocytes
Introduction
Thermal processing of milk is an essential step in milk production adopted by the dairy industry. Heat treatment of milk aims to extend the shelf life and improve the quality of this complex biological fluid by reducing the microbial load, thus minimizing the risk of food poisoning.1 Processing may alter food by masking or unmasking allergenic epitopes, thus reducing or enhancing allergen recognition and potentially altering allergenicity of the offending food. Alteration in protein structure (by food processing) can lead to epitope destruction, modification, masking, or unmasking, with decreased, increased, or no effect on allergenicity.2
We previously showed that boiling and sterilization (at 120°C for 20 minutes) of both cow and buffalo milk clearly affect the allergenicity, by decreasing the relevant humoral and cell-mediated responses in mice.3 Moreover, there was wide cross-reactivity between cow and buffalo milk proteins.4 There is no reliable single laboratory test available for the diagnosis of milk allergy. If an allergic mechanism is suspected, a number of laboratory tests may be useful in delineating specific proteins responsible for IgE-mediated disorders.5 Despite controversial results from analyses of cellular responses to cow milk antigens,6–9 some investigators proposed that antigen-stimulated lymphocyte proliferation assays should be used as a diagnostic or predictive test for food allergy.10,11
This study focused on the effect of thermal processing (pasteurization, boiling, and sterilization) of milk on lymphocyte proliferation. The objective was an evaluation of the impact of milk thermal processing on properties of caseins (CSN) and whey proteins (WP) to affect lymphocyte proliferation in vitro. All of the thermal processing conditions used in this study represent different types of methods commonly used in the dairy sector for milk processing.
Materials and methods
Thermal processing of milk samples
Fresh cow and buffalo raw milk (RM) samples were collected from the Cattle Yard of National Dairy Research Institute (Karnal, India). Pasteurization of milk was done in the experimental plant of the institute at 75°C for 15 seconds. The milk was heated (100.8°C) until boiling to get boiled milk (BM) while sterilization of milk was performed at 120°C for 20 minutes in glass bottles.
Preparation of CSN and WP
Skimmed milk was acidified to pH 4.6 by stepwise addition of 3 M HCl.12 The precipitated CSN was washed with distilled water until pH 7. Furthermore, the solution was incubated for 30 minutes at 40°C and CSN were removed by centrifugation at 7,500× g for 15 minutes at 4°C. The supernatant containing WP was dialyzed using 10 kDa cut-off membranes (Spectrum Laboratories, Rancho Dominguez, CA, USA). The total concentration of buffalo WP was determined by the Lowry method13 and aliquots were stored at -80°C until used.
Sodium dodecyl sulfate polyacrylamide gel electrophoresis analysis
The concentration of proteins in various samples was estimated using the method of Lowry et al.13 The purity of fractionated milk proteins (whole CSN and WP) was checked by sodium dodecyl sulfate polyacrylamide gel electrophoresis (SDS-PAGE) using a 15% resolving polyacrylamide gel using the method of Laemmli,14 loading an equal mass (20 μg) of milk protein into each well. All reagents of electrophoresis were purchased from Sisco Research Laboratories, Pvt Ltd (Mumbai, India).
Animal sensitization protocol
Three-week-old male Swiss albino mice were maintained in the Small Animal House of the National Dairy Research Institute. The animals were housed in sterilized plastic polypropylene cages with a 12/12-hour light/dark cycle at a 20°C–25°C ambient temperature, on a special milk-free diet. A total of 112 animals were randomly divided into 16 groups of seven mice each (Table 1), ie, positive control, negative control, and 14 experimental groups. All procedures were approved by the Institutional Animal Ethical Committee (registration number 1705/GO/ac/13/CPCSEA). Mice (n=7/group) were sensitized thrice at weekly intervals by intraperitoneal injection of 20 μg whole CSN or WP using 2% alum Al(OH)3 as adjuvant in 200 μL of phosphate-buffered saline (PBS). Negative control group mice were given PBS while positive control mice were sensitized with the same dose of ovalbumin.
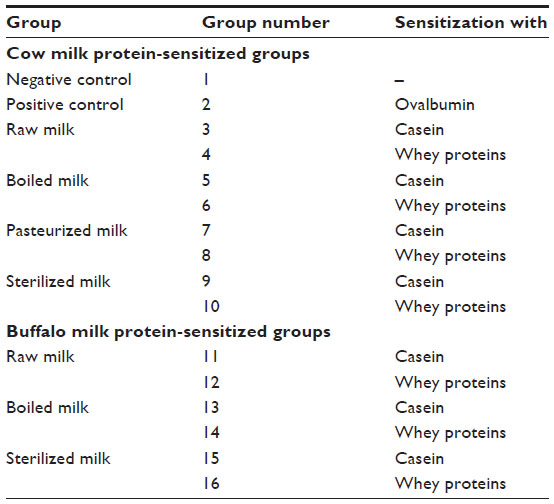 | Table 1 Grouping of mice |
Splenocytes
One week after the last injection, mice were killed by cervical dislocation. Spleens were removed and placed in RPMI 1640 medium supplemented with HEPES buffer (20 mM), sodium bicarbonate (24 mM), penicillin, and streptomycin (Sigma-Aldrich Co, St Louis, MO, USA). The splenocytes were isolated by injecting the medium into the spleen, after which the spleens were teased apart. The splenocytes-enriched upper portion of the medium was transferred to a 15 mL sterile centrifuge tube and centrifuged at 1,000× g for 5 minutes. Cells were washed with RPMI medium, and, to remove erythrocytes, the splenocytes were incubated for 5 minutes in erythrocyte lysis buffer (10 mL of Tris-HCl 0.17 M and 90 mL of NH4Cl 0.6 M, pH 7.3). Erythrocyte lysis buffer was washed out by adding 5 mL of culture medium and centrifuging at 1,000× g for 5 minutes at 4°C. After washing twice, splenocytes were suspended in 1 mL of RPMI 1640 containing 10% fetal calf serum and cells were counted from a small aliquot of cell suspension. Trypan blue exclusion was used as parameter to check the viability of the immune cells.
Lymphocyte proliferation assay
The splenic leukocyte suspension (107 cells/mL) was cultured in RPMI 1640 medium plus 10% heat-inactivated fetal calf serum, with or without LPS (50 μg/mL), or CSN/WP (50 μg/mL), or ConA (5 μg/mL) and incubated at 37°C in a humidified atmosphere of 5% CO2 in an incubator for 48 hours. Then, 10 μL of MTT (5 mg/mL) was added in each well and incubated for 4 hours at 37°C. One hundred microliters per well of 0.1 N HCl in anhydrous isopropanol were added and mixed thoroughly to dissolve the dark blue crystals of formazan. Formazan quantification was performed using an enzyme-linked immunosorbent assay (ELISA) plate reader with 540 nm test and 630 nm reference wavelengths. Cell proliferation was expressed as stimulation index (SI) (A540 with mitogen/A540 without mitogen).
ELISA for milk protein-specific serum antibodies
Whole CSN- and WP-specific IgE antibodies were detected using ELISA. Plastic microtiter plates (Nunc, Copenhagen, Denmark) were coated with 100 μg/mL of protein (CSN or WP) in PBS by overnight incubation at 4°C. The plates were blocked by incubation for a further 1 hour at 37°C with 1% bovine serum albumin (BSA) (Sigma-Aldrich Co) in PBS (for plates containing CSN) or 1% fish gelatin (for the plates containing WP). Mouse serum samples diluted (1:5) in 1% BSA in PBS were added to wells and incubated for 1 hour at 37°C. There followed a further incubation for 1 hour at 37°C with peroxidase-labeled goat anti-mouse IgE diluted 1:10,000 in 1% BSA in PBS. PBS containing 0.05% Tween 20 was used for washing after each step. Enzyme substrate TMB (3,3′,5,5′-tetramethyl diamine benzidine containing 0.03% H2O2) was added to each well and the reaction stopped after 15 minutes by the addition of 100 μL of 2 M H2SO4. Substrate conversion was measured as optical density at 450 nm using an automated ELISA reader (Microscan, EC Co, India Pvt Ltd, Hyderabad, India). Antibody concentration in each sample was expressed as optical density/100 μL.
Statistical analysis
Results were expressed as means ± standard error of the mean. Analysis of variance (one-way) was performed using GraphPad PRISM version 5.0 (GraphPad Software, Inc., La Jolla, CA, USA) statistical software package and the differences between groups were tested by Tukey–Kramer post hoc test. Significance of difference was set at P≤0.05.
Results
In order to check purity of isolated CSN and WP, SDS-PAGE was performed on 15% acrylamide gel. The SDS-PAGE profile of CSN, WP, and whole milk is shown in Figure 1. The sodium dodecyl sulfate-electrophoretic profile of whole milk contains three major bands identified as α-CSN, β-CSN, and κ-CSN and two minor bands identified as α-lactalbumin and β-lactoglobulin, while the whole CSN fraction showed prominent bands of α-CSN and β-CSN. In the WP fraction, two bands were detected corresponding to β-LG and α-LA. No major band of contaminating cross proteins were observed in CSN as well as in WP preparation. Both whole CSN and WP were reasonably pure as only relevant bands were obtained in SDS-PAGE. However, it was difficult to differentiate β-CSN and κ-CSN in the whole CSN fraction. Although the molecular weight of CSN fractions fall in the range 19–25 kDa, their apparent mass in SDS-PAGE appeared to be near or above 30 kDa due to phosphorylation of proteins.
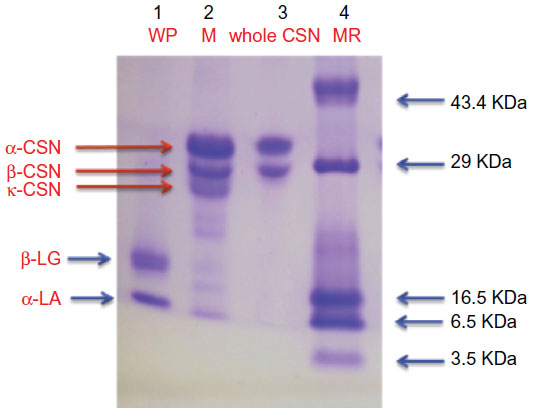 | Figure 1 SDS-PAGE of isolated CSN and WP. |
Proliferative response to ConA and LPS
The effect of thermal processing of CSN and WP on murine lymphocyte proliferation, expressed as SI, was evaluated in the absence and presence of mitogen during in vitro culture (Figure 2). Lymphocyte proliferation with the B-cell mitogen (LPS) and T-cell mitogen (ConA) proved to be different in mice sensitized with CSN or WP of differently processed milk of cow and buffalo (Figure 3A). However, Con A-stimulated lymphocytes of mice sensitized with ovalbumin (positive control) showed a 32% increase in SI, whereas control mice (negative control) showed a normal proliferative response to this mitogen. The SI of CSN- and WP-sensitized mice was decreased by 10.46% and 21.35%, respectively, in sterilized milk (SM) of cow compared to RM counterparts, while the effect was similar in the case of the CSN and WP groups of buffalo SM. Moreover, the reduction was also observed in BM groups, but the effect was more prominent in SM groups (Figure 3A and B).
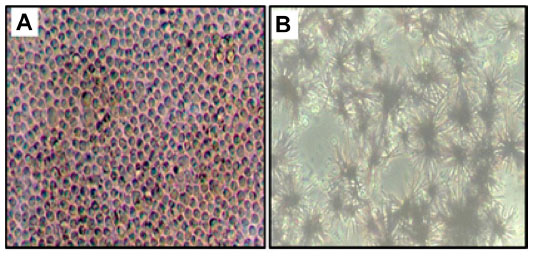 | Figure 2 Photomicrographs showing 48-hour-cultured splenocytes (A) formation of formazan crystals (B) after addition of MTT to cultured splenocytes. |
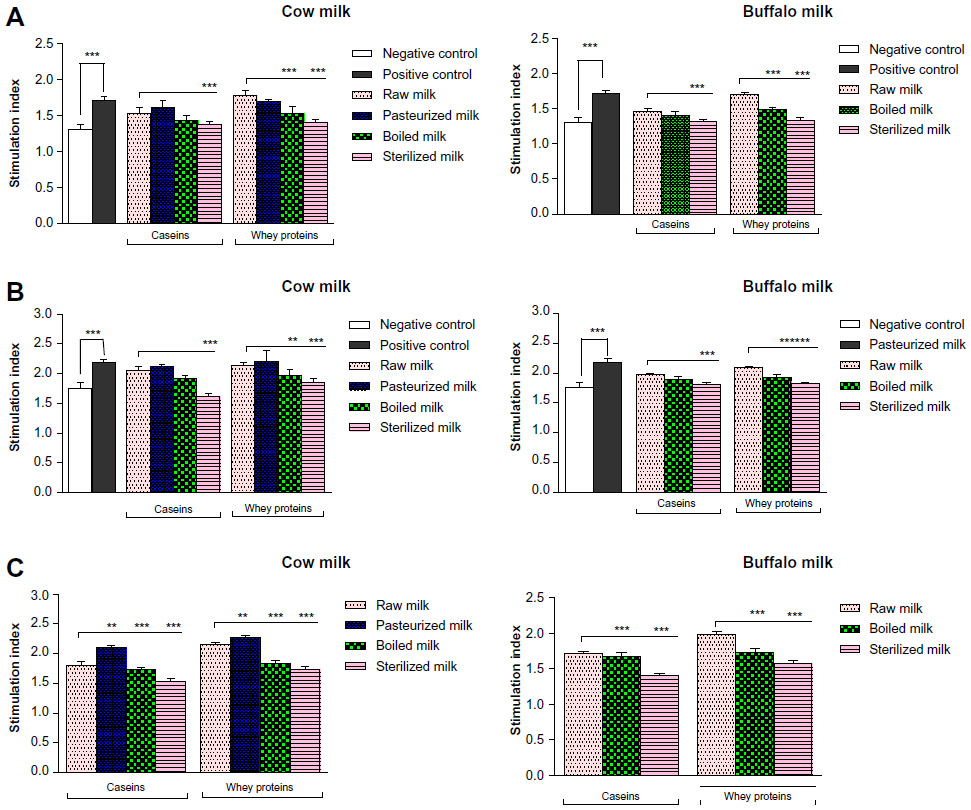 | Figure 3 Stimulation indices of splenocytes collected from mice sensitized with caseins or whey proteins of differently processed cow or buffalo milk. |
In a comparative assessment of SI within the cow CSN group of thermally processed milk, it was observed that maximum reduction of SI (10.5%) occurred in SM followed by BM; contrary to this, a 6% increase was identified on pasteurization compared to RM. Similarly, BM and SM WP reduced the SI values significantly (P≤0.05) in contrast to pasteurization, as compared with RM.
There was no significant difference among cow RM CSN- and WP-sensitized mice in the proliferative response of lymphocytes to LPS (Figure 3B). However, when CSN isolated from differently processed cow milk were compared, lymphocyte blastogenesis decreased significantly in BM and SM groups, compared with their RM counterparts. The splenocyte proliferative response to LPS was decreased by 21% in the cow SM CSN group, with respect to RM. In buffalo CSN-sensitized groups, the lymphocyte proliferation decreased by 10% and 6% in SM and BM groups, respectively.
Proliferative response to milk proteins (CSN and WP)
The CSN and WP were tested at 50 μg/mL in vitro, for their potential influence on lymphocyte proliferation. The proliferative responses of lymphocytes to CSN and WP, in experimental and control groups, are shown in Figure 3C. The highest SI was detected in the ovalbumin-sensitized control group, compared with the CSN- and WP-sensitized groups. The values of SI level in our assay were 1.8, 2.1, 1.7, and 1.5 for CSN of RM, pasteurized milk (PM), BM, and SM, respectively, while for WP of RM, PM, BM, and SM, these were 2.2, 2.3, 1.8, and 1.7, respectively. We could observe that CSN and WP of PM showed high values of SI. Interestingly, in our previous published work, the same groups showed the elevated levels of total IgG and IgE.3 When the values of SI for CSN and WP from RM were compared with the PM, BM, and SM counterparts, a significant difference was observed only for SM CSN and WP. SIs of CSN and WP from BM and SM were significantly lower than those of the control group (RM CSN and WP). In the case of buffalo milk, the proliferation index with CSN revealed a more pronounced decrease using SM, compared with BM and RM samples. However, the proliferation index with WP decreased significantly both in BM and SM.
The SIs in response to CSN and WP of differently processed cow and buffalo milk are depicted in Figure 3. Addition of cow CSN and WP to cultured splenocytes of sensitized mice significantly increased their proliferation compared to the negative control group, irrespective of the thermal treatment of milk. A similar increasing trend was recorded for buffalo milk.
Specific IgE response in serum
Sensitization potential of CSN and WP isolated from processed cow and buffalo milk was also observed in terms of specific IgE response in serum. ELISA plates were coated with specific CSN and WP obtained from RM and differently processed milk. Our results (Figure 4) revealed that boiling and sterilization of both cow and buffalo milk reduced protein-specific IgE remarkably (P≤0.001). However, sterilization of cow and buffalo milk appeared to be more effective than boiling and reduced CSN-specific IgE by 50% and 36% in CSN-sensitized animals while, 65% and 46% in WP-sensitized animals, respectively.
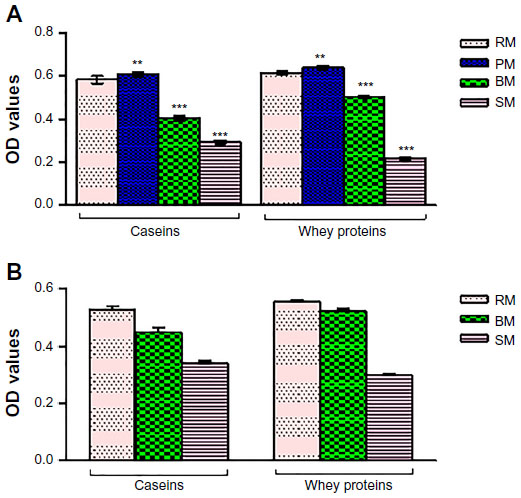 | Figure 4 Milk protein-specific IgE levels in serum collected from mice sensitized with caseins and whey proteins of processed milk samples. |
Discussion
One of the most important steps in specific immune reactivity is clonal expansion (proliferation) to produce a pool of antigen-reactive lymphocytes. Lymphocyte proliferation is commonly examined to analyze the efficacy of an immunosuppressive or immunoenhancing therapy and chemicals for their immune-toxic potential and congenital immunological defects. For experimental purposes, cellular proliferation is usually induced in vitro via addition to cell cultures of lectin mitogens, which are targeted toward B or T lymphocytes. In this study, an association between processed milk proteins (CSN and WP) and extent of lymphocyte proliferative response was observed in the sensitized groups of mice, suggesting that thermal processing of milk is a significant factor in the effector mechanism observed.
The present study demonstrated that splenic lymphocytes isolated from mice sensitized with CSN or WP of processed cow and buffalo milk showed variable SI against LPS, ConA, and milk proteins (CSN and WP). The CSN and WP both stimulated the proliferation of splenocytes, but in a thermal processing-dependent manner. Significant differences were observed between CSN and WP of PM and RM counterparts. Also, the SI values were more decreased for the CSN and WP of SM compared with BM counterparts, indicating that high-temperature treatment of milk decreases the antigenicity of milk proteins. We reported that whole CSN of cow and buffalo milk, irrespective of their processing type, enhanced the proliferation of splenocytes as compared to negative control. In agreement with Carr et al,15 our results showed that α-s1 CSN could enhance the mitogen-stimulated proliferation of murine splenic T lymphocytes, when included in in vitro cell culture. Our results revealed that splenocytes of milk protein-sensitized mice showed high SI with WP compared with whole CSN in lymphocyte cultures in vitro. But contrary to this, Torre and Oliver16 demonstrated suppression of bovine T lymphocyte mitogenesis by milk-derived whole WP included in cell cultures. The whole whey derived from lactating dairy cattle could be a potent suppressant of bovine T and B lymphocyte proliferation. Cross and Gill17 have shown that a modified WP concentrate suppressed mitogen- and alloantigen-induced proliferation when included in vitro in murine lymphocyte cultures. Our results revealed that SI of lymphocytes in the presence of respective proteins was significantly reduced using BM and SM samples as compared to the respective RM CSN- and WP-sensitized groups. One explanation for these results could be an alteration in the three-dimensional structure of milk proteins (CSN and WP) during the thermal treatments, ie, pasteurization, boiling, and sterilization. CSN and WP could pre-activate splenic lymphocytes in vivo so as to respond differently during second exposure in vitro to the same protein, which in turn could be responsible for the different lymphocyte SI against processed milk CSN and WP. Tainio and Savilahti18 used a β-lactoglobulin lymphocyte stimulation test and they found among young infants with immediate reactions to cow milk proteins that most of them did not have specific IgE to cow milk proteins but they had positive results in the β-lactoglobulin stimulation test. In another study, Suomalainen et al7 measured the cellular immune response to cow milk protein in patients with challenge-proven cow milk allergy manifested with either gastrointestinal or skin symptoms. SI for lymphocytes in patients manifesting cow milk allergy with gastrointestinal symptoms was significantly higher than in patients with skin symptoms or patients with negative clinical challenge. Papadopoulos et al19 evaluated lymphocyte proliferation to β-lactoglobulin by quantitation of the proliferating cell nuclear antigen (PCNA) expression in peripheral blood mononuclear cell, and they reported a marked difference of PCNA expression between cow milk-fed allergic infants and healthy controls and suggested that PCNA could be a useful marker in the assessment of lymphocyte proliferation to cow milk antigens. Kondo et al20 demonstrated that proliferative responses of peripheral blood mononuclear cell to different food antigens in non-immediate-type hypersensitivity are useful for the detection of allergens. However, Hoffman et al21 indicated that lymphocyte proliferation assays are neither diagnostic nor predictive of clinical reactivity in individual patients with milk allergy. They found that lymphocytes of many control patients are highly responsive to milk antigens and lymphocytes of many patients with milk allergy are not in the experimental conditions used in their studies. We found that groups did not show the same reactions to the milk proteins assayed, supporting the importance of testing different milk CSN and WP for their immunological potential. The lesser response in the groups given BM and SM could be attributed to the loss of epitopes present on the native structure of milk proteins during thermal treatment of milk.
Conclusion
From our data, it is clear that milk proteins (CSN and WP) have the ability to affect lymphocyte proliferation. We suggest a direct impact of milk processing on protein to explain the in vitro results. On the other hand, sensitization of mice with CSN and WP could pre-activate lymphocytes in vivo, which, in turn, could show different blastogenesis after activation with the same protein in vitro. These results are important to understanding how a parameter like lymphocyte SI can be used to diagnose milk protein allergy.
Acknowledgment
The authors thankfully acknowledge the Department of Science and Technology (DST), New Delhi, India for awarding fellowship grants to one of the authors (Umesh Kumar Shandilya).
Disclosure
The authors report no conflicts of interest in this work.
References
McKinnon IR, Yap SE, Augustin MA, Hemar Y. Diffusing-wave spectroscopy investigation of heated reconstituted skim milks containing calcium chloride. Food Hydrocoll. 2009;23:1127–1133. | |
Sathe SK, Teuber SS, Roux KH. Effects of food processing on the stability of food allergens. Biotechnol Adv. 2005;23:423–429. | |
Shandilya UK, Panwar V, Haq MR, Kapila R, Kansal VK. IgE and IgG cross reactivity between cow and buffalo milk proteins in Swiss albino mice model. Milchwissenschaft [Milk Sci International]. 2012;67:235–237. | |
Shandilya UK, Kapila R, Haq M, Kapila S, Kansal VK. Effect of thermal processing of cow and buffalo milk on the allergenic response of caseins and whey proteins in mice. J Sci Food Agric. 2013;93(9):2287–2292. | |
Dupont C, Heyman M. Food protein-induced enterocolitis syndrome: laboratory perspectives. J Pediatr Gastroenterol Nutr. 2000;30 Suppl:S50–S57. | |
Scheinmann P, Gendrel D, Charlas J, Paupe J. Value of lymphoblast transformation test in cow’s milk protein intestinal intolerance. Clin Allergy. 1976;6:515–521. | |
Suomalainen H, Soppi E, Isolauri E. Lymphocyte response to cow’s milk proteins in patients with cow’s milk allergy: relationship to antigen exposure. Pediatr Allergy Immunol. 1994;5:20–26. | |
Hill DJ, Ball G, Hosking CS. Clinical manifestations of cows’ milk allergy in childhood. I. Associations with in-vitro cellular immune responses. Clin Allergy. 1998;18:469–479. | |
Høst A. Frequency of cow’s milk allergy in childhood. Ann Allergy Asthma Immunol. 2002;89:33–37. | |
Kondo N, Agata H, Fukutomi O, Motoyoshi F, Orii T. Lymphocyte responses to food antigens in patients with atopic dermatitis who are sensitive to foods. J Allergy Clin Immunol. 1990;86:253–260. | |
Kondo N, Kobayashi Y, Shinoda S, et al. Cord blood lymphocyte responses to food antigens for the prediction of allergic disorders. Arch Dis Child. 1992;67:1003–1007. | |
Vyas HK, Izco JM, Jiménez-Flores R. Scale-up of native beta- lactoglobulin affinity separation process. J Dairy Sci. 2002;85:1639–1645. | |
Lowry OH, Rosebrough NJ, Farr AL, Randall RJ. Protein measurement with the Folin phenol reagent. J Biol Chem. 1951;193:265–275. | |
Laemmli UK. Cleavage of structural proteins during the assembly of the head of bacteriophage T4. Nature. 1970;227:680–685. | |
Carr RI, Webster D, Sadi D, Williams H, Walsh N. Immunomodulation by opioids from dietary casein (exorphins). Ann N Y Acad Sci. 1990;594:374–376. | |
Torre PM, Oliver SP. Suppression of mitogenic response of peripheral blood mononuclear cells by bovine mammary secretions. J Dairy Sci. 1989;72:219–227. | |
Cross ML, Gill HS. Modulation of immune function by a modified bovine whey protein concentrate. Immunol Cell Biol. 1999;77:345–350. | |
Tainio VM, Savilahti E. Value of immunologic tests in cow milk allergy. Allergy. 1990;45:189–196. | |
Papadopoulos NG, Syrigou EI, Bossios A, Manou O, Gourgiotis D, Saxoni-Papageorgiou P. Correlation of lymphocyte proliferating cell nuclear antigen expression with dietary cow’s milk antigen load in infants with allergy to cow’s milk. Inter Arch Allergy Immunol. 1999;119:64–68. | |
Kondo N, Fukutomi O, Agata H, Yokoyama Y. Proliferative responses of lymphocytes to food antigens are useful for detection of allergens in nonimmediate types of food allergy. J Investig Allergol Clin Immunol. 1997;7:122–126. | |
Hoffman KM, Ho DG, Sampson HA. Evaluation of the usefulness of lymphocyte proliferation assays in the diagnosis of allergy to cow’s milk. J Allergy Clin Immunol. 1997;99:360–366. |
 © 2015 The Author(s). This work is published and licensed by Dove Medical Press Limited. The full terms of this license are available at https://www.dovepress.com/terms.php and incorporate the Creative Commons Attribution - Non Commercial (unported, v3.0) License.
By accessing the work you hereby accept the Terms. Non-commercial uses of the work are permitted without any further permission from Dove Medical Press Limited, provided the work is properly attributed. For permission for commercial use of this work, please see paragraphs 4.2 and 5 of our Terms.
© 2015 The Author(s). This work is published and licensed by Dove Medical Press Limited. The full terms of this license are available at https://www.dovepress.com/terms.php and incorporate the Creative Commons Attribution - Non Commercial (unported, v3.0) License.
By accessing the work you hereby accept the Terms. Non-commercial uses of the work are permitted without any further permission from Dove Medical Press Limited, provided the work is properly attributed. For permission for commercial use of this work, please see paragraphs 4.2 and 5 of our Terms.