")
Back to Journals » International Journal of General Medicine » Volume 9
Differences in genotype frequencies of salt-sensitive genes between fishing and nonfishing communities in Japan
Authors Harada M, Takeshima T, Okayama M, Kajii E
Received 26 July 2015
Accepted for publication 9 February 2016
Published 12 April 2016 Volume 2016:9 Pages 73—78
DOI https://doi.org/10.2147/IJGM.S93148
Checked for plagiarism Yes
Review by Single anonymous peer review
Peer reviewer comments 2
Editor who approved publication: Dr Scott Fraser
Masanori Harada,1 Taro Takeshima,2 Masanobu Okayama,2,3 Eiji Kajii,2
1Department for Support of Rural Health Care, Yamaguchi Grand Medical Center, Hofu, Yamaguchi, 2Division of Community and Family Medicine, Center for Community Medicine, Jichi Medical University, Shimotsuke, 3Division of Community Medicine and Medical Education, Kobe University Graduate School of Medicine, Kobe, Japan
Purpose: To identify the differences in genotype frequencies of salt-sensitive genes between residents of fishing communities (FCs) and nonfishing communities (NFCs).
Methods: The subjects included 18,156 individuals (8,043 males [44%] and 10,113 females [56%]; average age: 57.2±16.1 years) from the general population who were registered with large-scale genome banks and resided in 30 prefectures and 78 different regions in Japan. The measurement items were age, sex, blood pressure, presence or absence of hypertension, body mass index, alcohol consumption, and smoking habit. Furthermore, to analyze the genotype frequencies of salt-sensitive genes, α-adducin 1 (ADD1), angiotensinogen (AGT), angiotensin II receptor type 1 (AT1), and guanine nucleotide-binding protein β peptide 3 (GNB3) were measured. According to the 2004 government classification of municipalities (cities, towns, and villages), communities existing in areas bordering an ocean and with an ocean port were defined as FCs (28 areas). The others were defined as NFCs (50 areas). A logistic regression model was used for comparison of genotype frequencies between subjects residing in FCs and NFCs.
Results: Of the included subjects, 4,916 (27.0%) and 13,240 (73.0%) resided in FCs and NFCs, respectively. In FCs, the mean age was 59.4±16.7 years and men accounted for 41.0% of the cohort (n=2,015). In NFCs, the mean age was 56.4±15.8 years and men accounted for 45.5% of the cohort (n=6,028). The adjusted odds ratios of the AA and AG genotypes compared with the GG genotype for AGT were 0.80 (95% confidence interval [CI]: 0.68–0.95) and 0.76 (95% CI: 0.64–0.91), respectively. The adjusted odds ratio of the CC genotype compared with AA for AT1 was 0.63 (95% CI: 0.40–0.93).
Conclusion: The incidence of the salt-sensitive genotypes AGT and AT1 in residents of FCs were significantly lower than in NFCs.
Keywords: salt-sensitive, hypertension, single-nucleotide polymorphisms, regional difference, lifestyle, behavior
Introduction
Hypertension (HT) is a risk factor for cardiovascular disease.1–4 Regional differences in blood pressure (BP) levels and the prevalence of cardiovascular disease have been reported worldwide, and the mechanisms underlying these differences have been partly explained by sociodemographic and environmental factors.5–10
Some previous population-based studies conducted in Japan have demonstrated lower incidences of atherosclerosis and cardiovascular diseases in fishing communities (FCs) compared with nonfishing communities (NFCs). The lower prevalence of atherosclerotic diseases (coronary heart disease and cerebral infarction), lower intima–media thickness, and occurrence of carotid plaques among individuals residing in FCs who have higher fish consumption than those living in NFCs suggest that eicosapentaenoic acid and docosahexaenoic acid in fish play a preventive role against atherosclerosis.11–15 α-Adducin 1 (ADD1), angiotensinogen (AGT), angiotensin II receptor type 1 (AT1), and guanine nucleotide-binding protein β peptide 3 (GNB3) are reportedly salt-sensitive genes associated with HT.16–18 The Gly460Trp polymorphism of the ADD-1 gene codes for a cell membrane skeletal protein identified as essential to HT with salt sensitivity.19 AGT and AT1 are mainly associated with the renin–angiotensin–aldosterone system.20,21 The G protein is involved in renal Na+/H+ transport, while GNB3 is its subunit gene.22
A recent Japanese study reported a difference in salt-sensitive genotype frequencies among samples divided into four groups by area.23 However, there has been no comprehensive study comparing genetic factors and the frequencies of salt-sensitive genotypes according to residence in FCs versus NFCs.
Thus, the purpose of the present study was to compare the frequencies of salt-sensitive genotypes among residents in FCs versus NFCs to identify the correlations between the genetic factors and residence in FCs.
Materials and methods
Study design and subjects
This observational study included a total of 21,004 Japanese men and women (age: ≥20 years) from 78 mostly rural areas of 30 prefectures in Japan. These individuals were enrolled in the Genome Banking Project of the 21st Century COE (Center of Excellence) Program at the Center for Community Medicine, Jichi Medical University (Shimotsuke, Japan) between 2004 and 2008. All subjects provided written informed consent before participation in this study. Of these subjects, 12,361 were residents who underwent annual medical checkups authorized by each municipal government, 5,709 were outpatients who regularly visited clinics and hospitals in their area, 1,846 were inpatients, and 1,088 were patients for whom no information about participation in the project was provided.
Subjects without complete data for all variables were excluded from statistical analysis (Figure 1). The ADD1, AGT, AT1, and GNB3 genotypes could not be determined for 76, 38, 38, and 59 subjects, respectively. Moreover, data concerning area of residence, age, sex, systolic blood pressure (SBP), diastolic blood pressure (DBP), HT, hyperlipidemia, diabetes, body mass index (BMI), alcohol consumption, and smoking habits were missing for 23, 372, 41, 1,205, 0, 0, 269, 13, 489, 107, and 118 subjects, respectively. Consequently, after excluding these subjects, 18,156 individuals (8,043 males [44%] and 10,113 females [56%]; average age: 57.2±16.1 years) were included in the analysis.
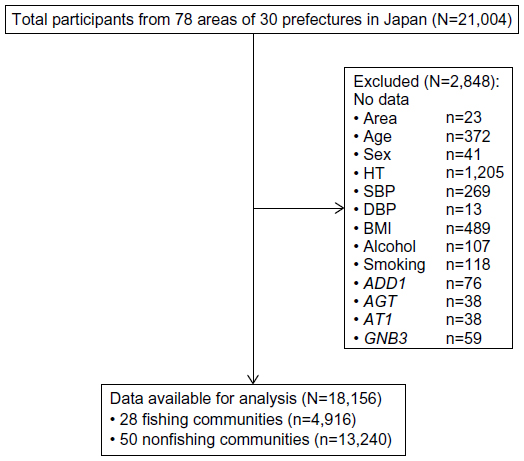 | Figure 1 Flow diagram of recruitment and available data. |
Definition of FCs and NFCs
Based on residence, the enrolled subjects were divided into two groups, namely FCs and NFCs. FCs were classified on the basis of 2004 government data24 and required that the community border the ocean and have a fishing port. All other areas that did not meet these criteria were classified as NFCs. Of the total 78 areas, 28 were classified as FCs and 50 as NFCs.
Measurements
Genotyping of single-nucleotide polymorphisms
Blood samples were collected from all subjects and genomic DNA was extracted from the buffy coats of centrifuged blood using the Puregene DNA purification kit (Gentra Systems, Inc., Minneapolis, MN, USA). The database single-nucleotide polymorphism identification numbers for the ADD1 (Gly460Trp), AGT (Gly6Ala), AT1 (Ala1166Cys), and GNB3 (Cys825Thr) polymorphisms were rs4961, rs5051, rs5186, and rs6489738, respectively. The TaqMan method was used for genotyping. Probes and primer mixtures were selected from the commercial database of the TaqMan probe system (myScience; Applied Biosystems, Foster City, CA, USA).25 Genomic DNA (5 ng) was added to the wells of a 384-well plate and air-dried for use as templates for the reaction. The polymerase chain reaction mixture contained 2.5 μL of probe mix and the same amount of Master Mix solution (Applied Biosystems). The standard thermocycle parameters provided by the manufacturer were used. An ABI 7900HT apparatus (Applied Biosystems) was used for reaction, genotype calling, and data exporting. The ADD1 T allele, AGT A allele, AT1 C allele, and GNB3 T allele were previously identified as candidate gene polymorphisms responsible for salt-sensitive HT.17,18,26
Physical examination and assessment of lifestyle
Well-trained public health nurses measured BP using a standard mercury sphygmomanometer on the right arm after at least a 5-minute resting period in the sitting position. Korotkoff’s first and fifth sounds were regarded as SBP and DBP, respectively. HT was defined as an SBP of ≥140 mmHg, DBP of ≥90 mmHg, or current use of antihypertensive medication. Hyperlipidemia and diabetes were defined as use of antihyperlipidemic and antidiabetic medication, respectively. Height and weight of the subjects were obtained from health checkup records or medical records. BMI was calculated as weight (kg)/height2 (m2).
Information regarding smoking habits and alcohol consumption was obtained through a self-reported questionnaire and then confirmed in an interview by nurses trained for the present study. Smoking habit was categorized as never-smoking, currently smoking, and ex-smoking, and alcohol consumption was categorized as nondrinking, sometimes drinking, and everyday drinking.
Statistical analysis
All statistical analyses were performed using Stata/SE 12.1 for Mac (Stata Corp LP, College Station, TX, USA). The probability (P) values, odds ratios (ORs), and 95% confidence intervals (CIs) were calculated when applicable. A P-value of >0.05 was considered statistically significant. Continuous variables (age, SBP, DBP, and BMI) are presented as means ± standard deviation, and categorical variables (sex, smoking habit, alcohol consumption, and allele and genotype of the polymorphism) as frequencies (%). The allele frequency was determined by direct counting. Correlations between FCs or NFCs and the other variables were identified using the unpaired t-test (continuous variables) or chi-square test (categorical variables). Multiple logistic regression analyses were performed for each genotype (ADD1, AGT, AT1, and GNB3) by adjusting for age and sex (Model 1) or by adjusting for age, sex, SBP, DBP, HT, BMI, smoking habit, and alcohol consumption (Model 2). GG/ADD1, GG/AGT, AA/AT1, and CC/GNB3 are references of genotype.
Ethics statement
The study protocol was approved by the Jichi Medical University Epidemiological and Ethical Committee.
Results
The basic characteristics of the subjects according to the area of residence are shown in Table 1. In comparison with residents from NFCs, those from FCs were, on average, older, had higher BP, and showed lower alcohol consumption. There were more female subjects and more subjects with a history of high BP. Table 2 shows the differences in genotype frequencies of salt-sensitive genes and the results of multivariate analyses performed to assess the relationships between the genotypes of salt-sensitive genes and area of residence (FCs vs NFCs) in Japan. There were significant differences in the AA and AG genotypes of AGT and the CC genotype of AT1 between the two areas. The OR of the AA genotype in AGT compared with the GG genotype was 0.79 (95% CI: 0.63–0.89, P=0.008) in Model 1 and 0.80 (95% CI: 0.68–0.95, P=0.001) in Model 2. The OR of the AG genotype in AGT compared with the genotype GG was 0.75 (95% CI: 0.63–0.89, P=0.001) in Model 1 and 0.76 (95% CI: 0.64–0.91, P=0.002) in Model 2. The OR of the CC genotype in AT1 compared with the AA genotype was 0.63 (95% CI: 0.40–0.98, P=0.04) in Model 1 and 0.63 (95% CI: 0.40–0.99, P=0.046) in Model 2. There were no significant differences in the frequencies of the ADD1 and GNB3 genotypes between the two communities.
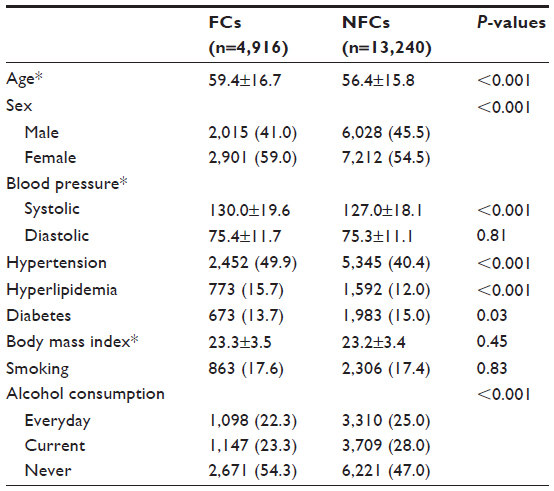 | Table 1 Basic characteristics of the subjects (N=18,156) |
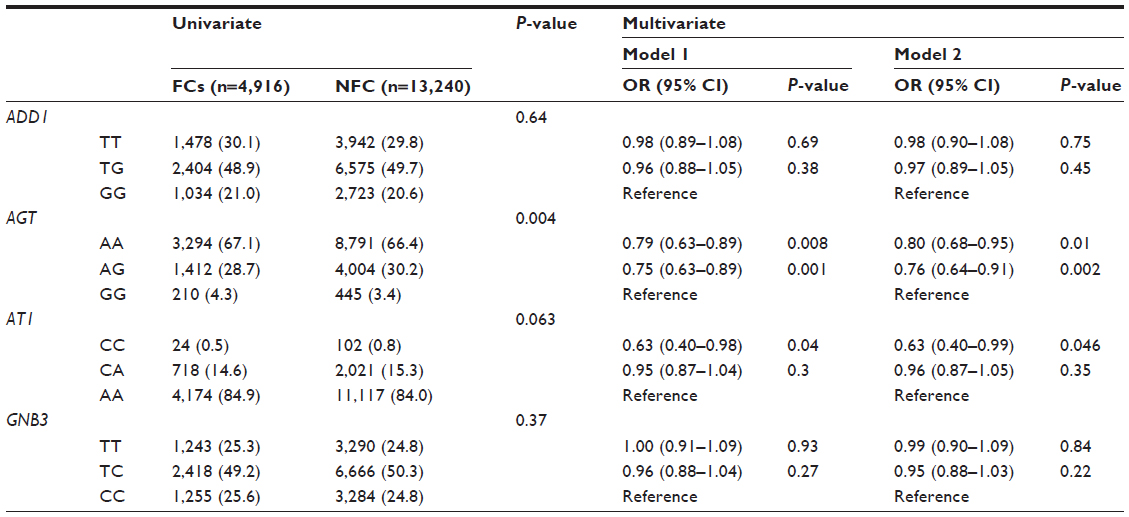 | Table 2 Results of univariate and multivariate analyses performed to identify associations between salt-sensitive genotypes and FCs versus NFCs in Japan |
Discussion
In the first study of this kind, a large-scale comparison of 21,004 subjects across 78 areas in Japan, divided according to residence into FCs and NFCs, was conducted to identify differences in the genotype frequencies of salt-sensitive genes. Significantly lower frequencies of the responsible genotypes AA/AG (AGT) and CC (AT1) were found in residents of FCs.
Both AGT and AT1 polymorphisms are significantly associated with essential HT susceptibility (AGT; AA vs GG: OR=2.52, 95% CI=1.68–3.78; AA vs GA: OR=2.26, 95% CI=1.48–3.45; AT1; (AC+CC) vs AA: OR1.41, 95% CI=1.19–1.66; (AA+AC) vs CC: OR=0.50, 95% CI=0.38–0.65).27,28 The pathophysiological mechanisms of these gene polymorphisms related to salt-sensitive essential HT are not completely understood. However, the renin–angiotensin system (RAS) has a pivotal role. A previous study showed that hypertensive patients with the A allele in AGT (Gly6Ala) may show altered cell function, specifically regulation of the AGT transcription level in AGT-producing tissues.29 Furthermore, AGT gene transcription may lead to increased plasma AGT levels. Salt-sensitive hypertensive patients tend to have low renin values.30 Moreover, the RAS response to high salt intake is blunted in salt-sensitive subjects and is inversely correlated with the BP response.30 Meanwhile, the AT1 (Ala1166Cys) polymorphism is in a noncoding region of AT1R gene, and therefore the amino acid sequence of the AT1 receptor is not altered. However, the AT1 polymorphism might affect messenger RNA stability and transcription, or alternatively be in linkage disequilibrium with other functional polymorphisms.31 Therefore, it is logical to suppose that salt-sensitive hypertensive patients may differ in genotypes encoding the different steps of the RAS cascade.
Subjects with salt-sensitive genes are suspected to be more susceptible to increases in BP when salt is consumed. It has been reported that Japanese patients, compared with Caucasians, have a higher incidence of polymorphisms in candidate genes.32 Genetic factors have been reported as a partial explanation for these regional differences.5–10 The results of the present study showed that, in addition to environmental factors, genetic factors should also be considered when identifying differences in the frequencies of HT. In addition, when performing population approaches such as the public health campaign for prevention of HT in each community, it is necessary to take into account the genetic factors as well as environmental factors.
The strength of the present study lies in the fact that samples were collected from a large national sample of the population and that precise measurements were conducted by a large organization. There were four main limitations to this study that should be addressed. First, only four genotypes were examined, and other genotypes also considered to influence salt sensitivity were not examined. Second, subjects with missing data were excluded from analysis. However, the excluded cases were not considered to have significant impact according to age or sex. Therefore, the excluded data is not considered to have a significant impact on the overall study results. Third, the amount of fish consumption was not measured in this study. Thus, it is unclear if the patients in FCs have higher rate of fish consumption compared to the patients in NFCs. This issue is study limitation and is necessary to be studied in the future. Fourth, the daily dietary sodium consumption might be one of the potential confounders of higher SBP in FCs group. However, the amount of daily dietary sodium consumption was not measured in this study. Therefore, this study could not discuss a role that AGT and AT1 polymorphisms would play in salt-sensitive HT.
Conclusion
In this study, the incidence of the salt-sensitive genotypes AGT and AT1 in residents of FCs were significantly lower than NFCs. Future studies evaluating the presence of salt-sensitive genes are required to examine the association between HT and area of residence in FCs.
Acknowledgments
We would like to express our deep appreciation to the Genome Banking Project Team of the 21st Century COE (Center of Excellence) Program at the Center for Community Medicine, Jichi Medical University.
Author contributions
MH, TT, and MO contributed to the conception, design, and acquisition of data; the analysis and interpretation of data; and the writing and revision of the manuscript. EK contributed to the conception and design and the writing and revision of the manuscript.
Disclosure
The authors report no conflicts of interest in this work.
References
Ezzati M, Lopez AD, Rodgers A, Vander Hoorn S, Murray CJ; Comparative Risk Assessment Collaborating Group. Selected major risk factors and global and regional burden of disease. Lancet. 2002;360:1347–1360. | |
Kearney PM, Whelton M, Reynolds K, Muntner P, Whelton PK, He J. Global burden of hypertension: analysis of worldwide data. Lancet. 2005;365:217–223. | |
Lopez AD, Mathers CD, Ezzati M, Jamison DT, Murray CJ. Global and regional burden of disease and risk factors, 2001: systematic analysis of population health data. Lancet. 2006;367:1747–1757. | |
Lawes CM, Vander Hoorn S, Rodgers A; International Society of Hypertension. Global burden of blood-pressure-related disease, 2001. Lancet. 2008;371:1513–1518. | |
Kiefe CI, Williams OD, Bild DE, Lewis CE, Hilner JE, Oberman A. Regional disparities in the incidence of elevated blood pressure among young adults: the CARDIA study. Circulation. 1997;96:1082–1088. | |
Ueshima H, Zhang XH, Choudhury SR. Epidemiology of hypertension in China and Japan. J Hum Hypertens. 2000;14:765–769. | |
Wolf-Maier K, Cooper RS, Banegas JR, et al. Hypertension prevalence and blood pressure levels in 6 European countries, Canada, and the United States. JAMA. 2003;289:2363–2369. | |
Zhao L, Stamler J, Yan LL, et al. Blood pressure differences between northern and southern Chinese: role of dietary factors: the International Study on Macronutrients and Blood Pressure. Hypertension. 2004;43:1332–1337. | |
Martiniuk AL, Lee CM, Lawes CM, et al. Hypertension: its prevalence and population-attributable fraction for mortality from cardiovascular disease in the Asia-Pacific region. J Hypertens. 2007;25:73–79. | |
Ueshima H, Sekikawa A, Miura K, et al. Cardiovascular disease and risk factors in Asia: a selected review. Circulation. 2008;118:2702–2709. | |
Hirai A, Terano T, Tamura Y, Yoshida S. Eicosapentaenoic acid and adult diseases in Japan: epidemiological and clinical aspects. J Intern Med Suppl. 1989;731:69–75. | |
Yamori Y, Nara Y, Iritani N, Workman RJ, Inagami T. Comparison of serum phospholipid fatty acids among fishing and farming Japanese populations and American inlanders. J Nutr Sci Vitaminol (Tokyo). 1985;31:417–422. | |
Yamada T, Malcom GT, Strong JP, et al. Difference in atherosclerosis between the populations of a fishing and a farming village in Japan. Ann N Y Acad Sci. 1997;811:412–419. | |
Yamada T, Strong JP, Ishii T, et al. Atherosclerosis and omega-3 fatty acids in the populations of a fishing village and a farming village in Japan. Atherosclerosis. 2000;153:469–481. | |
Yano Y, Hoshide S, Inokuchi T, et al. Regional differences in hypertensive cardiovascular remodeling between fishing and farming communities in Japan. Am J Hypertens. 2011;24:437–443. | |
Kato N. Genetic analysis in human hypertension. Hypertens Res. 2002;25:319–327. | |
Vicente G, Esteban P, Ernesto B, et al. Renin-angiotensin system genetic polymorphisms and salt sensitivity in essential hypertension. Hypertension. 2000;35:512–517. | |
Katsuya T, Ishikawa K, Sugimoto K, Rakugi H, Ogihara T. Salt sensitivity of Japanese from the viewpoint of gene polymorphism. Hypertens Res. 2003;26:521–525. | |
Manunta P, Burnier M, D’Amico M, et al. Adducin polymorphism affects renal proximal tubule reabsorption in hypertension. Hypertension. 1999;33:694–697. | |
Jeunemaitre X, Soubrier F, Kotelevtsev YV, et al. Molecular basis of human hypertension: role of angiotensinogen. Cell. 1992; 71:169–180. | |
Bonnardeaux A, Davies E, Jeunemaitre X, et al. Angiotensin II type 1 receptor gene polymorphisms in human essential hypertension. Hypertension. 1994;24:63–69. | |
Siffert W, Rosskopf D, Siffert G, et al. Association of a human G-protein beta3 subunit variant with hypertension. Nat Genet. 1998;18:45–48. | |
Kenzaka T, Okayama M, Fujiwara S, et al. Analysis of regional differences in the expression frequency of salt-sensitive genes in Japan. Exp Clin Cardiol. 2014;20:6523–6536. | |
Shichoson Jichi Kenkyukai (Study group of local autonomy), ed. Zenkoku Shichoson Yoran Heisei 16 Nemban (Directory of national local governments in 2004). Tokyo: Daiichihoki; 2004. | |
Billard A, Laval V, Fillinger S, et al. The allele-specific probe and primer amplification assay, a new real-time PCR method for fine quantification of single-nucleotide polymorphisms in pooled DNA. Appl Environ Microbiol. 2012;78:1063–1068. | |
Pereira TV, Nunes ACF, Rudnicki M, Yamada Y, Pereira AC, Krieger JE. Meta-analysis of the association of 4 angiotensinogen polymorphisms with essential hypertension: a role beyond M235T? Hypertension. 2008;51:778–783. | |
Yao R, Du YY, Zhang YZ, Chen QH, Zhao LS, Li L. Association between G-217A polymorphism in the AGT gene and essential hypertension: a meta-analysis. Genet Mol Res. 2015;14:5527–5534. | |
Liu DX, Zhang YQ, Hu B, Zhang J, Zhao Q. Association of AT1R polymorphism with hypertension risk: an update meta-analysis based on 28,952 subjects. J Renin Angiotensin Aldosterone Syst. 2015;16:898–909. | |
Dickson ME, Simmerman MB, Rahmouni K, Sigmund CD. The -20 and -217 promoter variants dominate differential angiotensinogen haplotype regulation in angiotensinogen-expressing cells. Hypertension. 2007;49:631–639. | |
Weinberger MH, Miller JZ, Luft FC, Grim CE, Fineberg NS. Definitions and characteristics of sodium sensitivity and blood pressure resistance. Hypertension. 1986;8(suppl II):II-127–II-134. | |
de la Sierra A, Lluch MM, Coca A, et al. Fluid, ionic and hormonal changes induced by high salt intake in salt-sensitive and salt-resistant hypertensive patients. Clin Sci (Lond). 1996;91:155–161. | |
Eisner GM. Hypertension: racial differences. Am J Kidney Dis. 1990; 16:35–40. |
 © 2016 The Author(s). This work is published and licensed by Dove Medical Press Limited. The full terms of this license are available at https://www.dovepress.com/terms.php and incorporate the Creative Commons Attribution - Non Commercial (unported, v3.0) License.
By accessing the work you hereby accept the Terms. Non-commercial uses of the work are permitted without any further permission from Dove Medical Press Limited, provided the work is properly attributed. For permission for commercial use of this work, please see paragraphs 4.2 and 5 of our Terms.
© 2016 The Author(s). This work is published and licensed by Dove Medical Press Limited. The full terms of this license are available at https://www.dovepress.com/terms.php and incorporate the Creative Commons Attribution - Non Commercial (unported, v3.0) License.
By accessing the work you hereby accept the Terms. Non-commercial uses of the work are permitted without any further permission from Dove Medical Press Limited, provided the work is properly attributed. For permission for commercial use of this work, please see paragraphs 4.2 and 5 of our Terms.