")
Back to Journals » Medical Devices: Evidence and Research » Volume 13
Difference in Pain and Discomfort of Comparable Wrist Movements Induced by Magnetic or Electrical Stimulation for Peripheral Nerves in the Dorsal Forearm
Authors Abe G, Oyama H , Liao Z, Honda K, Yashima K , Asao A, Izumi SI
Received 12 August 2020
Accepted for publication 29 October 2020
Published 18 December 2020 Volume 2020:13 Pages 439—447
DOI https://doi.org/10.2147/MDER.S271258
Checked for plagiarism Yes
Review by Single anonymous peer review
Peer reviewer comments 2
Editor who approved publication: Dr Scott Fraser
Genji Abe,1,2,* Hideki Oyama,3,* Zhenyi Liao,1 Keita Honda,1 Kenji Yashima,4 Akihiko Asao,5 Shin-Ichi Izumi1,3
1Department of Physical Medicine and Rehabilitation, Tohoku University Graduate School of Medicine, Sendai, Miyagi, Japan; 2Department of Rehabilitation, Faculty of Medical Science and Welfare, Tohoku Bunka Gakuen University, Sendai, Miyagi, Japan; 3Department of Physical Medicine and Rehabilitation, Graduate School of Biomedical Engineering, Tohoku University, Sendai, Miyagi, Japan; 4IFG Corporation, Sendai, Miyagi, Japan; 5Department of Occupational Therapy, Niigata University of Health and Welfare, Niigata, Japan
*These author contributed equally to this work
Correspondence: Genji Abe
Tohoku University Graduate School of Medicine, Sendai-shi, Miyagi, Japan
Tel +81-22-717-7338
Fax +81-22-717-7340
Email [email protected]
Purpose: Both repetitive peripheral magnetic stimulation (rPMS) and transcutaneous electrical current stimulation (TES) could elicit the limb movements; it is still unclear how subjective sensation is changed according to the amount of limb movements. We investigated the pain and discomfort induced by newly developed rPMS and TES of peripheral nerves in the dorsal forearm.
Methods: The subjects were 12 healthy adults. The stimulus site was the right dorsal forearm; thus, when stimulated, wrist dorsiflexion was induced. The rPMS was delivered by the new stimulator, Pathleader at 10 stimulus intensity levels, and TES intensity was in 1-mA increments. The duration of each stimulation was 2 s. The analysis parameters were subjective pain and discomfort, measured by a numerical rating scale. The rating scale at corresponding levels of integrated range of movement (iROM) induced by rPMS or TES was compared. The subjective values were analyzed by two-way repeated measures ANOVA with the stimulus conditions (rPMS, TES) and the seven levels of iROM (20– 140 ºs).
Results: In the rPMS experiments, stimuli were administered to all subjects at all stimulus intensities. In the TES experiments, none of the subjects dropped out between 1 and 16 mA, but there were dropouts at each of the intensities as follows: 1 subject at 17 mA, 20 mA, 22 mA, 23 mA, 27 mA, 29 mA and 2 subjects at 21 mA, 24 mA, 26 mA. The main effects of the stimulus conditions and iROM were significant for pain and discomfort. Post hoc analysis demonstrated that pain and discomfort in rPMS were significantly lower compared to TES when the iROM was above 60 ºs and 80 ºs, respectively.
Conclusion: New rPMS stimulator, Pathleader, caused less pain and discomfort than TES, but this was only evident when comparatively large joint movements occurred.
Keywords: peripheral magnetic stimulation, peripheral electrical stimulation, pain, discomfort, integrated range of wrist movement
Introduction
Transcutaneous electrical current stimulation (TES) of peripheral nerves is widely used in rehabilitation medicine. Its objective is to restore motor function in patients with central nervous system diseases or orthopedic disorders.1–4 When TES is used to restore finger motor function in stroke patients, it is usually administered on the dorsal side of the forearm. This is because wrist and finger extension movements are often more difficult to reacquire compared to flexion movements after a stroke. However, a problem with TES is that a strong stimulus is required to induce joint movement by contracting the paralyzed muscles, thus making it a painful process.5
Repetitive peripheral magnetic stimulation (rPMS) is a non-invasive, nearly painless, clinically promising method of bringing about neural modifications.6–10 The difference between the amount of pain caused by rPMS and that caused by TES can be explained by understanding that the Aδ and C nociceptive fibers that run through the superficial layers have fine axons with higher excitation thresholds. In contrast, α motor neuron axons run at a deeper level, are thicker, and have a low excitation threshold.11,12 To excite deeply located α motor neuron axons with TES requires a strong electric current that is more likely to excite superficial nociceptive neurons and result in pain. In rPMS, motor axons are stimulated by pulsed currents that cancel out the magnetic field by repeatedly passing a transient electric current through a stimulus coil. Because the magnetic flux density is not affected by skin resistance, the induced current is able to stimulate motor axons in the deep tissues. These neurons have low excitation thresholds and do not excite nociceptive neurons in the superficial layer and therefore it is less painful.
Although previous literature reported that rPMS produced less pain compared to TES, quantitative studies that compared pain induced by magnetic versus electric stimulation are limited.6,8–10,13–15 Han et al reported that when rPMS or TES was administered to the anterior surface of the distal thigh, rPMS was significantly less painful than TES at the same amount of knee extension torque.10 Ito et al compared hip flexion torque when rPMS and TES were administered to the anterior surface of the hip. The stimulation intensities were adjusted to the maximal tolerance of each participant. They found that hip flexion torque was significantly greater for rPMS than for TES.9 Thus, rPMS produced less pain at a given level of stimulus-induced muscle contraction and a greater joint torque at the intensity of maximum tolerance.
No study has compared pain between magnetic and electrical stimuli over a wide range of stimulation intensities except Szecsi’s study. This study demonstrated the relationship between knee extension torque and pain when applying magnetic and electrical stimulation over the quadriceps muscle in subjects with paresis and preserved sensation. Szecsi et al established that pain reached maximum tolerance earlier for electrical stimulation than for magnetic stimulation using a saddle-shaped coil with increasing torque. Stimulus intensities were increased from zero to the maximum tolerable level.15
Pain induced by magnetic stimulation can be affected by the coil shape and the stimulation site. Mori et al developed a compact U-shaped coil for contracting suprahyoid muscles in order to reduce stimulation of the inferior alveolar nerve, which can be excited using the usual round coil.16 Kagaya et al revealed this U-shaped coil could induce hyoid bone movement with minimal pain. It is essential to examine the pain-stimulus intensity relationship for both individual target body sites and the type of device used when applying rPMS.17 The purpose of the present study was to investigate the relationship between rPMS-induced movement and pain when stimulating the dorsal forearm using a newly developed magnetic stimulator and a conventional electrical stimulator. In addition, we evaluated discomfort as secondary outcome. Our working hypothesis was that magnetic stimulation might excite motor axons with low excitation thresholds in the deep tissue while generating only limited excitation of nociceptive neurons in the superficial layers. Thus, rPMS should result in less pain and discomfort than TES for the same amount of induced movement.
Materials and Methods
Subjects
The subjects were 12 healthy adults with no neurological abnormalities of the arms. The group was comprised of 7 men and 5 women with a mean age of 23.0 ± 5.0 years (all data are presented as means ± standard deviations). All subjects were right-handed according to the Edinburgh inventory of handedness18 (mean score 92.86 ± 10.57).
Measurement Procedures
Stimulus Devices
Two types of stimulus devices were used. Magnetic stimuli were administered using a peripheral magnetic stimulator (Pathleader, IFG, Sendai, Japan). The main unit measures 340 mm wide × 265 mm deep × 175 mm high, it weighs approximately 15 kg, and the coil weighs 1.5 kg. The coil is a circular coil with a magnetic core and the outer-diameter is 70 mm. This is different from the one used in previous studies (diameter 160 mm, round coil in Han’s study;10 outer diameter 130 mm, annular round coil in Szecsi’s study;15 diameter 200 mm, round coil in Matsumoto’s study19). The stimulus intensity (with maximum stimulus intensity defined as 100%) was adjusted by changing the charging voltage applied to the condenser (Figure 1 left). Our previous study has confirmed the linear relationship between stimulus intensity and pulsed magnetic field intensity adjacent to the coil, what stimulus frequency can be adjusted in 2.5 Hz increments to any value within the range of 10–50 Hz.20–22
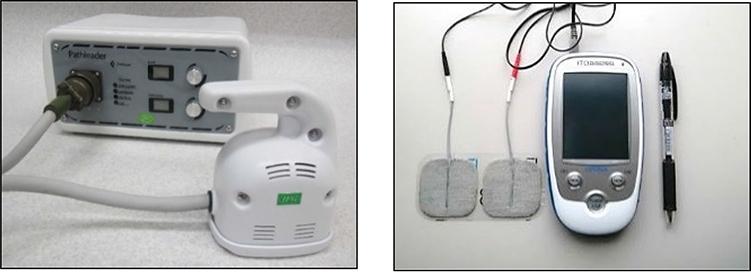 |
Figure 1 Stimulus instruments. Abbreviations: rPMS, repetitive peripheral magnetic stimulation; TES, transcutaneous electrical current stimulation. Notes: Left is rPMS and right is TES. Both instruments were portable and easy to use. |
Electrical stimulation was delivered using a transcutaneous electrical current stimulator (Espurge, Ito CO., Ltd, Saitama, Japan) and a 50 × 50 mm electrode band (PALS Platinum, Axelgaard Manufacturing, Fallbrook, CA, USA). The main unit measured 151 mm high × 84 mm wide × 23.5 mm deep and weighed approximately 230 g. The maximum output current was 31 mA ± 20% (effective value), maximum output voltage was 40 V ± 20% (peak value, 500-Ω load), and maximum output frequency was 400 Hz ± 10% (Figure 1 right).
Parameters Measured
The main parameters measured were the angle of wrist movement and subjective pain and discomfort. The angle of wrist movement was measured using an electrogoniometer (SG65, Biometrics Ltd, UK) at a sampling frequency of 100 Hz. This was converted to digital data using the PowerLab 16/35 (AD Instruments, Inc., Charlotte, NC, USA), and recorded on a personal computer. Lab Chart 7 software (AD Instruments, Inc.) was used for the data collection and analysis. The electrogoniometer was attached along the line of the second metacarpal bone from the distal radius. The output signals from both stimulus devices were imported into the PowerLab and synchronized with the electrogoniometer to identify the trigger outputs.
Subjective pain and discomfort were measured by using an 11-point numerical rating scale (NRS), which is a standard measuring method.23 We selected NRS as it could be answered verbally, instead of a visual analog scale (VAS), because it was assumed the subjects could not use their dominant hands when performing the test.
Pain was scored from 0 (no pain) to 10 (unbearable pain). Discomfort was scored from 0 (no discomfort) to 10 (unbearable discomfort). The investigator asked the subjects about their pain and discomfort levels and recorded them on the record sheet.
Experimental Conditions
The stimulus intensity was adjusted under the experimental conditions shown in Table 1. For rPMS, the stimulus intensity was adjusted on the Pathleader to 10 different levels, ranging from 10% to 100% in 10% increments. The Espurge was used for TES. Following preliminary screening, the maximum stimulus intensity was set at either (1) 1 mA below the intensity reported by the participant to cause unbearable pain or discomfort, or (2) 3 mA higher than the stimulus intensity that triggered an electrical current-induced wrist movement equivalent to the angle of the maximum possible voluntary movement. The stimulus intensity was then adjusted between the minimum and maximum values in 1 mA increments.
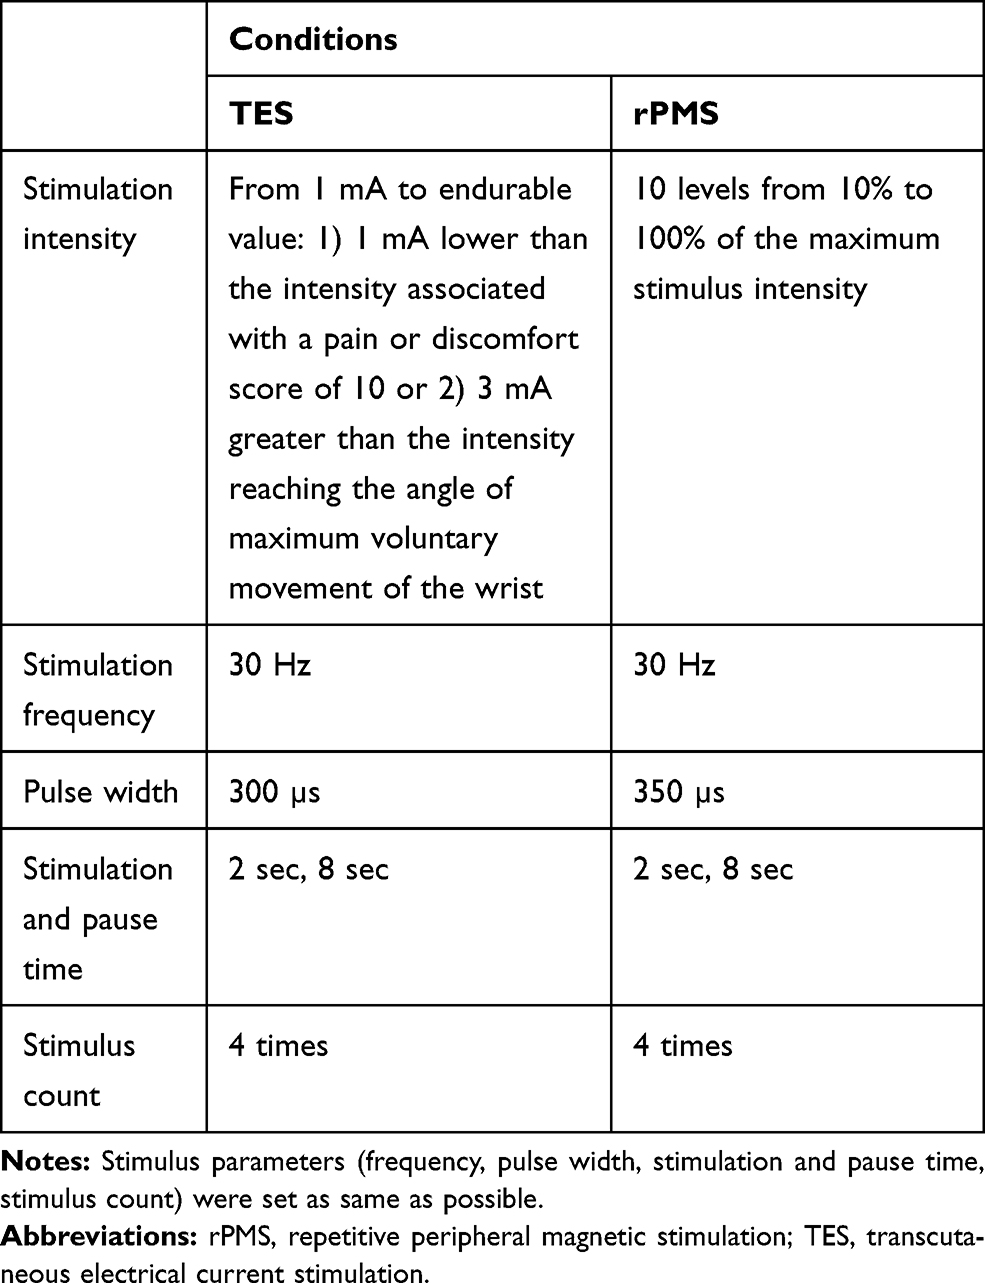 |
Table 1 Experimental Conditions |
As for the stimulus placement of TES, the anode and cathode electrodes were placed side-by-side in parallel with the extensor carpi radialis (ECR) muscle fibers over the ECR muscle belly.
For both devices, the stimulus frequency was set at 30 Hz.20,24 The stimuli were administered a total of 4 times at each intensity for a duration of 2 s each, with intervening 8 s breaks. Although the nature of the devices did not permit the use of an identical pulse width, the pulse widths were set as close to equivalent as possible, 350 µs for rPMS and 300 µs for TES.
Stimulation Site
The stimuli were administered to the ECR muscle in the right dorsal forearm. For rPMS, the Pathleader coil was placed on the right dorsal forearm with visual monitoring of the wrist movements during stimulation. The coil’s position was adjusted by moving it to a site where a lower-intensity stimulus induced a larger wrist extension movement. For the TES, the electrode band was attached to the right dorsal forearm and its position was adjusted using the same procedure as that used for the rPMS.
Experimental Procedure
Subjects were seated in a comfortable chair with the forearm in pronation and the wrist extended from the edge of the table in order to allow for a wide range of wrist extension. All subjects underwent both types of stimulation on the same day. They sat stationary in a chair with their shoulders and elbows slightly flexed and the forearms pronated. The right forearm was placed on a table so that the hand distal to the wrist projected beyond the edge of the table and was allowed to drop. Because the wrist angle changed, if the forearm was moved backward or forward, indicator stickers were placed on the table. The forearm and wrist positions were matched before each stimulus to ensure that the forearm was consistently in the same position. An electrogoniometer was attached to the subject’s right wrist before the start of the experiment. The voltages during maximum voluntary extension and flexion of the wrist were recorded. These goniometer voltages were converted to angles based on measurements using an analog goniometer and angle corrections were performed. The angles of maximum voluntary extension and flexion of the wrist were recorded.
For the rPMS, the stimuli were administered at 10–100% of the maximum stimulus intensity and wrist angles were measured. Subjects were asked about their pain and discomfort after administration of the stimulus.
For the TES, after a preliminary investigation of the maximum intensity of electrical stimulation, stimuli were administered at levels ranging from 1 mA to the maximum tolerable stimulus intensity and wrist angles were measured. Subjects were asked about their pain and discomfort after administration of the stimuli.
To prevent an order effect, stimuli were administered in the following order: rPMS → TES in 6 subjects and TES → rPMS in the other 6. Subjects were given a 10-min break between the two procedures to recover from fatigue. The order of stimulus intensities was randomized using a random number table. A break of approximately 1 min was provided between the different stimulus intensities to allow the subjects to relax their wrists and ensure that the starting angles were consistent.
Analysis Methods
Because rPMS and TES are based on different design principles, it was not possible to ensure that the stimulus conditions in this study were completely consistent. We attempted to compare the two types of stimuli by analyzing a kinematic parameter induced by both devices. The procedures used were as follows:
Figure 2 shows the definitions of the parameters analyzed. The period between the start (0 sec) and end (2 sec) of the stimulus was defined as the analysis section (AS). The integrated value of the angle data during the AS was defined as the integrated range of movement (iROM).
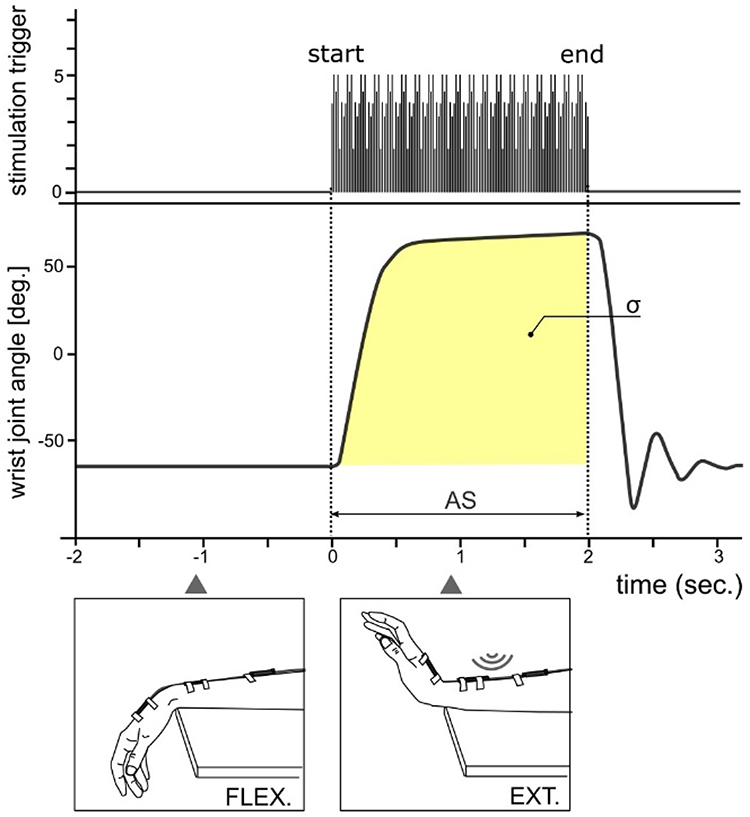 |
Figure 2 Definitions of the analytical parameters. Abbreviations: AS, analysis section from 0 to 2 seconds; σ, integral value of wrist joint angle during; deg, degree. |
A nonlinear regression analysis of stimulus intensity and the iROM was carried out using a sigmoid function. In this study, we used the Rodbard function to express the four-parameter general form of a logistic function or sigmoidal curve.25
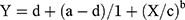
In this formula, Y represents the iROM and X represents the stimulus intensity. Regression formulae were produced with the constants a, b, c, and d calculated for each individual subject. The coefficient of determination for each subject was also calculated to assess the accuracy of fit between the measured and predicted values of iROM.
The range of iROM values collected from all subjects were examined and the values were divided into seven categories in 20ºs increments from 20ºs to 140ºs. The different categories of iROM (20ºs, 40ºs, 60ºs, 80ºs, 100ºs, 120ºs, and 140ºs) were then substituted into the regression formula and the stimulus intensity X was inversely estimated. These nonlinear regression analyses were carried out using Image J ver.1.51 software (NIH, Atlanta, GA, USA).
The actual measured values that most closely approximated stimulus intensity X (one of 10%, 20%, 30%, … 100% for magnetic stimuli, and one of 1 mA, 2 mA, 3 mA, … for electrical stimuli) were examined. The subjective assessments (pain or discomfort) corresponding to these values were selected.
Statistical Analysis
In the statistical analyses, the subjective evaluations of pain and discomfort were analyzed in a two-factor repeated measures analysis of variance (ANOVA) with the two stimulus devices (rPMS, TES) and seven levels of iROM (20ºs, 40ºs, 60ºs, 80ºs, 100ºs, 120ºs, and 140ºs) as factors. If a main effect was found, Bonferroni correction was used in a post hoc test. Statistical analysis was carried out using SPSS for Windows ver. 23 (IBM Corp., Armonk, NY, USA), with p < 0.05 regarded as significant.
Ethical Considerations
This study was approved by the Tohoku University Hospital Clinical Research Ethics Committee (approval number: 2017-2-113-1) and was conducted in compliance with the ethical standards of the Helsinki Declaration. Written informed consent was obtained from all subjects after a full written and oral explanation of the purpose and methods of the study was provided. Also, this trial was registered at the UMIN Clinical Trials Registry as UMIN000022632 [http://www.umin.ac.jp/ct-r/index.htm]
Results
Stimulus Intensity and iROM in rPMS and TES Modalities
There were no adverse events during or after the experiments. In the rPMS experiments, stimuli were administered to all subjects at all stimulus intensities. In the TES experiments, none of the subjects dropped out between 1–16 mA, but there were dropouts at each of the intensities as follows: 1 at 17 mA, 1 at 20 mA, 2 at 21 mA, 1 at 22 mA, 1 at 23 mA, 2 at 24 mA, 2 at 26 mA, 1 at 27 mA, and 1 at 29 mA.
Figure 3A and B shows an example of a subject’s regression curve using the sigmoid function in rPMS and TES, respectively. The other results are shown in Appendix Figure 1. As for the regression curve for the sigmoid function related to stimulus intensity and wrist iROM, the mean values (ranges) of the coefficients of determination for the observed and predicted values of iROM were R2 = 0.988 (0.916–0.999) for rPMS and R2 = 0.980 (0.911–0.999) for TES. The actual stimulus intensities closest to the stimulus intensities that were inversely estimated from the iROM values according to the regression formula are shown in Appendix Table 1.
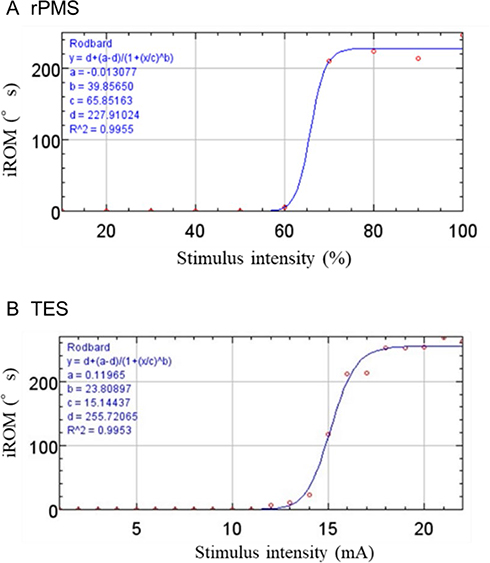 |
Figure 3 An example of a subject’s regression curve using the sigmoid function. Abbreviations: rPMS, repetitive peripheral magnetic stimulation; TES, transcutaneous electrical current stimulation; iROM (°s), integrated range of movement (degree multiplied by second). Notes: (A) is rPMS and (B) is TES. X-axis shows stimulus intensity, which the unit of rPMS is “%” and it of TES is “mA”. Y-axis shows iROM, which the units are “°s”. Both rPMS and TES condition, stimulus intensity and iROM were strongly correlated using by regression curve of sigmoid function. |
Pain
The ANOVA results for pain revealed significant main effects with respect to both the types of stimulus devices and the iROM (stimulus device: F 1, 11 = 8.261, p = 0.015; iROM: F 6, 66 = 5.459, p < 0.001). No interactions were observed (F 6, 154 = 0.345, p = 0.911). Post hoc test revealed significant differences between the stimulus devices when the iROM were at 80ºs, 100ºs, 120ºs, or 140ºs (80ºs: p = 0.007; 100ºs: p = 0.009; 120ºs: p = 0.001; 140ºs: p = 0.028). The pain was significantly lower during rPMS compared to TES at these levels of iROM. While the pain at 140ºs was significantly greater than it at 20ºs (p = 0.044) in the TES, the pain was not significantly different between any pair of iROM levels in rPMS (Figure 4).
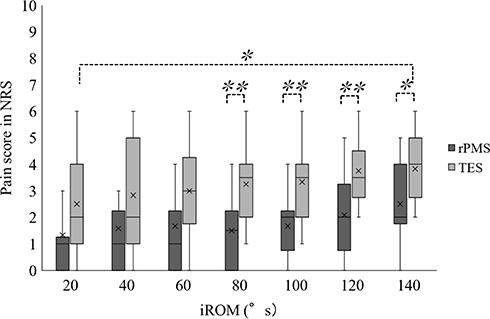 |
Figure 4 Pain caused by the differences in the integral value of the wrist movements and the stimulus conditions. Abbreviations: NRS, numerical rating scale; iROM (°s), integrated range of movement (degree multiplied by second); rPMS, repetitive peripheral magnetic stimulation; TES, transcutaneous electrical current stimulation. Notes: The two-factor repeated measures analysis of variance (ANOVA) revealed significant main effects with respect to both the types of stimulus devices and the iROM. ×, mean value; -, median value; *p < 0.05; **p < 0.01. |
Discomfort
The results regarding discomfort revealed significant main effects in both the type of stimulus device and iROM (stimulus device: F 1, 11 = 7.051, p = 0.022; iROM: F 6, 66 = 4.668, p = 0.001). No interactions were observed (F 14, 154 = 0.856, p = 0.532). A post hoc test revealed significant differences between rPMS and TES when the iROM were 60ºs, 80ºs, 100ºs, 120ºs, or 140ºs (60ºs: p = 0.046; 80ºs: p = 0.013; 100ºs: p = 0.006; 120ºs: p = 0.004; 140ºs: p = 0.035). The discomfort was lower with rPMS compared to TES at these levels of iROM. However, there was no significant difference among different levels of iROM for the two stimulus conditions (Figure 5).
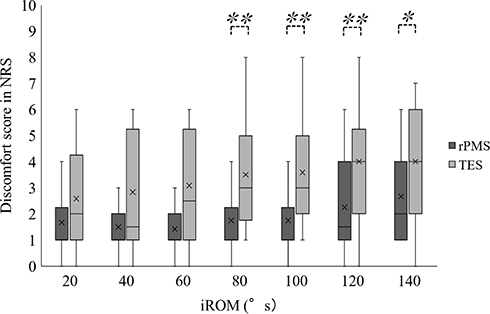 |
Figure 5 Discomfort caused by the differences in the integral value of the wrist movements and the stimulus conditions. Abbreviations: NRS, numerical rating scale; iROM (°s), integrated range of movement (degree multiplied by second); rPMS, repetitive peripheral magnetic stimulation; TES, transcutaneous electrical current stimulation. Notes: The two-factor repeated measures analysis of variance (ANOVA) revealed significant main effects with respect to both the types of stimulus devices and the iROM. ×, mean value; -, median value; *p < 0.05; **p < 0.01. |
Discussion
In this study, we applied rPMS and TES under a wide range of stimulus intensities on peripheral nerves in the dorsal forearm. We investigated the resulting changes in wrist iROM and the resulting pain and discomfort. We compared subjective pain and discomfort using an NRS at the corresponding iROM induced by the individual stimulation modalities. Although previous studies compared pain between rPMS and TES at a given amount of knee extension10,15 and hip flexion torque,9 there is no comparative study of pain induced by rPMS and TES under a wide range of stimulus intensity except for Szecsi’s study. Furthermore, there is no paper comparing pain or discomfort in the upper limbs.
Pain
The pain was overall low (1.76 ±1.63) in rPMS, which was not significantly different between each level of iROM. The pain was significantly lower in rPMS compared to TES when the iROM was from 80ºs to 140º s. This is a similar result that was found in previous studies that reported less pain with rPMS.9,10,15 Our results demonstrated that rPMS induced less pain compared to TES when the value of iROM was relatively large (80ºs to 140ºs). In addition to the reasons mentioned in introduction section, this may have reflected a difference in the motor units recruited, which derives from variations in the two stimulation modalities, ie, differences in the characteristics of induced-electrical current by rPMS and the electric current generated by TES. For TES, wrist dorsiflexion movements may be generated by mobilizing the motor units of the ECR or extensor carpi ulnaris (ECU) which are superficially located on the surface. In addition to mobilizing ECR and ECU muscles, more deeply located muscles such as extensor indicis would be also mobilized in rPMS. Thus, TES induces intense muscle contractions due to a summation of the electrical stimulus. This may have induced painful wrist movements.
Discomfort
The discomfort was also low overall (1.86 ±1.57) with rPMS and was not significantly different between each level of iROM. The discomfort was significantly lower in rPMS compared to TES when the iROM ranged from 60ºs to 140ºs. These results suggest that rPMS can induce a relatively large joint movement while minimizing discomfort.
We measured the subjective discomfort and pain separately, because subjective sensation was evaluated by discomfort as well as pain in Han’s study.10 Moreover, Takahashi’s study suggested that the dull sensation, which is characteristic of muscular pain, is related to processing of emotion-related brain region by fMRI study.26 Considering previous studies and our findings, discomfort does not represent the same perception as pain, however may be an emotional response related to muscular pain.
The present findings support the working hypothesis that rPMS would result in less pain and discomfort than TES at the same level of induced movement.
Limitation
This study had limitations. First, our findings are limited to experimental conditions. rPMS may induce movements with pain and discomfort at strong stimulus intensities, when iROM is above 140ºs, because of no interaction between the stimulus device and iROM. Second, we were unable to administer rPMS and TES stimuli at exactly the same site. The stimulation site was determined to be the site where a weaker stimulus induced a larger wrist dorsiflexion movement. However, this could have been a result of the investigator’s observations and technique. In particular, the setting of rPMS may have affected the induced movements with even a slight repositioning of the coil or a slightly different tilt angle. Furthermore, the forearm contains several wrist extensor muscles that are in close proximity to each other. The thickness of fat and other subcutaneous tissue is inconsistent. As such, it is debatable whether the stimulation site used in this study was the most appropriate location for inducing wrist dorsiflexion movements. Because of the difficulty of directly observing the nature of subcutaneous tissue and its response to stimulation, future measurements will require optimization of the coil position and its angle of inclination by using markers to identify stimulation site categories, and by using a clinometer. Third, subjective evaluations could be affected by the subject’s expectations. The physiological mechanism of both stimulus devices was not explained to the subjects in advance to reduce preconception. However, there are possibilities that preparations affected subjective evaluations, such as attaching electrode pads before electrical stimulation.
Conclusion
rPMS of peripheral nerves in the forearm resulted in less pain and discomfort than TES. However, the difference between the amount of pain and discomfort induced by rPMS and that of TES was only significant when joint movements were comparatively large. When the stimulated joint movements were small, there was no significant difference between the two methods.
Data Sharing Statement
The data that support the findings of this study are available from the corresponding author, GA, upon reasonable request.
Acknowledgments
We would like to thank Editage (www.editage.jp) for English language editing.
Author Contributions
GA, HO, ZL and AA conceived the study. GA, HO, ZL, KH, and KY performed the experiments and collected and analyzed the data. GA, HO, KH and KY established the instrumental settings. GA, HO and SI wrote the manuscript. All authors made a significant contribution to the work reported, whether that is in the conception, study design, execution, acquisition of data, analysis and interpretation, or in all these areas; took part in drafting, revising or critically reviewing the article; gave final approval of the version to be published; have agreed on the journal to which the article has been submitted; and agree to be accountable for all aspects of the work.
Funding
This work was partially supported by the JSPS KAKENHI, Grant-in-Aid for Scientific Research on Innovative Areas “Understanding brain plasticity on body representations to promote their adaptive functions” (Grant Number C01-1: 26120007). This study was also supported in part by a research grant from The General Insurance Association of Japan, and by Regional Innovation Strategy Support Program Initiated by MEXT (Support for Recovery and Reconstruction from the Great East Japan Earthquake).
Disclosure
Kenji Yashima is an employee of IFG Corporation. Shin-Ichi Izumi owns shares/stock of IFG Corporation, Ltd. and reports a patent issued: MEDICAL SUCCESSIVE MAGNETIC PULSE GENERATION DEVICE (US 10,173,071 B2). IFG Corporation developed the repetitive peripheral magnetic stimulation which is used in our study. The authors report no other potential conflicts of interest for this work.
References
1. Bistolfi A, Zanovello J, Ferracini R, et al. Evaluation of the effectiveness of neuromuscular electrical stimulation after total knee arthroplasty: a meta-analysis. Am J Phys Med Rehabil. 2018;97:123–130. doi:10.1097/PHM.0000000000000847
2. Kwong PW, Ng GY, Chung RC, Ng SS. Transcutaneous electrical nerve stimulation improves walking capacity and reduces spasticity in stroke survivors: a systematic review and meta-analysis. Clin Rehabil. 2018;32:1203–1219. doi:10.1177/0269215517745349
3. Jung K, Jung J, In T, Kim T, Cho HY. The influence of task-related training combined with transcutaneous electrical nerve stimulation on paretic upper limb muscle activation in patients with chronic stroke. NeuroRehabilitation. 2017;40:315–323. doi:10.3233/NRE-161419
4. Tu-Chan AP, Natraj N, Godlove J, Abrams G, Ganguly K. Effects of somatosensory electrical stimulation on motor function and cortical oscillations. J Neuroeng Rehabil. 2017;14:113. doi:10.1186/s12984-017-0323-1
5. Chae J, Bethoux F, Bohine T, Dobos L, Davis T, Friedl A. Neuromuscular stimulation for upper extremity motor and functional recovery in acute hemiplegia. Stroke. 1998;29:975–979. doi:10.1161/01.STR.29.5.975
6. Beaulieu LD, Massé-Alarie H, Camiré-Bernier S, Ribot-Ciscar É, Schneider C. After-effects of peripheral neurostimulation on brain plasticity and ankle function in chronic stroke: the role of afferents recruited. Clin Neurophysiol. 2017;47:275–291. doi:10.1016/j.neucli.2017.02.003
7. Krewer C, Hartl S, Müller F, Koenig E. Effects of repetitive peripheral magnetic stimulation on upper-limb spasticity and impairment in patients with spastic hemiparesis: a randomized, double-blind, sham-controlled study. Arch Phys Med Rehabil. 2014;95:1039–1047. doi:10.1016/j.apmr.2014.02.003
8. Beaulieu LD, Schneider C. Effects of repetitive peripheral magnetic stimulation on normal or impaired motor control. A review. Neurophysiol Clin. 2013;43:251–260. doi:10.1016/j.neucli.2013.05.003
9. Ito T, Tsubahara A, Watanabe S. Use of electrical or magnetic stimulation for generating hip flexion torque. Am J Phys Med Rehabil. 2013;92:755–761. doi:10.1097/PHM.0b013e318282c643
10. Han TR, Shin HI, Kim IS. Magnetic stimulation of the quadriceps femoris muscle: comparison of pain with electrical stimulation. Am J Phys Med Rehabil. 2006;85:593. doi:10.1097/01.phm.0000223239.93539.fe
11. Kandel ER. Principles of Neural Science.
12. Manzano GM, Giuliano LM, Nóbrega JA. A brief historical note on the classification of nerve fibers. Arq Neuropsiquiatr. 2008;66:117–119. doi:10.1590/S0004-282X2008000100033
13. Bachasson D, Temesi J, Bankole C, et al. Assessment of quadriceps strength, endurance and fatigue in FSHD and CMT: benefits and limits of femoral nerve magnetic stimulation. Clin Neurophysiol. 2014;125:396–405. doi:10.1016/j.clinph.2013.08.001
14. Szecsi J, Straube A, Fornusek C. Comparison of the pedalling performance induced by magnetic and electrical stimulation cycle ergometry in able-bodied subjects. Med Eng Phys. 2014;36:484–489. doi:10.1016/j.medengphy.2013.09.010
15. Szecsi J, Götz S, Pöllmann W, Straube A. Force-pain relationship in functional magnetic and electrical stimulation of subjects with paresis and preserved sensation. Clin Neurophysiol. 2010;121:1589–1597. doi:10.1016/j.clinph.2010.03.023
16. Mori H, Yashima K, Hiroyuki K, Izumi S, Takagi T. Trial manufacture of magnetic stimulation coil to induce the contraction of suprahyoid muscles. Biomechanisms. 2018;24:79–88. (in Japanese). doi:10.3951/biomechanisms.24.79
17. Kagaya H, Ogawa M, Mori S, et al. Hyoid bone movement at rest by peripheral magnetic stimulation of suprahyoid muscles in normal individuals. Neuromodulation. 2019;22:593–596. doi:10.1111/ner.12777
18. Oldfield RC. The assessment and analysis of handedness: the Edinburgh inventory. Neuropsychologia. 1971;9:97–113. doi:10.1016/0028-3932(71)90067-4
19. Matsumoto H, Hanajima R, Terao Y, Ugawa Y. Magnetic-motor-root stimulation: review. Clin Neurophysiol. 2013;124(6):1055–1067. doi:10.1016/j.clinph.2012.12.049
20. Yashima K, Takagi T, Izumi S, et al. Dorsiflexion movement of the wrist by magnetic stimulation. J Soc Biomech. 2016;40:103–109. (in Japanese). doi:10.3951/sobim.40.2_103
21. Izumi S, Oouchida Y, Okita T, et al. Development of an integration circuit to measure pulsed magnetic field. JJCRS. 2012;3:42–50.
22. Izumi S, Takagi T, Nagatomi R, Nakazato N, Yashima Y, Abe T. Fabrication of multi-coil system for deep brain transcranial magnetic stimulation. Jpn J Clin Neurophysio. 2009;27:1–9. (in Japanese).
23. Ferreira-Valente MA, Pais-Ribeiro JL, Jensen MP. Validity of four pain intensity rating scales. Pain. 2011;152:2399–2404. doi:10.1016/j.pain.2011.07.005
24. Chuang LL, Chen YL, Chen CC, et al. Effect of EMG-triggered neuromuscular electrical stimulation with bilateral arm training on hemiplegic shoulder pain and arm function after stroke: a randomized controlled trial. J Neuroeng Rehabil. 2017;14(1):122. doi:10.1186/s12984-017-0332-0
25. DeLean A, Munson PJ, Rodbard D. Simultaneous analysis of families of sigmoidal curves: application to bioassay, radioligand assay, and physiological dose-response curves. Am J Physiol. 1978;235:E97–E102.
26. Takahashi K, Taguchi T, Tanaka S, et al. Painful muscle stimulation preferentially activates emotion-related brain regions compared to painful skin stimulation. Neurosci Res (N Y). 2011;70:285–293. doi:10.1016/j.neures.2011.04.001
 © 2020 The Author(s). This work is published and licensed by Dove Medical Press Limited. The full terms of this license are available at https://www.dovepress.com/terms.php and incorporate the Creative Commons Attribution - Non Commercial (unported, v3.0) License.
By accessing the work you hereby accept the Terms. Non-commercial uses of the work are permitted without any further permission from Dove Medical Press Limited, provided the work is properly attributed. For permission for commercial use of this work, please see paragraphs 4.2 and 5 of our Terms.
© 2020 The Author(s). This work is published and licensed by Dove Medical Press Limited. The full terms of this license are available at https://www.dovepress.com/terms.php and incorporate the Creative Commons Attribution - Non Commercial (unported, v3.0) License.
By accessing the work you hereby accept the Terms. Non-commercial uses of the work are permitted without any further permission from Dove Medical Press Limited, provided the work is properly attributed. For permission for commercial use of this work, please see paragraphs 4.2 and 5 of our Terms.