")
Back to Journals » Diabetes, Metabolic Syndrome and Obesity » Volume 11
Diets high in vegetables, fruits, cereals, and tubers as a protective factor for metabolic syndrome in bank employees
Authors Cattafesta M , Salaroli LB
Received 21 August 2018
Accepted for publication 11 October 2018
Published 21 November 2018 Volume 2018:11 Pages 781—790
DOI https://doi.org/10.2147/DMSO.S184716
Checked for plagiarism Yes
Review by Single anonymous peer review
Peer reviewer comments 2
Editor who approved publication: Dr Steven F. Abcouwer
Monica Cattafesta,1 Luciane Bresciani Salaroli2
1Postgraduate Program in Public Health, Federal University of Espírito Santo, Vitória, Espírito Santo, Brazil; 2Postgraduate Program in Public Health, Postgraduate Program in Nutrition and Health, Department of Health Integrated Education, Federal University of Espírito Santo, Vitória, Espírito Santo, Brazil
Background: The prevalence of metabolic syndrome (MetS) is increasing, and its development may be related to westernized diets and working conditions.
Purpose: The purpose of this study was to evaluate the association of dietary patterns in bank employees with the presence of MetS, considering sociodemographic and behavioral factors as well as laboratory tests.
Subjects and methods: This was a cross-sectional study of 515 bankers. Sociodemographic, occupational, behavioral, and food consumption data were collected. Dietary patterns were determined by principal component analysis with orthogonal varimax rotation.
Results: The dietary pattern of vegetables, fruits, cereals, and tubers was correlated with the presence of MetS and with waist circumference measurements and triglyceride levels. Individuals in the third and fifth quintiles of the pattern “vegetables, fruits, cereals, and tubers” presented with 3.28 and 2.24 times less chances of MetS when compared to individuals in the first quintile of this dietary pattern (OR 0.30, 95% CI 0.13–0.67, and OR 0.44, 95% CI 0.21–0.92, respectively). Subjects over 45 years of age were almost twice as likely to develop MetS (OR 1.95, 95% CI 1.01–3.77).
Conclusion: Healthy eating represented by the dietary pattern “vegetables, fruits, cereals, and tubers” was associated with better health among bank employees, especially when evaluating competing metabolic complications such as MetS.
Keywords: metabolic syndrome, dietary patterns, food consumption, workers, bank employees
Introduction
Metabolic syndrome (MetS) is a strong predictor of mortality as a result of cardiovascular complications.1,2 In Brazil, cardiovascular disease presents a troubling situation, not only because of high morbidity and mortality rates, but also mainly because it significantly affects younger age groups, among the working classes.3 The high prevalence of MetS in different countries, as well as its intimate association with cardiovascular morbimortality, has imposed significant costs on society, the expense of treatment, the economic loss of a portion of the work-force, in addition to loss of quality of life and early death.3
Aguilar et al4 evaluated data from the National Health and Nutrition Examination Survey 2003–2012, which showed MetS had a prevalence of 33% in the American population. The prevalence of MetS increased from 32.9% for 2003–2004 to 34.7% for 2011–2012. In a population-based study conducted in the city of Vitória, ES, Brazil, the overall prevalence of MetS was 29.8% (95% CI 28%–32%), with no difference between the sexes.5 The prevalence of MetS was 36.6% in São Paulo, SP, Brazil,6 according to the International Diabetes Federation, and in the Marajó Region of Pará, Brazil, the prevalence of MetS was 34.1%.7
In Vitória, a group of workers from a banking network have been studied by Salaroli et al.8 It was demonstrated that 17.2% (n=86) of the employees had MetS, with characteristic alterations in biochemical markers. It should be emphasized that the banking professional group presented with a high level of stress-related conditions,9 as well as a high prevalence of insulin resistance associated with MetS.10 Levels of ultra-sensitive C-reactive protein were a useful and effective marker in identifying the development of MetS,11 and dietary patterns were associated with the lifestyle of the banking group and the level of social support received.12
Prevalence of MetS is increasing at such a rate that in some regions it already exceeds one-third of the population. Metabolic disorders, now account for more than 70% of the deaths in Brazil.13 The increase in MetS might be related to westernized food habits coupled with a sedentary lifestyle.14,15 This relationship can be seen in changes in food habits observed over the years in the Brazilian population, mainly after industrialization and urbanization.16 The urbanized style, conditioned by the work routine observed in a large part of the population, has significantly altered the choice and how food is prepared, changing the way people relate to feeding themselves and to staying well nourished.14,17
This study aimed to evaluate the association of diet patterns with the presence of MetS within the banking community, considering sociodemographic and behavioral factors, as well as laboratory parameters.
Subjects and methods
Study design and participants
This was a cross-sectional observational study, with data derived from a study on MetS, insulin resistance, and associated factors in bank employees.8,10 The sample analyzed consisted of full-time employees of a banking network, August 2008 to August 2009, in Greater Vitória, ES, Brazil, aged between 20 and 64 years, for both genders.
For sample size calculations, all 1,410 bank employees of the institution were considered as part of the study population, with an prevalence of inadequate nutritional consumption of ~50%, a significance level of 5%, a sampling error of 6%, and a design effect equal to 2 (effect of agency conglomerates), with 450 employees as the minimum sample size. As a way to compensate for possible loss of participants, all 525 employees randomly selected for the original project were considered. Of these, 518 (98.6%) completed all the questionnaires and three did not respond to the Food Frequency Questionnaire. In addition, three individuals presented caloric intake higher than plausible values for habitual food consumption18 and were removed from the analysis. Therefore, the final sample was 515 individuals.
Measures
Data were collected through a structured questionnaire applied by trained interviewers. Sociodemographic, occupational, and behavioral variables related to the association of eating patterns with MetS in banking sector were investigated (Figure 1).
 | Figure 1 Theoretical model to evaluate the association of eating patterns with the presence of metabolic syndrome in the banking community, considering sociodemographic and behavioral factors, as well as laboratory parameters. |
The sociodemographic variables used in this study were: sex; age group, categorized as “under 45 years” and “45 years and over;” socioeconomic class, based on the criterion of Brazilian economic classification and categorized in “A+B” or “C+D+E;”19 ethnicity/skin color, categorized as “white” and “non-white;”20 schooling, classified as “primary and secondary education” and “higher and postgraduate education;” and marital status, categorized as “common-law marriage” when married or living with partner and “without common-law marriage” when single, separated, divorced, or widowed.
Work characteristics were evaluated by investigating the participants’ lunchtime interval, whether they lived in the same city as their workplace, their occupational stress, and the social support they received. In order to determine “occupational stress” and “social support,” the abridged and adapted version of the Job Stress Scale21 was used according to the demand-control model of Karasek and Theorell,22 classifying individuals as “stressed” (high wear and passive work) and “not stressed” (active work and low wear).9,22 For the definition of “social support,” the median scores were obtained for this region, categorizing high social support scores at >22 and low social support at scores ≤22.9,21
Behavioral variables included tobacco and alcohol use and physical activity. They also included eating habits such as replacing lunch with snacks, eating at restaurants, using sweeteners, using salt shakers at the table, consuming industrialized seasonings, and the number of meals prepared daily. Questions regarding dietary habits were adapted from the questionnaire on Surveillance of Chronic Diseases by Telephone Inquiry (Vigilância de Doenças Crônicas por Inquérito Telefônico; VIGITEL) and were categorized according to the self-reported frequency. Smokers and alcohol users were classified as such, regardless of the amount or frequency of consumption. Physical activity level was determined by the long version of the International Physical Activity Questionnaire validated for the Brazilian population,23 with sufficiently active individuals being those who reported at least 150 minutes of activity ≥5 days/week24 in sessions related to leisure and transportation.25 To evaluate food intake, we used the semi-quantitative Food Frequency Questionnaire (FFQ) validated for Brazilian adults,26 and analyzed the results by means of dietary patterns determined by the principal component analysis (PCA) method.12
The application of the PCA method to the study group was analyzed, as was the adequacy of the sample size.27 Internal consistency of the FFQ was determined with Cronbach’s alpha index.28 Applicability of the PCA method was assessed using the Kaiser-Meyer-Olkin coefficient test and Bartlett’s test of sphericity.27 A determination was also made of the number of factors to be extracted by Lebart’s test, based on the Cattel graph test.27,28
To obtain uncorrelated factors, a factorial analysis was applied to the food groups, selecting the orthogonal varimax rotation for the extraction of the factors,27,28 grouping foods with saturation loads above 0.3,29 thus identifying dietary patterns based on their interpretability and characteristics of items held in the dietary pattern.27
After rotational factor analysis, three dietary patterns were generated, representing the food consumption of the study population. Pattern 1, vegetables, fruits, cereals, and tubers, which contained cabbage, carrot, cucumber, pumpkin, zucchini, okra, chayote, cauliflower, beet and pod, lettuce, tomato, papaya, apple, pear, watermelon, guava, mango, pineapple, grape, orange, manioc, polenta, cooked potatoes and yams, onion, garlic, and peppers. Pattern 2, sweets and snacks, which contained lentils, cake, ice cream, chocolate, pudding, chocolate powder, pizza, salty fish, canned fish and shrimp, wine, viscera, and avocado. Pattern 3, traditional and protein, which contained rice, beans, pork, bone-in beef and beef steak, sausage, eggs, potato chips, hamburger, bacon, mayonnaise, sweet bread, salt bread, and butter/margarine.12
MetS in bank employees was classified according to the National Cholesterol Education Program/Adult Treatment Panel III guidelines,30,31 which identified the presence of MetS when at least three of the following criteria are present: waist circumference (WC) >102 cm for men and >88 cm in women; systolic blood pressure (SBP)/diastolic blood pressure (DBP) ≥130/85 mmHg; fasting blood glucose ≥100 mg/dL; triglycerides (TG) ≥150 mg/dL; and high-density lipoprotein cholesterol (HDL-c) <40 mg/dL for men and <50 mg/dL for women, taking into account the use of drugs to control lipid and blood glucose levels, as well as the use of antihypertensive drugs.8
Biochemical tests were performed in an accredited network reference laboratory using the COBAS E601 analyzer (Hoffman-La Roche Ltd., Basel, Switzerland). Blood samples were obtained by venipuncture in patients who had fasted for 12 hours, and ~10 mL of blood sample was collected into tubes without anticoagulants (ie, a dry tube). For WC measurements, the subject stood with arms extended from the body, then a 1 mm-wide Sanny Medical® inextensible measuring tape (São Bernardo do Campo/São Paulo, Brazil) was used that surrounded the subject at a midpoint between the lower margin of the last rib and the iliac crest.32 The OMRON 742H digital® device (Vila Olimpia/São Paulo, Brazil) was used to measure SBP and DBP following the protocol of the Joint National Committee on Prevention.33
Statistical analysis
The determination of bank employees’ dietary patterns was performed by PCA. Different methods can be applied to analyze food consumption. Among them is the quantitative analysis by dietary patterns. The WHO recommends this procedure as it allows the presentation of food profiles rather than isolated nutrients, demonstrating the complex chemical combinations that may be adverse, competing or altering the bioavailability of other compounds or nutrients.
To describe the study variables, we used measures of central tendency (mean and median) and dispersion measures (pattern deviations and interquartile range) for continuous variables, and absolute and percentage measures for the categorical variables. Dietary patterns were evaluated with respect to the first, third, and fifth quintiles, in order to measure the influence of consumption extremes of each dietary pattern.34,35
For qualitative variables, the chi-squared association test was used. Fisher’s exact test was used when the expected values in the table cells were <5 or when the sum of the column value was <20. For a quantitative and a qualitative variable, after the normal distribution was evaluated by the Komolgorov–Smirnov test, a comparison was made between the means by the Kruskal–Wallis test and by using the Mann–Whitney U test, two to two, to identify the differences.
The binary logistic regression model was used to test the associations between the independent variables and MetS. The variables with up to 20% significance in the univariate analysis were inserted in the logistic regression model.
For all analyses, the level of significance was α≤5%. These analyses were performed using the statistical software IBM SPSS Statistics for Windows, version 22.0 (IBM Corporation, Armonk, NY, USA).
Ethical issues
The Research Ethics Committee of the Health Sciences Center of the Universidade Federal do Espírito Santo approved the study under Opinion N° 1.539.427. All participants in the study signed an informed consent form, and this study was conducted in accordance with the Declaration of Helsinki.
Results
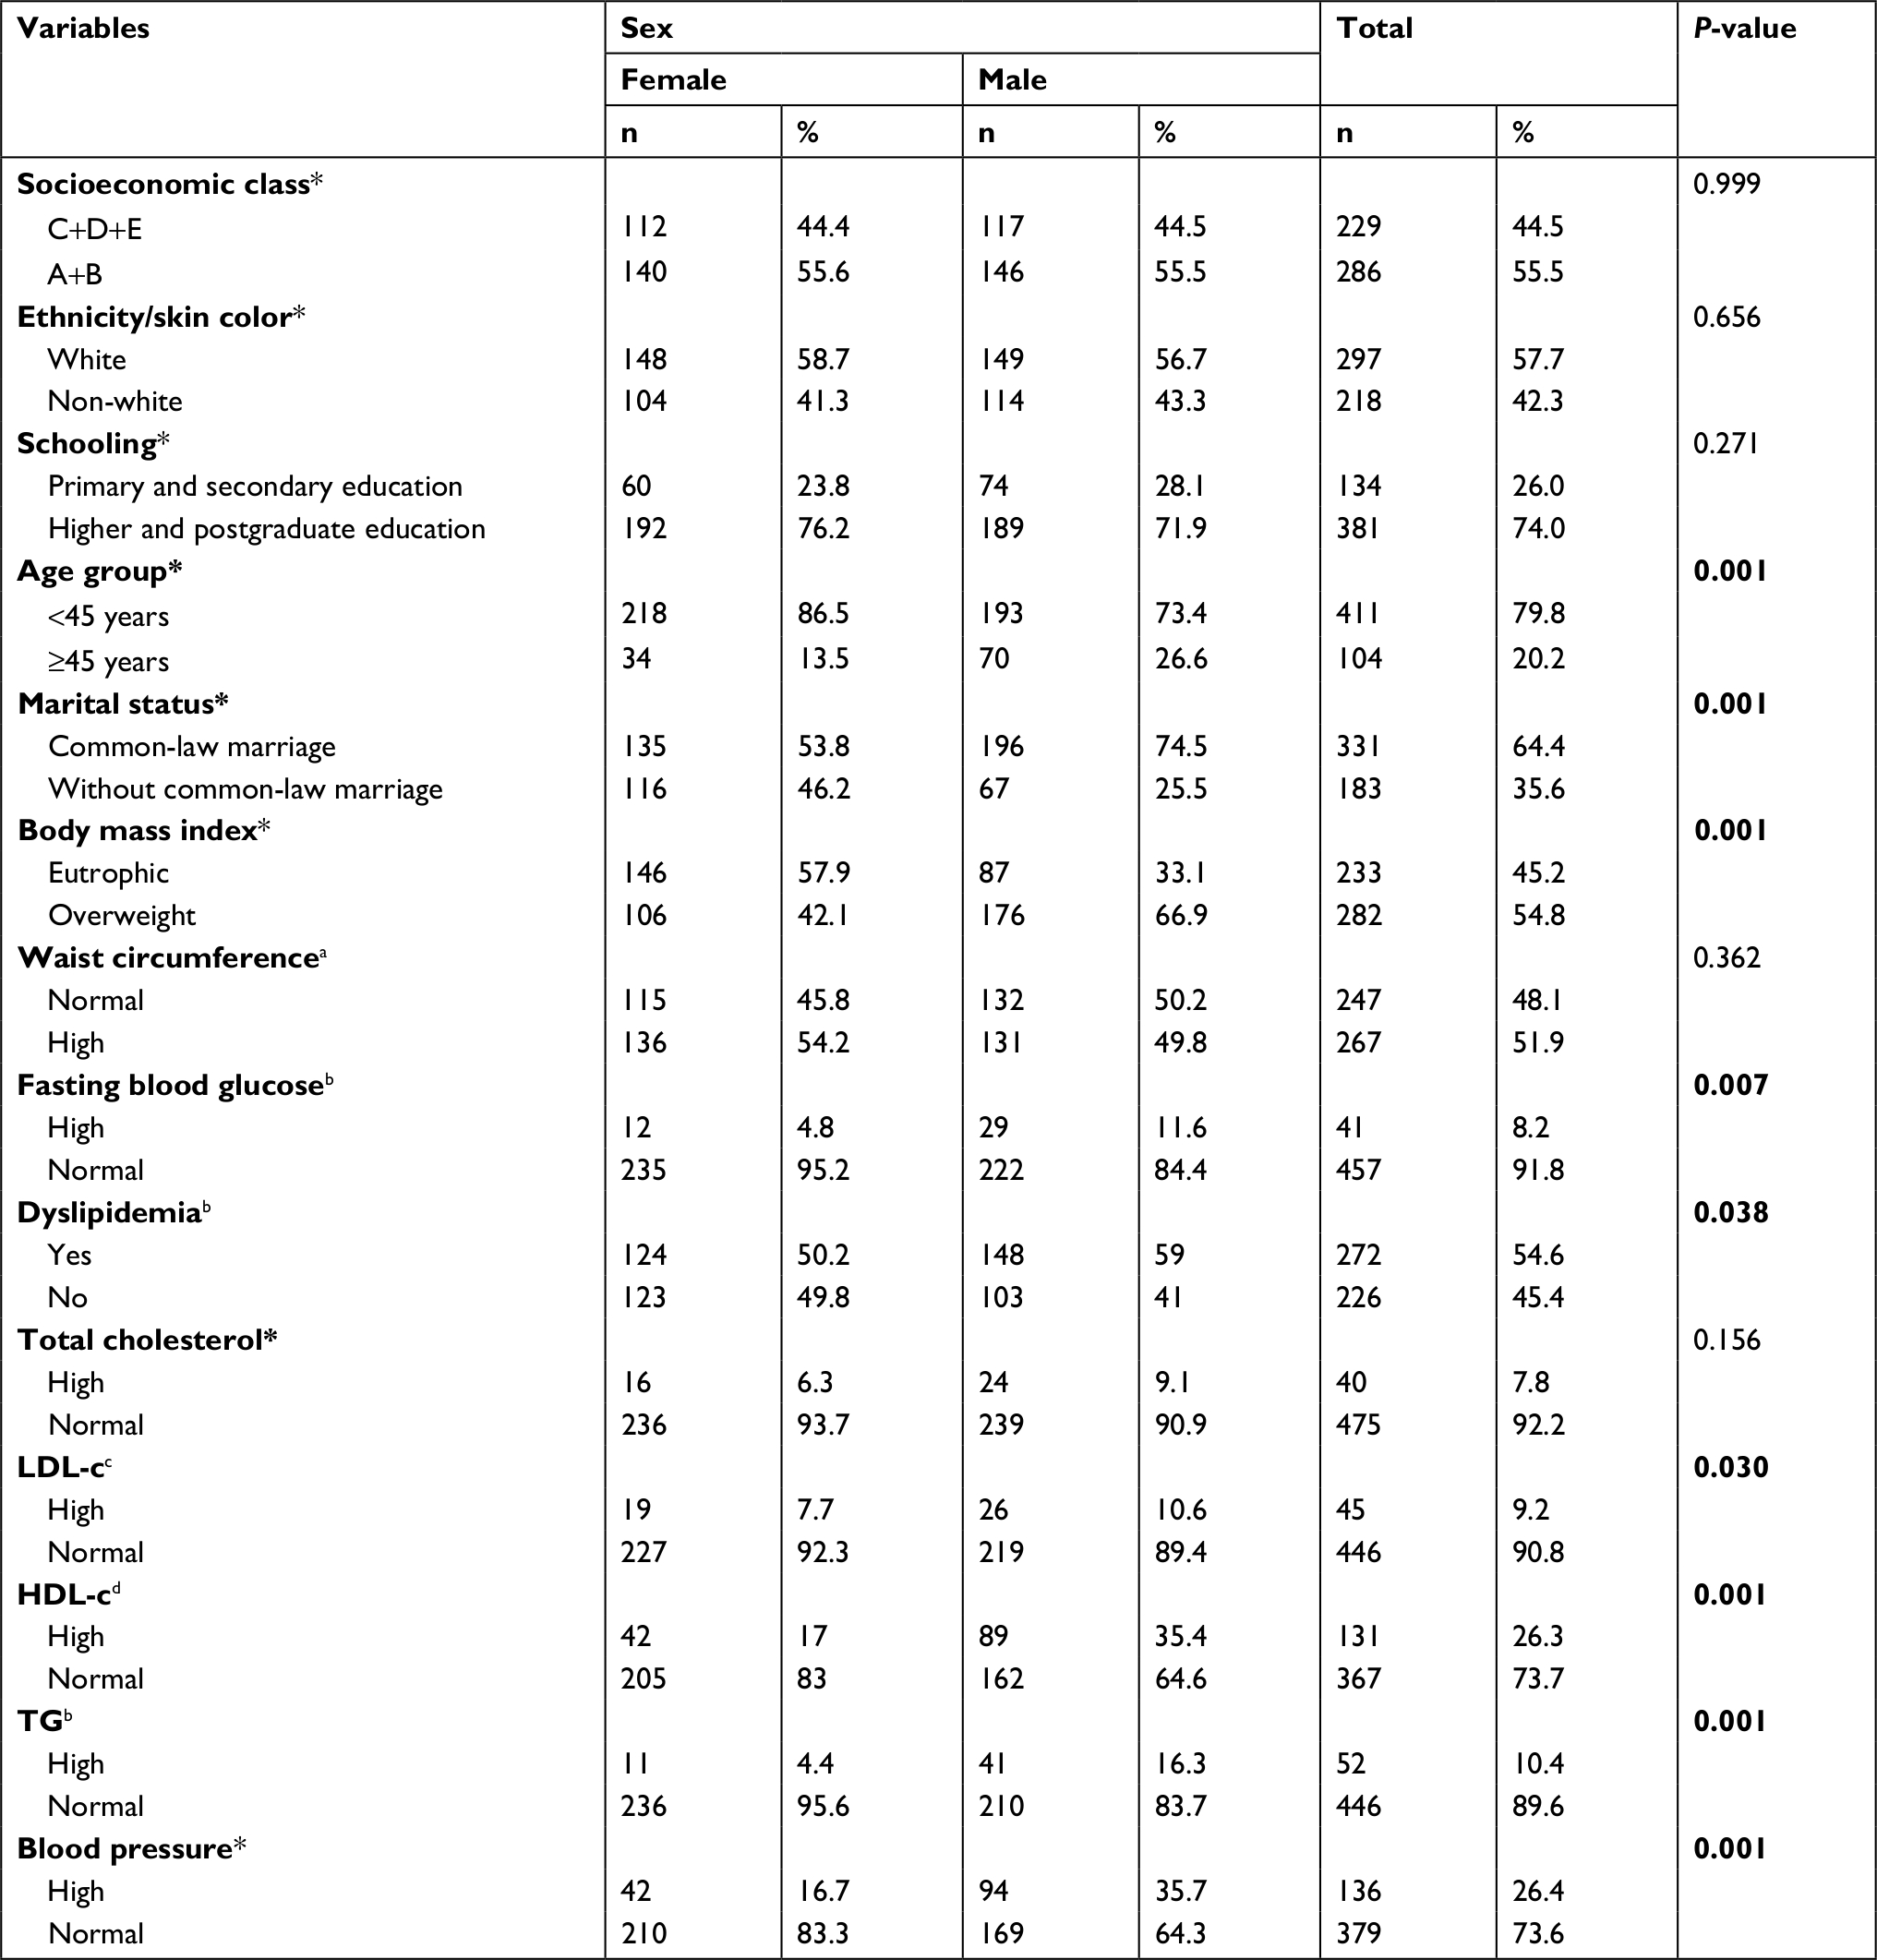
Most bank employees were of socioeconomic class A and B (55.5%, n=286), white (57.7%, n=297), with a high educational level (higher and postgraduate education, 74%, n=381), were in a common-law marriage (64.4%, n=331), and were in the age group of 31–50 years (61.5%, n=317). Consumption of alcoholic beverages was reported by 62.5% (n=322) of the sample. Smokers accounted for 23.8% (n=122), with other tobacco use being found in 9.5% of workers (n=49), and 65.8% (n=339) were insufficiently active. MetS was found in 17.2% (n=85) of bank employees, and 51.9% (n=267) had abdominal obesity. Altered fasting glycemia in 8.2% (n=41) of the study group was higher in males (P=0.007). HDL-c values below the threshold set for men and women were present in 26.3% (n=131) of the participants, while altered TG was present at 10.4% (n=382), in both the cases with a higher prevalence in males (P=0.001) (Table 1).
 | Table 1 Characterization of bank employees, according to sex Notes: Chi-squared test. *Fisher’s exact test. In bold: statistically significant values (P<0.05). n=515; an=514; bn=498; cn=491; dn=495. Data on metabolic syndrome and sociodemographic and labor factors have already been published. Abbreviations: LDL-c, low-density lipoprotein cholesterol; HDL-c, high-density lipoprotein cholesterol; TG, triglyceride. |
Age and marital status were correlated with MetS (Table 2), in that individuals aged 45 years or in common-law marriages had more MetS (P=0.032 and 0.007, respectively). Job and behavioral variables did not show any association with the presence of MetS (Tables 2 and 3). However, individuals with a higher adherence to the dietary pattern “vegetables, fruits, cereals, and tubers” showed an inverse correlation with the presence of MetS (P=0.008), while the “sweets and snacks” and “traditional and protein” standards did not present statistical differences with the presence of MetS in bank employees (Table 3).
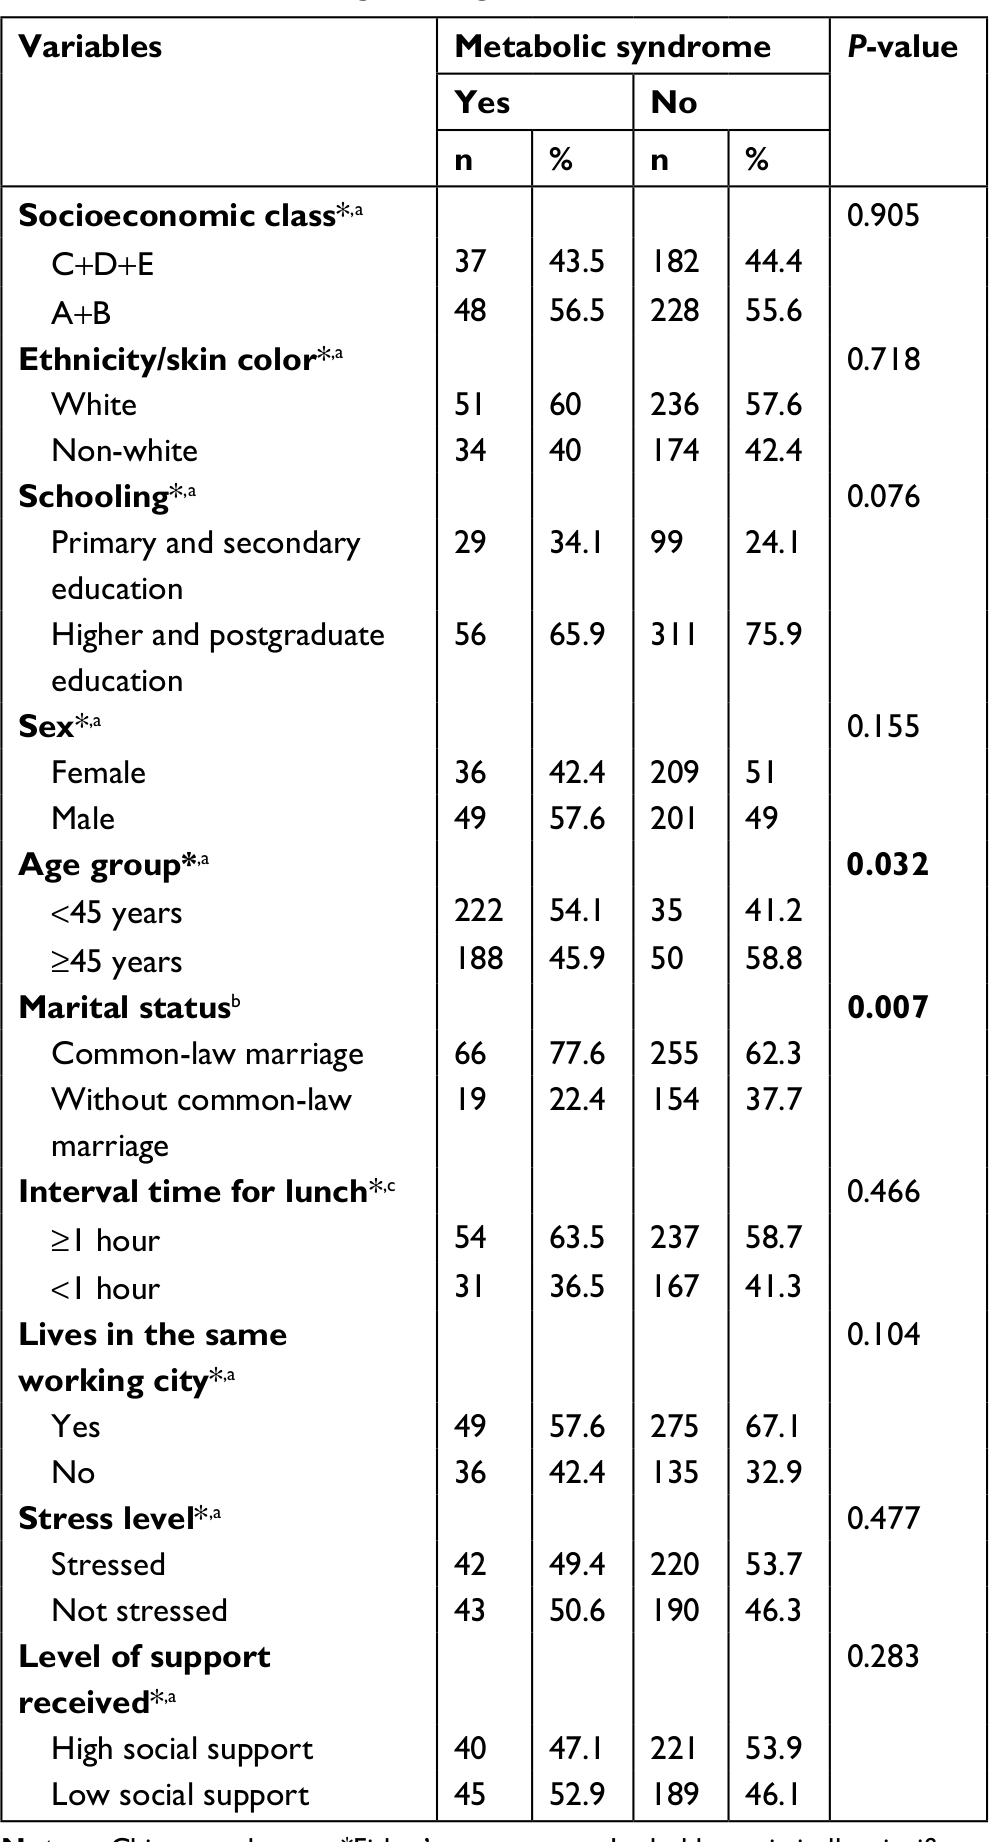 | Table 2 Metabolic syndrome according to sociodemographic and labor variables of bank employees, to determine the variables to be included in the logistic regression model Notes: Chi-squared test. *Fisher’s exact test. In bold: statistically significant values (P<0.05). an=495; bn=494; cn=489. Data on metabolic syndrome and sociodemographic and labor factors have already been published.8,10 |
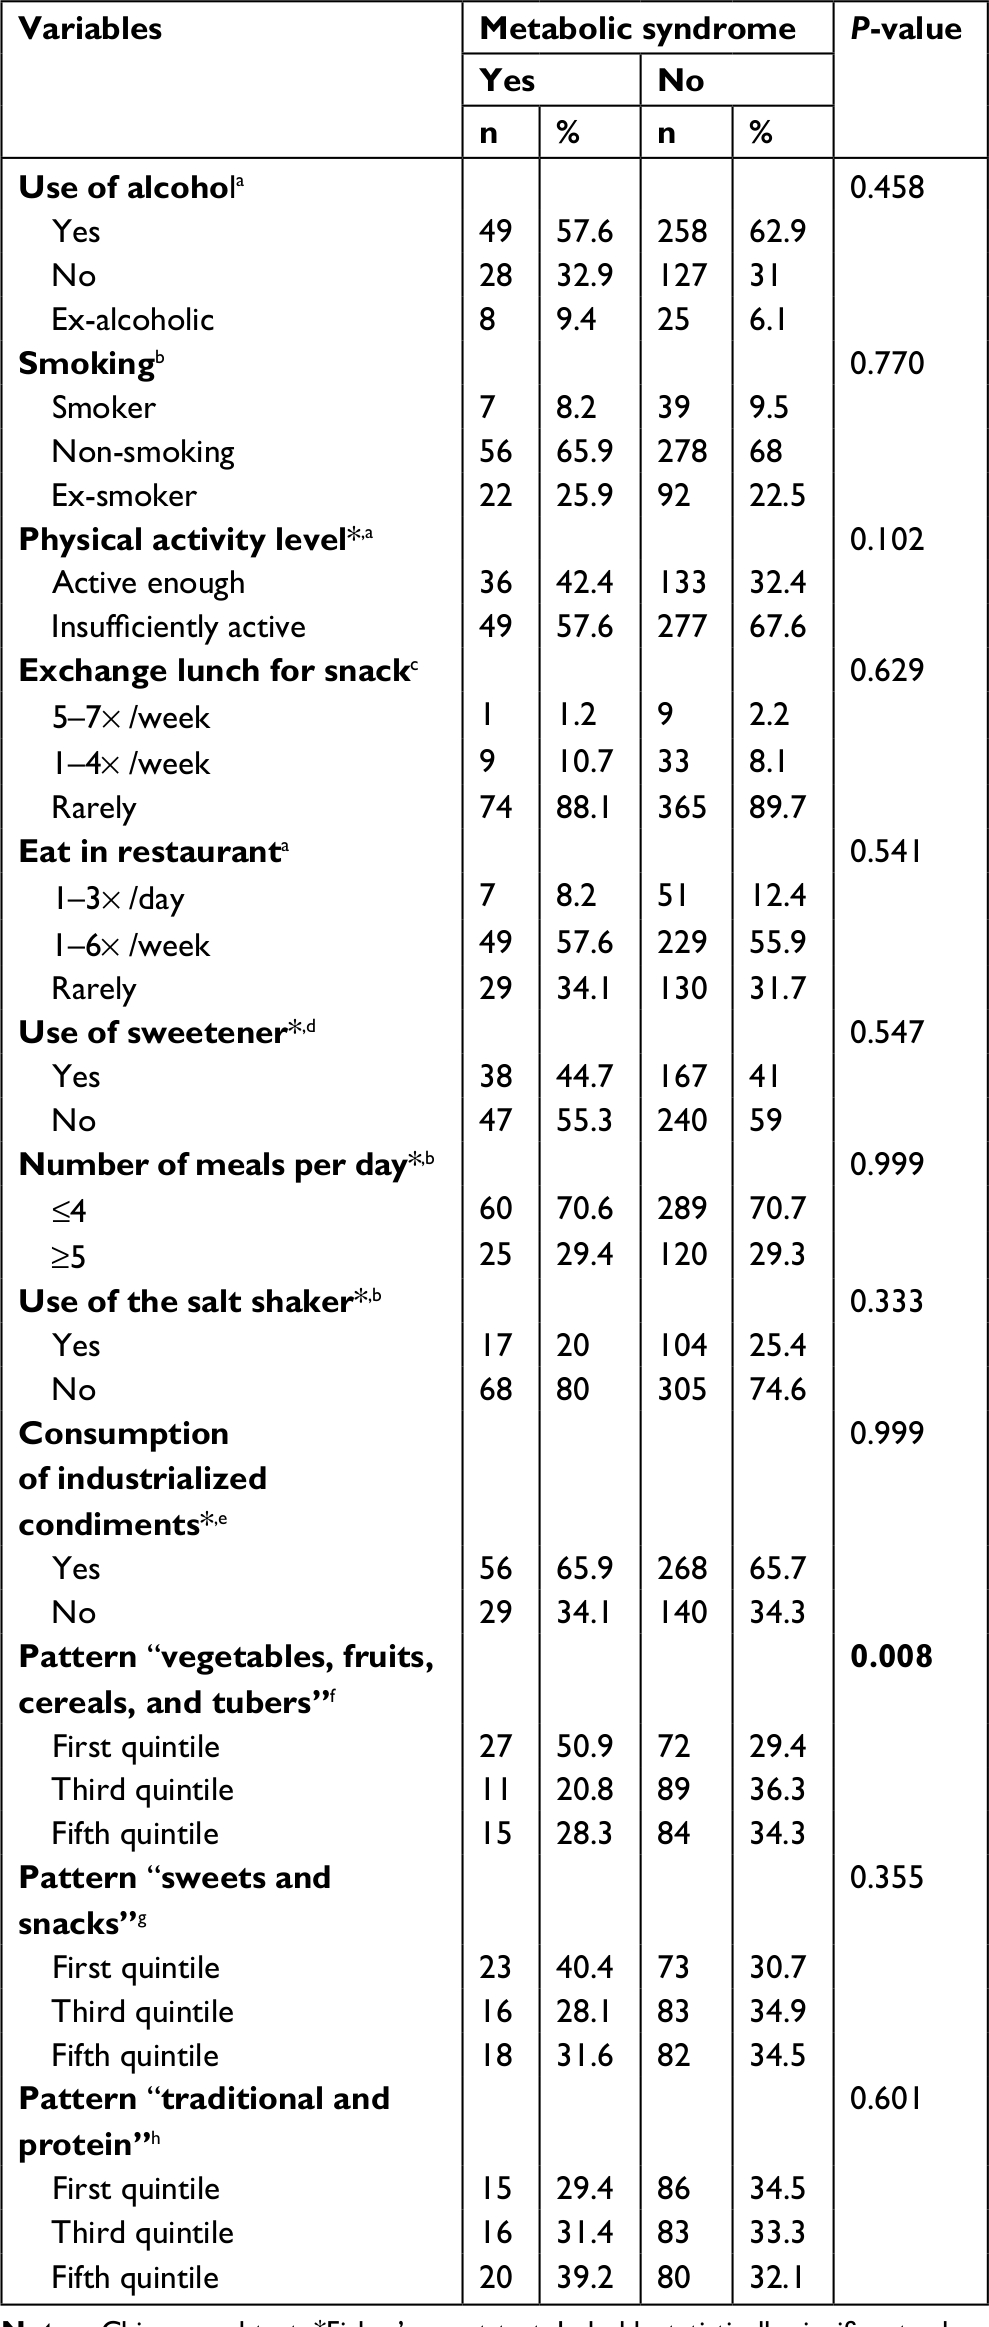 | Table 3 Metabolic syndrome according to behavioral variables and bank employees’ dietary patterns, to determine the variables to be included in the logistic regression model Notes: Chi-squared test. *Fisher’s exact test. In bold: statistically significant values (P<0.05). an=495; bn=494; cn=491; dn=492; en=493; fn=298; gn=295; hn=300. Pattern “vegetables, fruits, cereals, and tubers”: cabbage, carrot, cucumber, pumpkin, zucchini, okra, chayote, cauliflower, beet and pod, lettuce, tomato, papaya, apple, pear, watermelon, guava, mango, pineapple, grape, orange, manioc, polenta, cooked potatoes and yams, onion, garlic, and peppers; pattern “sweets and snacks”: lentils, cake, ice cream, chocolate, pudding, chocolate powder, pizza, salty fish, canned fish and shrimp, wine, viscera, and avocado; pattern “traditional and protein”: rice, beans, pork, bone-in beef and beef steak, sausage, eggs, potato chips, hamburger, bacon, mayonnaise, sweet bread, salt bread, and butter/margarine. |
When analyzing the association of the diagnostic criteria for MetS in relation to the first, third, and fifth consumption quintiles of the pattern “vegetables, fruits, cereals, and tubers,” we observed an association with WC and TG (Table 4). Individuals who adhered less well to the pattern “vegetables, fruits, cereals, and tubers” had a higher WC (93±17 cm in the first quintile vs 87±19 cm in the fifth quintile, P=0.001; and 93±17 cm in the first quintile vs 84±18 cm in the third quintile, P=0.019), as well as a higher level of blood TG (121±71 mg/dL in the first quintile vs 111±72 mg/dL in the fifth quintile, P=0.003).
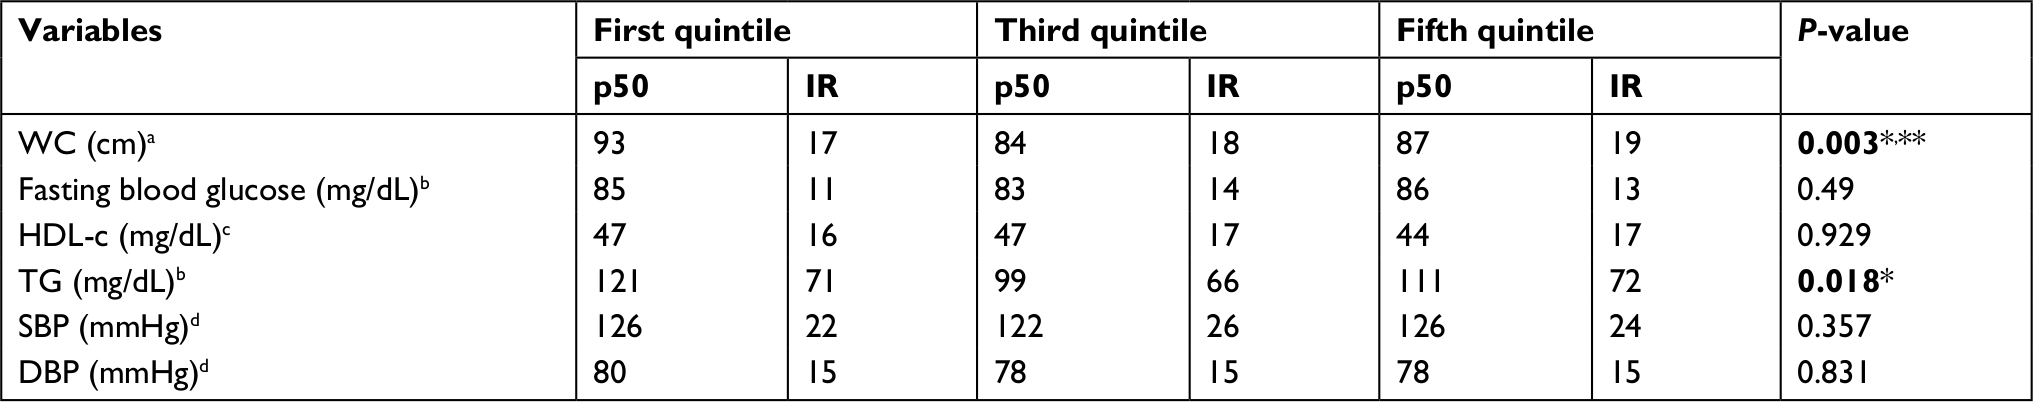 | Table 4 Diagnostic criteria for metabolic syndrome in bank employees according to consumption quintiles of the dietary pattern “vegetables, fruits, cereals, and tubers” Notes: Kruskal–Wallis test by using the Mann–Whitney U test, two to two, to identify the differences. In bold: statistically significant values (P<0.05). *Difference between the first quintile and the third quintile. **Difference between the first quintile and the fifth quintile. an=514; bn=498; cn=495; dn=515. Abbreviations: p50, median; IR, interquartile range; WC, waist circumference; HDL-c, high-density lipoprotein cholesterol; TG, triglyceride; SBP, systolic blood pressure; DBP, diastolic blood pressure. |
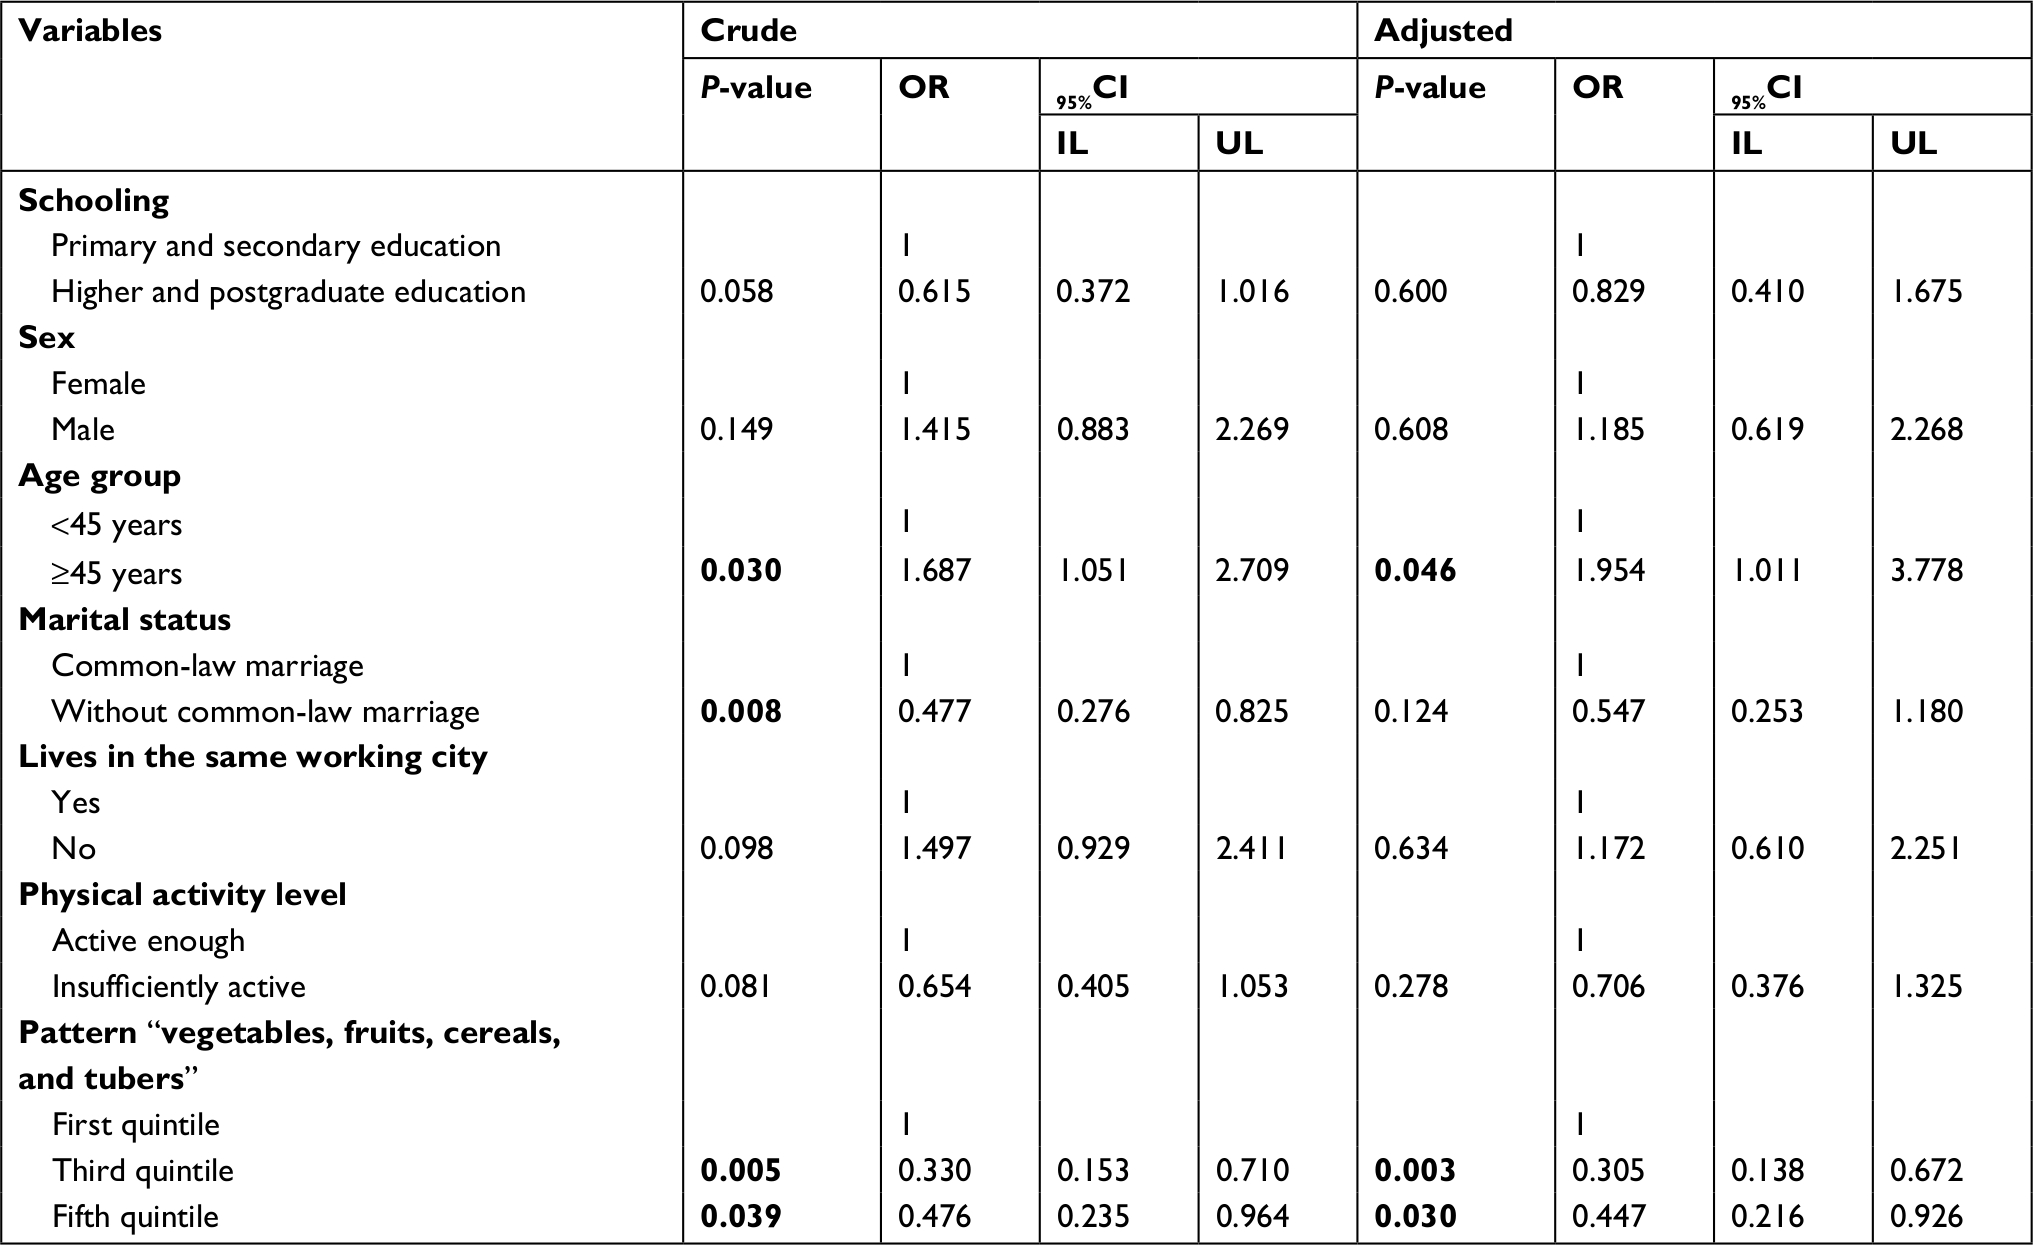
After binary logistic regression analysis with the variables that entered the model, there was an association between age >45 years and a higher chance of MetS (OR 1.687, 95% CI 1.051–2.709, P=0.03). No common-law marriage (OR 0.477, 95% CI 0.276–0.825, P=0.008) and greater adherence to the standard “vegetables, fruits, cereals, and tubers” diet decreased the chances of having MetS (OR 0.330, 95% CI 0.153–0.710, P=0.005 in the third quintile; and OR 0.4776 95% CI 0.235–0.964, P=0.039 in the fifth quintile). After adjusted analysis, it was found that the pattern “vegetables, fruits, cereals, and tubers” and age ≥45 years were associated with MetS. Individuals in the third and fifth quintiles of the “vegetables, fruits, cereals, and tubers” standard presented 3.28 times and 2.24 times less chances of MetS when compared to individuals in the first quintile of this dietary pattern (OR 0.305, 95% CI 0.138–0.672; and OR 0.447, 95% CI 0.216–0.926, respectively). Individuals over 45 years of age were almost twice as likely to develop MetS (OR 1.954, 95% CI 1.011–3.778; Table 5).
 | Table 5 Binary logistic regression, considering the variables associated with metabolic syndrome in bank employees Notes: Binary logistic regression. In bold: statistically significant values (P<0.05). Cases of statistical significance >20% in the chi-squared test were not included in the analyses. Pattern “vegetables, fruits, cereals, and tubers”: cabbage, carrot, cucumber, pumpkin, zucchini, okra, chayote, cauliflower, beet and pod, lettuce, tomato, papaya, apple, pear, watermelon, guava, mango, pineapple, grape, orange, manioc, polenta, cooked potatoes and yams, onion, garlic, and peppers. Abbreviations: IL, inferior limit; UL, upper limit. |
Discussion
The pattern “vegetables, fruits, cereals, and tubers” was a protective factor against MetS, unlike the “sweets and snacks” and “traditional and protein” patterns, possibly due to the nutritional composition of this dietary pattern. The protection attributed to the pattern “vegetables, fruits, cereals, and tubers” against MetS might be due to the interaction of factors that prevented the central deposit of fat and consequently of insulin resistance and its metabolic complications,36 consistent with the association of this dietary pattern with lower WC in bank employees. This effect probably occurred due to the antioxidant and anti-inflammatory capacity of foods belonging to this pattern.14,37,38
It is known that fruits, vegetables, and cereals are excellent sources of micronutrients and dietary antioxidants, such as vitamin C, vitamin E, carotenoids, and flavonoids.14,38 These antioxidants and phytochemicals, together with a complex of nutritional variables, are able to reduce insulin resistance and oxidative stress in the individual, aiding in the correct stimulation of pancreatic β cells and mobilization of body energy reserves.39,40 They are also able to modulate the levels of adiponectin and leptin related to excess adiposity,41 preventing metabolic changes and their comorbidities.38
Ford et al42 in as early as 2003 indicated that a higher production of free radicals is inversely correlated with insulin action, since American adults with MetS had suboptimal concentrations of some antioxidants, which contributed to the higher risk of glycemic changes and cardiovascular diseases. However, further studies are needed to determine the extent to which dosage of protective regimes can be beneficial.43 In this study, a nutritional pattern rich in micronutrients has already shown a positive relationship in the prevention of MetS.
The phytosterols present in the pattern “vegetables, fruits, cereals, and tubers” are a group of naturally occurring plant sterols that also contribute to the control of blood cholesterol by blocking the intestinal absorption of dietary and biliary cholesterol, decreasing cholesterolemia in patients with MetS and assisting in cardiovascular protection.44 The B complex, C, D, and E vitamins and folic acid present in this dietary pattern are associated with reduced cardiovascular risk,14,45 mainly due to the impact on homocysteine metabolism.45 In addition, it is a pattern with a high fiber content, which increases the synthesis of bile acids and causes less return flow in the enterohepatic circulation, contributing to a greater conversion of hepatic cholesterol and assisting in the control of MetS.46 It is also a pattern composed of foods with a lower caloric content, which helps in the control of body weight and abdominal obesity. In addition, the foods have low glycemic indexes and carbohydrate levels, favoring the control of TG levels.47 Nutraceuticals and functional food ingredients are beneficial to vascular health but the mechanisms underlying such actions are not fully understood. This is related to reducing 7a-hydroxylase, increasing fecal excretion of cholesterol, decreasing 3-hydroxy-3-methylglutaryl-CoA reductase mRNA levels, or reducing the secretion of very low-density lipoprotein.48
MetS is associated with a range of major complications, in part because it includes the presence of several cardiovascular risk factors, such as abdominal obesity, high blood pressure, fasting glycemia, hypertriglyceridemia, and low HDL-c.30 It is possible that the dietary pattern “vegetables, fruits, cereals, and tubers” might be protective for MetS and a range of associated metabolic complications.
Identification of a dietary pattern that reduced the risk of developing MetS was important because of the high rate of this comorbidity in the Brazilian population (29.6%, 14.9%–65.3%),49 including employed workers (17.2%).8 Cardiovascular disease patients with MetS are 2–3 times more likely to have complications and mortality than those without this metabolic complication,1,36 as well as being associated with a much higher risk of all-cause mortality.2
The beneficial effect of the “vegetables, fruits, cereals, and tubers” pattern on MetS was consistent with other studies. Esmaillzadeh et al34 identified that a dietary pattern characterized by high consumption of fruits, vegetables, and poultry (healthy eating pattern) was positively associated with a reduced risk of insulin resistance and MetS in female teachers. In contrast, a dietary pattern with large amounts of refined cereals, red meats, butter, processed meat, high-fat dairy products, and low amounts of low-fat vegetables and dairy products was associated with a higher risk of MetS. Baxter et al50 and Castanho et al37 also showed that fruits and vegetables had a protective effect against MetS and associated conditions. A study by Li et al51 involving 7,424 Chinese participants showed that sufficient intake of fruits and vegetables and adequate blood pressure control was significantly associated with a reduced risk of MetS in adults. In addition, Syauqy et al52 found that both a vegetable and seafood pattern, and a cereal and dairy pattern reduced the risk of developing MetS and inflammation among middle-aged and elderly people with MetS in Taiwan.
The prevalence of MetS with increasing age found in this study was also found in other studies.4,5,7 Despite age favoring the development of MetS, the dietary pattern “vegetables, fruits, cereals, and tubers” still maintained a protective effect, even after adjustments in statistical analysis.
Limitations
The use of questionnaire can be a limitation of the study design, and it should be emphasized that factorial analysis in deriving dietary patterns might be a methodological limitation, considering that this method involved subjectivity in making some decisions. However, transparency in detailing such decisions was used to mitigate such limitations.53 In addition, comparable results on food patterns in other studies provided some external validity.34,35,53,54 The use of food assessments in the field of epidemiology, based on dietary profiles rather than isolated nutrients, is a recommendation of the WHO.55 By reducing a large number of food variables to a smaller group of factors, it is possible to identify the underlying food components among the complex interaction of genetic, environmental, and individual factors that synergistically protect against chronic disease.54
Conclusion
A healthy diet represented by the dietary pattern “vegetables, fruits, cereals, and tubers” was associated with better health among bank employees, especially when evaluating the competing metabolic complications, such as MetS. This protective factor was closely linked to WC and blood TG and, consequently, control of insulin resistance and body weight. The action of this dietary pattern might be due to its nutritional quality, because it is rich in micronutrients, phytochemicals, and fibers. Its protective effect was maintained even after adjusting for sociodemographic, job-related, and behavioral factors. Therefore, encouraging the consumption of this diet in the workplace could reduce the chances of developing adverse metabolic changes and chronic disease in bank employees and those with similar jobs.
Acknowledgments
The authors would like to thank the bank for their support in all stages of this study and the Foundation for Support to Research and Innovation of Espírito Santo for their granted scholarship.
Author contributions
All authors contributed to data analysis, drafting or revising the article, gave final approval of the version to be published, and agree to be accountable for all aspects of the work.
Disclosure
The author reports no conflicts of interest in this work.
References
Lakka HM, Laaksonen DE, Lakka TA, et al. The metabolic syndrome and total and cardiovascular disease mortality in middle-aged men. JAMA. 2002;288(21):2709–2716. | ||
Li Z, Yang X, Yang J, et al. The Cohort Study on Prediction of Incidence of All-Cause Mortality by Metabolic Syndrome. PLoS One. 2016;11(5):e0154990. | ||
Almeida AL, Teixido-Tura G, Choi EY, et al. Metabolic syndrome, strain, and reduced myocardial function: multi-ethnic study of atherosclerosis. Arq Bras Cardiol. 2014;102(4):327–335. | ||
Aguilar M, Bhuket T, Torres S, Liu B, Wong RJ. Prevalence of the metabolic syndrome in the United States, 2003-2012. JAMA. 2015;313(19):1973–1974. | ||
Salaroli LB, Barbosa GC, Mill JG, Molina MCB. Prevalência de síndrome metabólica em estudo de base populacional, Vitória, ES-Brasil [Prevalence of Metabolic Syndrome in Population-Based Study, Vitória, ES-Brazil]. Arq Bras Endocrinol Metabol. 2007;51(7):1143–1152. Portuguese. | ||
Silva EC, Martins IS, Araújo EAC. Síndrome metabólica e baixa estatura em adultos da região metropolitana de São Paulo (SP, Brasil) [Metabolic syndrome and short stature in adults from the metropolitan area of São Paulo city (SP, Brazil)]. Cien Saude Colet. 2011;16(2):663–668. Portuguese. | ||
França SL, Lima SS, Vieira JR. Metabolic Syndrome and Associated Factors in Adults of the Amazon Region. PLoS One. 2016;11(12):e0167320. | ||
Salaroli LB, Saliba RA, Zandonade E, Molina MC, Bissoli NS. Prevalence of metabolic syndrome and related factors in bank employees according to different defining criteria, Vitória/ES, Brazil. Clinics. 2013;68(1):69–74. | ||
Petarli GB, Zandonade E, Salaroli LB, Bissoli NS. Estresse ocupacional e fatores associados em trabalhadores bancários, Vitória - ES, Brasil [Assessment of occupational stress and associated factors among bank employees in Vitoria, state of Espírito Santo, Brazil]. Cien Saude Colet. 2015;20(2):3925–3934. Portuguese. | ||
Salaroli LB, Cattafesta M, Molina M, Zandonade E, Bissoli NS. Insulin resistance and associated factors: a cross-sectional study of bank employees. Clinics. 2017;72(4):224–230. | ||
Cattafesta M, Bissoli NS, Salaroli LB. Metabolic syndrome and C-reactive protein in bank employees. Diabetes Metab Syndr Obes. 2016;9:137–144. | ||
Cattafesta M, Zandonade E, Bissoli NS, Salaroli LB. Eating patterns of bank workers and their association with socioeconomic, behavioral and labor factors. Cien Saude Colet [online]; 2018 [cited July 26, 2018]. Available from: http://www.cienciaesaudecoletiva.com.br/artigos/padroes-alimentares-de-trabalhadores-bancarios-e-sua-associacao-com-fatores-socioeconomicos-comportamentais-e-laborais/16683?id=16683. Accessed November 2,2018. | ||
Duncan BB, Stevens A, Schmidt MI. Mortalidade por doenças crônicas no Brasil: situação em 2010 e tendências de 1991 a 2010 [Mortality due to chronic diseases in Brazil: situation in 2010 and trends from 1991 to 2010]. Em: Saúde Brasil 2011: uma análise da situação de saúde e a vigilância da saúde da mulher. Brasília: Ministério da Saúde, Secretaria de Vigilância em Saúde, Departamento de Análise de Situação de Saúde. 2012:93–104. | ||
Narasimhan S, Nagarajan L, Vaidya R, et al. Dietary fat intake and its association with risk of selected components of the metabolic syndrome among rural South Indians. Indian J Endocrinol Metab. 2016;20(1):47–54. | ||
Ha S, Choi HR, Lee YH. Clustering of four major lifestyle risk factors among Korean adults with metabolic syndrome. PLoS One. 2017;12(3):e0174567. | ||
Maratoya ES, Carvalhaes GC, Wander AE, Almeida L. Mudanças no padrão de consumo alimentar no Brasil e no mundo [Changes in food consumption pattern in Brazil and around the world]. Revista de Política Agrícola. 2013;22(1):72–84. Portuguese. | ||
Reinaldo EDF, Silva MRF, Nardoto GB, Garavello M. Mudanças de hábitos alimentares em comunidades rurais do semiárido da região nordeste do Brasil [Changes in eating habits in rural communities of the semiarid, region of northastern of Brazil]. Interciencia. 2015;40(5):330–336. Portuguese. | ||
Willett W. Nutritional Epidemiology. 3rd ed. New York: Oxford University Press; 2013:529. | ||
Associação Brasileira de Empresas de Pesquisa (ABEP). Critério de Classificação Econômica Brasil (CCEB) [Economic Classification Criteria Brazil (ECCB)]. São Paulo; 2003: 3p. Available from: http://www.abep.org/novo/Content.aspx?ContentID=302. Accessed November 29, 2015. | ||
Telles EE. Racismo Brasileira: Uma Nova Perspectiva Sociológica [Brazilian Racism: A New Sociological Perspective]. Rio de Janeiro: Relume Dumará; 2003. | ||
Alves MGM, Chor D, Faerstein E, Lopes CS, Werneck GL, Lopes CS. Versão resumida da “job stress scale”: adaptação para o português [Short version of the “job stress scale”: a Portuguese-language adaptation]. Rev Saúde Pública. 2004;38(2):164–171. Portuguese. | ||
Karasek R, Theorell T. Healthy Work: Stress, Productivity and the Reconstruction of Working Life. New York: Basic Books; 1990. | ||
Matsudo S, Araújo T, Matsudo V, et al. Questionário Internacional de Atividade Física (IPAQ): estudo de validade e reprodutibilidade no Brasil [Internacional physical activity questionnaire (IPAQ): study of validy and reliability in Brazil]. Rev Bras Ativ Fís Saúd. 2001;6(2):5–18. | ||
Centro de estudos do laboratório de aptidão física de São Caetano do Sul (CELAFISCS). Classificação do nível de atividade física – IPAQ [Classification of physical activity level – CPAL]. Available from: http://www.celafiscs.institucional.ws/?c=148. Accessed November 24, 2015. | ||
Hallal PC, Gomez LF, Parra DC. Lições Aprendidas depois de 10 Anos de uso do IPAQ no Brasil e Colômbia [Lessons Learned after 10 Years of IPAQ use in Brazil and Colombia]. J Phys Act Health. 2010;7:S259–S264. Portuguese. | ||
Sichieri R, Everhart JE. Validity of a Brazilian food frequency questionnaire against dietary recalls and estimated energy intake. Nutr Res. 1998;18(10):1649–1659. | ||
Olinto MTA. Padrões alimentares: análise de componentes principais [Food standards: principal component analysis]. In: Kac G, Sichieri R, Gigante DP, editors. Epidemiologia Nutricional. Rio de Janeiro: Fiocruz; Atheneu; 2007:213–225. | ||
Hair JS Jr, Black WC, Babin BJ, Anderson RE, Tatham RL. Análise Multivariada de Dados [Multivariate Data Analysis]. 6th ed. Porto Alegre: Bookman; 2009. | ||
Souza AM, Pereira RA, Yokoo E, Levy RB, Sichieri R. Alimentos mais consumidos no Brasil: Inquérito Nacional de Alimentação 2008-2009 [Most consumed foods in Brazil: National Dietary Survey 2008-2009]. Rev Saúde Pública. 2013;47 Suppl 1:S190–S199. Portuguese. | ||
National Cholesterol Education Program (NCEP) / Adult Treatment Painel III. Summary of the third report of the National Cholesterol Education Program Expert Panel on detection, evaluation and treatment of the high blood Cholesterol in adults. JAMA. 2001;285(19):2486–2497. | ||
Grundy SM, Cleeman JI, Daniels SR, et al. Diagnosis and management of the metabolic syndrome: an American Heart Association/National Heart, Lung, and Blood Institute Scientific Statement. Circulation. 2005;112(17):2735–2752. | ||
Cameron N. The Measurement of Human Growth. Sydney: Croom Helm; 1984. | ||
Chobanian AV, Bakris GL, Black HR, et al. Seventh report of the Joint National Committee on Prevention, Detection, Evaluation, and Treatment of High Blood Pressure. Hypertension. 2003;42(6):1206–1252. | ||
Esmaillzadeh A, Kimiagar M, Mehrabi Y, Azadbakht L, Hu FB, Willett WC. Dietary patterns, insulin resistance, and prevalence of the metabolic syndrome in women. Am J Clin Nutr. 2007;85(3):910–918. | ||
Eilat-Adar S, Mete M, Fretts A, et al. Dietary patterns and their association with cardiovascular risk factors in a population undergoing lifestyle changes: The Strong Heart Study. Nutr Metab Cardiovasc Dis. 2013;23(6):528–535. | ||
Tadaki S, Sakata Y, Miura Y, et al. Prognostic Impacts of Metabolic Syndrome in Patients With Chronic Heart Failure - A Multicenter Prospective Cohort Study. Circ J. 2016;80(3):677–688. | ||
Castanho GKF, Marsola FC, Mclellan KCP, Nicola M, Moreto F, Burini RC. Consumption of fruit and vegetables associated with the Metabolic Syndrome and its components in an adult population sample. Cien Saude Colet. 2013;18(2):385–392. | ||
Ellis A, Crowe K, Lawrence J. Obesity-related inflammation: implications for older adults. J Nutr Gerontol Geriatr. 2013;32(4):263–290. | ||
Chung SW, Kang SG, Rho JS, et al. The Association between oxidative stress and metabolic syndrome in adults. Korean J Fam Med. 2013;34(6):420–428. | ||
Sarmento RA, Silva FM, Sbruzzi G, Schaan BD, Almeida JC. Antioxidant micronutrients and cardiovascular risk in patients with diabetes: a systematic review. Arq Bras Cardiol. 2013;101(3):240–248. | ||
Jafari-Vayghan H, Tarighat-Esfanjani A, Jafarabadi MA, Ebrahimi-Mameghani M, Ghadimi SS, Lalezadeh Z. Association between dietary patterns and serum leptin-to-adiponectin ratio in apparently healthy adults. J Am Coll Nutr. 2015;34(1):49–55. | ||
Ford ES, Mokdad AH, Giles WH, Brown DW. The metabolic syndrome and antioxidant concentrations: findings from the Third National Health and Nutrition Examination Survey. Diabetes. 2003;52(9):2346–2352. | ||
Sociedade Brasileira de Cardiologia (SBC) / Sociedade Brasileira de Hipertensão (SBH) / Sociedade Brasileira de Nefrologia (SBN). VI Diretrizes Brasileiras de Hipertensão [VI Brazilian Guidelines on Hypertension]. Arq Bras Cardiol. 2010;95(s1):1–51. Portuguese. | ||
Xavier HT, Izar MC, Faria Neto JR, et al. V Diretriz Brasileira Sobre Dislipidemias e Prevenção da Aterosclerose [V Brazilian Guideline on Dyslipidemias and Prevention of Atherosclerosis]. Arq Bras Cardiol. 2013;101(4 Suppl 1):1–22. Portuguese. | ||
World Health Organization (WHO). Creating an enabling environment for population-based salt reduction strategies. Report of a WHO and United Kingdom Food Standards Agency joint technical meeting; July 1–2, 2010, London. Geneva; 2010. | ||
García-Montalvo IA, Méndez Díaz SY, Aguirre Guzmán N, Sánchez Medina MA, Matías Pérez D, Pérez Campos E. Increasing consumption of dietary fiber complementary to the treatment of metabolic syndrome. Nutr Hosp. 2018;35(3):582–587. | ||
Yuan C, Lee HJ, Shin HJ, Stampfer MJ, Cho E. Fruit and vegetable consumption and hypertriglyceridemia: Korean National Health and Nutrition Examination Surveys (KNHANES) 2007-2009. Eur J Clin Nutr. 2015;69(11):1193–1199. | ||
Scicchitano P, Cameli M, Maiello M, et al. Nutraceuticals and dyslipidaemia: Beyond the common therapeutics. J Funct Foods. 2014;6:11–32. | ||
de Carvalho Vidigal F, Bressan J, Babio N, Salas-Salvadó J. Prevalence of metabolic syndrome in Brazilian adults: a systematic review. BMC Public Health. 2013;13:1198. | ||
Baxter AJ, Coyne T, Mcclintock C. Dietary patterns and metabolic syndrome--a review of epidemiologic evidence. Asia Pac J Clin Nutr. 2006;15(2):134–142. | ||
Li XT, Liao W, Yu HJ, et al. Combined effects of fruit and vegetables intake and physical activity on the risk of metabolic syndrome among Chinese adults. PLoS One. 2017;12(11):e0188533. | ||
Syauqy A, Hsu CY, Rau HH, Chao JC. Association of dietary patterns with components of metabolic syndrome and inflammation among middle-aged and older adults with metabolic syndrome in Taiwan. Nutrients. 2018;10(2):e143. | ||
Sichieri R, Casto JF, Moura AS. Fatores associados ao padrão de consumo alimentar da população brasileira urbana [Factors associated with dietary patterns in the urban Brazilian population]. Cadernos de Saúde Pública. 2003;19(Suppl 1):S47–S53. Portuguese. | ||
Massarani FA, Cunha DB, Muraro AP, Souza BS, Sichieri R, Yokoo EM. Agregação familiar e padrões alimentares na população brasileira [Familial aggregation and dietary patterns in the Brazilian population]. Cad Saude Publica. 2015;31(12):2535–2545. Portuguese. | ||
World Health Organization (WHO). Report of a Joint FAO/WHO Consultation. Preparation and use of food-based dietary guidelines. Geneva: WHO; 1998. |
 © 2018 The Author(s). This work is published and licensed by Dove Medical Press Limited. The full terms of this license are available at https://www.dovepress.com/terms.php and incorporate the Creative Commons Attribution - Non Commercial (unported, v3.0) License.
By accessing the work you hereby accept the Terms. Non-commercial uses of the work are permitted without any further permission from Dove Medical Press Limited, provided the work is properly attributed. For permission for commercial use of this work, please see paragraphs 4.2 and 5 of our Terms.
© 2018 The Author(s). This work is published and licensed by Dove Medical Press Limited. The full terms of this license are available at https://www.dovepress.com/terms.php and incorporate the Creative Commons Attribution - Non Commercial (unported, v3.0) License.
By accessing the work you hereby accept the Terms. Non-commercial uses of the work are permitted without any further permission from Dove Medical Press Limited, provided the work is properly attributed. For permission for commercial use of this work, please see paragraphs 4.2 and 5 of our Terms.