")
Back to Journals » International Journal of Nephrology and Renovascular Disease » Volume 12
Dialysis disequilibrium syndrome prevention and management
Authors Mistry K
Received 10 January 2019
Accepted for publication 26 February 2019
Published 30 April 2019 Volume 2019:12 Pages 69—77
DOI https://doi.org/10.2147/IJNRD.S165925
Checked for plagiarism Yes
Review by Single anonymous peer review
Peer reviewer comments 2
Editor who approved publication: Professor Pravin Singhal
Kirtida Mistry
Division of Nephrology, Children’s National Health System, Washington, DC 20010, USA
Abstract: The dialysis disequilibrium syndrome (DDS) is a clinical constellation of neurologic symptoms and signs occurring during or shortly following dialysis, especially when dialysis is first initiated. It is a diagnosis of exclusion occurring in those that are uremic and hyperosmolar, in whom rapid correction with renal replacement therapy leads to cerebral edema and raised intracranial pressure with resultant clinical neurologic manifestations. DDS is most commonly described in association with hemodialysis but can occur in patients with acute kidney injury requiring continuous renal replacement therapy (CRRT). To date, it has not been described in association with peritoneal dialysis. The syndrome is uncommon and becoming rarer, so performing randomized controlled trials to evaluate the effectiveness of potential therapies is almost impossible. This also makes studying the pathophysiology in humans challenging. It is associated with mortality but is also preventable, so identification of patients at risk, preventive measures, early recognition and prompt management of DDS will minimize morbidity and mortality associated with this syndrome. While the focus of this review is the prevention and management of DDS, there will be an emphasis on what is known about the pathophysiology because it strongly impacts the prevention and management strategies.
Keywords: dialysis disequilibrium syndrome, hemodialysis, continuous renal replacement therapy, CRRT, reverse urea, idiogenic osmoles, cerebral edema
Introduction
On December 31, 2016, there were 726,331 prevalent end-stage renal disease (ESRD) patients in the United States, and this number is increasing every year.1 By far the vast majority of these patients, just over 87%, begin renal replacement therapy with hemodialysis.1 Initiating this life-sustaining therapy can be complicated by dialysis disequilibrium syndrome (DDS), which manifests as neurologic symptoms and signs related to osmotic fluid shifts. Patients initiating dialysis with this modality are at highest risk for developing DDS, yet the syndrome is reportedly rare. The exact incidence is unknown, in part because only severe symptoms and signs, like seizures and mental status changes are recognized and reported as manifestations of DDS. Mild symptoms and signs like headache, nausea, and muscle cramps may represent the milder spectrum but not diagnosed as DDS. These symptoms are common during the hemodialysis procedure and often attributed to volume depletion due to excessive ultrafiltration. Thus, DDS may be more common than is reported. Suffice to say, changes in practice, in particular slowing down the rate of urea reduction in new dialysis patients, has resulted in DDS becoming less common with time.
The symptoms and signs of DDS (Table 1) are secondary to the development of cerebral edema and have a temporal relationship to the dialysis procedure. Neurologic manifestations progress sequentially as cerebral edema worsens and intracranial pressure rises, and if not promptly recognized and managed, can lead to coma and even death.2 The initial presentation of vomiting, headache, dizziness, agitation, disorientation, confusion, muscle cramps and tremors are common in chronic dialysis patients. They are usually ascribed to excessive or aggressive ultrafiltration, and hyper- or hypotension. However, DDS can occur in patients on chronic dialysis and must remain in the differential diagnosis, especially when predialysis blood urea nitrogen (BUN) is high and/or there is another driver for hyperosmolality, for example, hyperglycemia or hypernatremia.2 Studies measuring brain density in chronic dialysis patients using head computed tomography (CT) revealed decreased brain density or increased brain water during and after hemodialysis, but not in normal individuals or those on continuous peritoneal dialysis.3 This suggests that cerebral edema may complicate the chronic hemodialysis treatment and lead to some of the commonly encountered neurologic symptoms like intra- and post-dialytic headache.
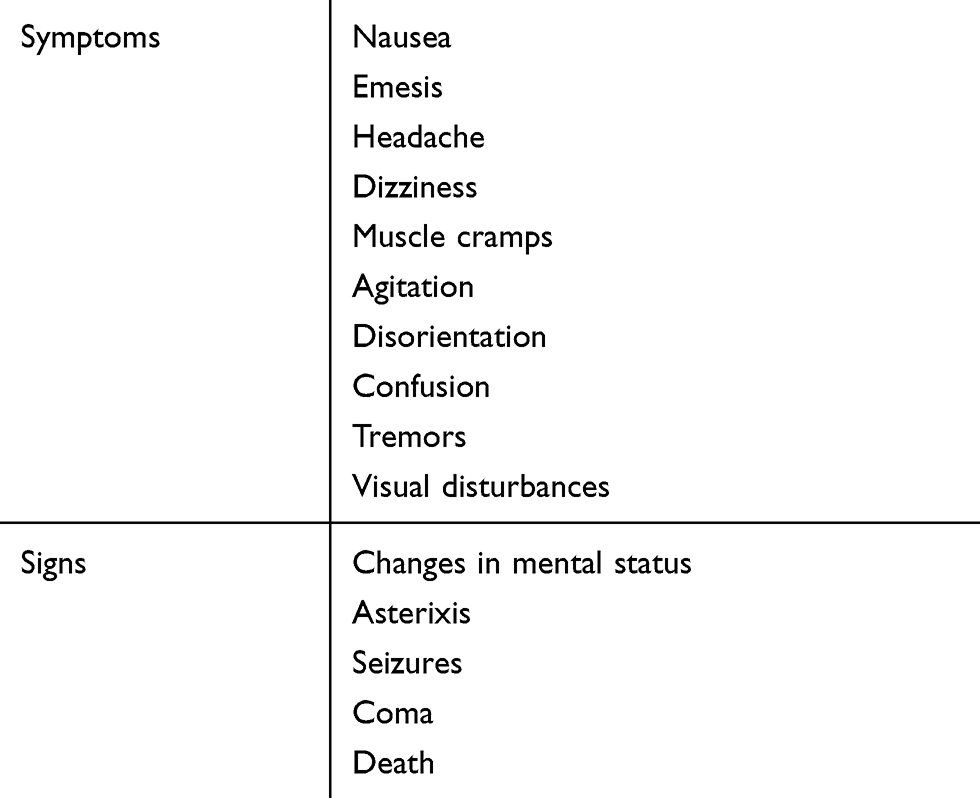 | Table 1 Signs and symptoms of DDS |
Clinical studies in adults and teenagers have shown amelioration of intradialytic headache, cramps, nausea and hypotension with use of sodium modeling, when dialysate sodium is reduced from high (usually 148–149 mmol/L) to normal (usually 138–140 mmol/L) during the course of the hemodialysis treatment compared to a constant sodium dialysate.4,5 This strategy of maintaining a higher plasma sodium, and thus osmolality, during the earliest part of the hemodialysis procedure when solute removal is at its maximum, counterbalances the decrease in osmolality caused by urea and other small solute removal. Additionally, the higher plasma osmolality facilitates intravascular refilling during ultrafiltration, ameliorating hypotension and effects thereof.
DDS is not the only cause of hemodialysis-related headaches, defined by the International Classification of Headache as having no specific characteristics, occurring during dialysis and resolving within 72 hrs of the end of hemodialysis. Other etiologies include hypo- and hypertension, metabolic disturbances like hypoglycemia, hyper- and hyponatremia, hyperphosphatemia, uremia, caffeine deprivation, medication associated, stress and subdural hematomas.6,7 Often, the etiology is multifactorial and appropriate evaluation should be undertaken.
Dialysis was introduced as a potential therapy for renal failure in humans in 1924 by Georg Haas, and DDS was first described in a 1962 Lancet publication.8,9 Since its initial description, our understanding of this serious syndrome has improved. It is evident from animal and human studies that DDS is associated with the development of cerebral edema and increased intracranial pressure.10–12
However, the exact mechanisms by which these events occur remain incompletely understood. Some insight can be acquired from knowledge about urea and water transport in the brain, across the blood–brain barrier and perturbations thereof occurring in the uremic milieu.
Urea transporters and aquaporins in the brain
Since at least the early 1950s, it was shown that urea levels in cerebrospinal fluid (CSF) track with, albeit for the most part remaining slightly lower than plasma levels in humans.13 Urea is an organic compound, the product created by humans and most mammals as a result of protein metabolism. Amino acids, the building blocks of proteins, are broken down by the liver into ammonia. Ammonia is neurotoxic, even in small concentrations, so the liver, via the urea cycle, metabolizes it to a soluble organic 113-Da compound, urea, which is transported to the kidneys where it is freely filtered by the glomerulus and excreted in the urine.
The volume of distribution of urea is large and levels in the brain mirror those in plasma. Urea has low lipid solubility, so although it can move across cell membranes, this movement is slow. The ability of a solute to move across a semipermeable membrane is quantified as a reflection coefficient; a value of 0 means the solute is completely permeable, whereas 1 refers to impermeability. The reflection coefficient of urea at the blood–brain barrier is 0.44.14 Rapid urea transit across cell membranes is facilitated by urea transporters (UTs). There are essentially two classes of UTs, encoded by two genes, each having several isoforms. Urea transporter A (UT-A) has nine isoforms localizing primarily to the kidneys, heart, liver, testis, and colon, whereas urea transporter B (UT-B) has two isoforms localizing to red blood cells, vasa recta and the brain.15 Renal failure results in accumulation of urea in the bloodstream and subsequent increase in brain and CSF urea concentrations.13
Aquaporins (AQPs) are small cell membrane proteins that, in the presence of an osmotic gradient, allow passage of water and sometimes small molecules like carbon dioxide and ammonia.16 Thus far, eleven subtypes of AQPs have been identified in mammals and the degree of expression in different tissues and cells reflect the wide-ranging requirements for the regulation of water movement in various tissues and organs. In the brain, AQP1 localizes to the epithelial cells of the choroid plexus while AQP4 and AQP9 are found on astrocytes, ependymal cells and some neuronal subpopulations.17 Thus, AQPs are important for water movement across the blood–brain barrier and brain–CSF interface.
Animal studies have demonstrated the crucial role of AQP4 channels in the development of cerebral edema under the influence of an osmotic gradient. In mice, deletion of AQP4, the predominant water channel in the brain, was associated with a 35% reduction in cerebral edema under conditions of water intoxication and focal ischemic stroke.18 Furthermore, neurologic outcome in the AQP4 deficient mice was better.
Two theories have been proposed as causing the cerebral edema seen in DDS: (1) the reverse urea effect and (2) idiogenic osmoles.
The case for the reverse urea effect
Chronically uremic patients are in a steady state of hyperosmolality. Since urea equilibrates between the blood, brain, and other tissues, there is no osmotic gradient and thus no water movement associated with uremia. Urea is therefore called an ineffective osmole. Indeed, studies in nephrectomized rats revealed no change in their brain water content.19 Hemodialysis results in rapid removal of urea from the blood, much faster than the rate of equilibration between the brain and bloodstream across the blood–brain barrier, which results in an osmotic gradient that favors water movement into the brain, causing cerebral edema, raised intracranial pressure, and symptoms of DDS.
In their 1962 Lancet manuscript, Kennedy et al reported some patients had worsening symptoms of headache and confusion after hemodialysis.9 Measurement of pre- and post-dialysis CSF urea levels revealed that while CSF levels were comparable to or even slightly lower than blood levels pre-dialysis, by the end of hemodialysis, CSF urea levels remained much higher than blood, suggesting a lag of urea removal from the central nervous system during dialysis. This resulted in a higher gradient between the blood and CSF urea post dialysis; CSF levels remaining higher as blood urea quickly declined during hemodialysis. The authors hypothesized that lowering the blood urea led to fluid accumulation in the brain and raised intracranial pressure, resulting in the neurologic symptoms observed in their patients. This is the reverse of the analogy where intracranial pressure is temporarily reduced utilizing urea infusions by neurosurgeons. In this scenario, the urea infusion raises plasma osmolality, which results in water movement out of the brain and into the bloodstream, thus decreasing cerebral edema and reducing intracranial pressure. It can take up to 12–24 hrs for urea in the brain to equilibrate with blood, and thus during rapid dialysis, urea temporarily becomes an effective osmole, drawing water into the brain.20–22 This theory is called the reverse urea effect.
Interestingly, and providing additional supportive evidence for this theory, the uremic milieu alters expression of both UT-B and AQP proteins in the brains of rats; UT-B1 being reduced by 50% while AQP4 and AQP9 expression increased by 50% or more.23 The magnitude of transport across the AQP channel is determined by its permeability and plenitude in the cell membrane. Thus, it can be conceived that during hemodialysis, urea transport out of brain cells is significantly reduced while water flow into cells becomes more efficient, predisposing to the development of cerebral edema (Figure 1). Clinically, reducing the rate and degree of urea removal from the blood during initiation of hemodialysis has led to a reduction in the incidence of DDS.
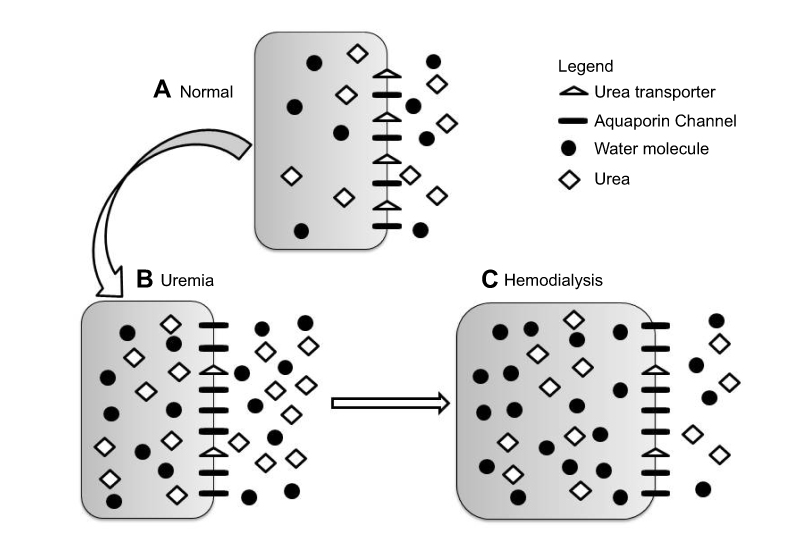 | Figure 1 Changes in brain urea transporter B (UT-B) and aquaporin channels 4 and 9 (AQP4 and AQP9) expression. Reproduced from Tuchman S, Khademian ZP, Mistry K. Dialysis disequilibrium syndrome occurring during continuous renal replacement therapy. Clin Kidney J. 2013;6(5):526–529 by permission of Oxford University Press.26 (A) Normal, non-uremic milieu. (B) During chronic uremia, UT-B expression decreases by approximately 50%, while that of AQP4 and AQP9 increases by 50% or more. Cell volume remains unchanged compared with normal. (C) During rapid urea removal, as occurs during hemodialysis, the reduced number of brain UT-B results in slower movement of urea from the intracellular to extracellular compartment than is removed from the extracellular compartment by dialysis. The resulting osmotic gradient, coupled with increased brain AQP expression, results in water movement into cells, and subsequent cerebral edema. |
Elegant diffusion-weighted magnetic resonance imaging (MRI) studies immediately before and after hemodialysis in rats provides evidence that the cerebral edema occurring in DDS is interstitial rather than cytotoxic.19 Bilaterally nephrectomized rats had no change in their brain water content, suggesting that uremia did not change CNS water content. However, hemodialysis in uremic rats was associated with a significant increase in the apparent diffusion coefficient of brain water, implying that brain extracellular water increases and/or intracellular water decreases after hemodialysis. Since rats dialyzed against urea-containing dialysate did not demonstrate an increase in cerebral water content compared with animals dialyzed against urea-free dialysate, urea was implicated as the agent leading to an osmotic gradient between plasma and interstitial space or CSF, and leading to interstitial cerebral edema.19
There is one small study in humans with ESRD where diffusion-weighted MRI studies revealed that even prior to the first hemodialysis session patients had evidence of interstitial cerebral edema, which worsened following the first hemodialysis treatment.24 The existing cerebral edema is thought to be secondary to abnormalities induced by uremia in the blood–brain barrier.25
It is likely that the scenario is more complex, and the mechanism of developing cerebral edema in uremia may include a varying combination of osmotic, vasogenic, and cytotoxic edema. Two pediatric patients with severe uremia and acidosis undergoing continuous renal replacement therapy (CRRT) developed DDS, and MRI revealed evidence of cytotoxic and vasogenic white matter edema in both patients.26 One of the patients had severe acute kidney injury (AKI) and no cerebral edema on head CT scan preceding initiation of renal replacement therapy. The patients, aged between 14 and 11 years, with BUNs of 210 and 214 mg/dL secondary to advanced chronic kidney disease (CKD) and AKI, respectively, were also significantly acidotic at presentation, with serum bicarbonates of 7 and 13 mmol/L, respectively. The patient with CKD had no other electrolyte abnormalities and developed seizures after 14 hrs on CRRT when urea was reduced by 65% of the pre-CRRT level and serum osmolality decreased by 42 mmol/kg. The patient with AKI presented with mental status changes and severe hypernatremic dehydration (serum sodium 174 mmol/L). Initial head CT revealed no brain abnormalities. Ten hours after CRRT was initiated, neurologic signs of clonus developed, at which time despite a modest 23% urea reduction, serum osmolality had decreased by 38 mmol/kg. In both patients, CRRT was discontinued and mannitol administered with resultant improvement in neurologic status. Both patients made a full neurologic, and in the patient with AKI, renal recovery. These cases underscore the importance of both the extent as well as the rate of urea and osmolality reduction, in the pathogenesis of DDS.
Generation of idiogenic osmoles
Hyperosmolality secondary to chronic hyperglycemia and hypernatremia is accompanied by an adaptive response by the cerebral cortex whereby unidentified solutes called idiogenic osmoles are generated.27,28 These intracellular osmoles prevent the generation of an osmotic gradient between plasma and cerebral cells, protecting the brain from dehydration. Rapid correction of the hyperglycemia and/or hypernatremia leads to an osmotic gradient between the brain and plasma, favoring water movement into the brain with resultant cerebral edema.27
In a 1973 publication, Arieff et al proposed that during rapid hemodialysis of dogs, a similar process occurred and new osmotically active particles, idiogenic osmoles, are created by the brain.29 It is these osmolytes and not urea, which results in maintenance of intracellular hyperosmolality, with consequent development of cerebral edema during rapid hemodialysis. Similar to previous studies, this study also showed that urea removal from the cerebral cortex and CSF lags behind that of plasma during hemodialysis. Brain osmolality was higher in animals undergoing rapid dialysis compared with slow dialysis, and the difference could not be accounted for by sodium, potassium, chloride and urea, leading to the hypothesis that unmeasured idiogenic osmoles were generated. One caveat of this study is that cortical brain urea was measured after the development of cerebral edema and thus could have been diluted. Since brain urea was not corrected for dry weight, its contribution to the cerebral hyperosmolality may have been underestimated.
It seems unlikely that generation of idiogenic organic osmoles plays a significant role in the development of DDS associated with CKD. Two studies in rats demonstrated this. In one study, rats underwent rapid hemodialysis 42 hrs after bilateral ureteral ligation.30 Those animals undergoing rapid dialysis had an increase in brain water content and higher brain to plasma urea ratios compared with non-dialyzed uremic controls. There was no significant difference in the brain content of sodium and potassium between groups and major organic osmolytes (glutamine, glutamate, taurine and myoinositol) did not increase significantly after rapid dialysis. The retention of brain urea despite the large decrease in plasma urea concentration was able to account for the increase in brain water observed in rapidly dialyzed animals.
In another study, the role of organic osmolytes (eg, inositol, taurine, glutamine, glutamate, glycerophosphorylcholine and creatinine) in AKI and CKD was examined in rats.31 A similar response to that seen in hyperglycemia and hypernatremia was observed in animals with AKI but not in chronic uremia. Thus, acutely in the first 48 hrs, idiogenic osmoles are generated in the brain to prevent fluid shifts and cellular dehydration. However, as urea equilibrates across the cerebral cell membranes, the role of idiogenic osmoles is reduced and chronic uremia is not associated with the accumulation of organic osmolytes in brain cells.31 This may partly explain the DDS seen in patients with AKI while on CRRT, as described by Tuchman et al.26
The role of metabolic acidosis, cerebral acidosis and anemia
AKI and CKD are frequently complicated by metabolic acidosis, which can be severe and often accompanied by appropriate compensatory hyperventilation to maintain pH. There is much debate as to the ideal timeframe within which metabolic acidosis should be corrected due to the concern of paradoxical brain and CSF acidosis. When bicarbonate is rapidly administered, increasing blood pH, the partial pressure of carbon dioxide (PCO2) rises due to abatement of compensatory hyperventilation and conversion of the bicarbonate to carbon dioxide (CO2) by carbonic anhydrase.32 The CO2 rapidly diffuses into the brain and CSF, forming carbonic acid and decreasing CSF pH. The excess hydrogen ions displace bound sodium and potassium, which together with formation of organic acids, increase intracellular osmolality and promote cerebral edema.33,34
Hemodialysis results in a relatively rapid correction of metabolic acidosis primarily using bicarbonate-containing dialysate. Uremic dogs undergoing hemodialysis had significant increases in intracranial pressure compared to controls. Furthermore, and importantly, animals dialyzed against a higher bicarbonate bath, 20 vs 28 mmol/L, had higher intracranial pressure.10 Studies in children with diabetic ketoacidosis revealed that those with low PCO2 and high BUN at presentation treated with bicarbonate therapy were at increased risk of cerebral edema.35 Metabolic acidosis is a known risk factor for the development of DDS, and rapid correction during the hemodialysis procedure may play a role.
An additional factor playing a role is the effect of acid–base perturbations on the oxyhemoglobin dissociation curve. Metabolic acidosis, commonly associated with renal failure, is accompanied by a shift of the oxyhemoglobin curve to the right, thus at a given partial pressure of oxygen the percent oxygen saturation of hemoglobin is reduced, meaning hemoglobin releases oxygen and tissue oxygen delivery is increased. Anemia, another common complication of CKD, is an additional stimulus for shifting the oxyhemoglobin curve to the right.
Studies in humans have shown a right shift of the oxyhemoglobin curve in uremic patients, and it shifts to the left during and after dialysis.36,37 The rising alkalization during dialysis leads to an acute increase in affinity for oxygen by hemoglobin, adversely affecting tissue oxygenation and contributing to tissue and cerebral hypoxia, which may further contribute to observed neurologic manifestations of DDS.
Prevention of DDS
Recognition of patients at highest risk for DDS (Table 2) is important, providing an opportunity to implement even more cautious clearance in these populations as a preventive strategy. Vulnerable patients include the young and elderly as well as those that are hyperosmolar from severe uremia, hypernatremia and hyperglycemia. Additional risk factors include existing neurologic abnormalities and the presence of metabolic acidosis.
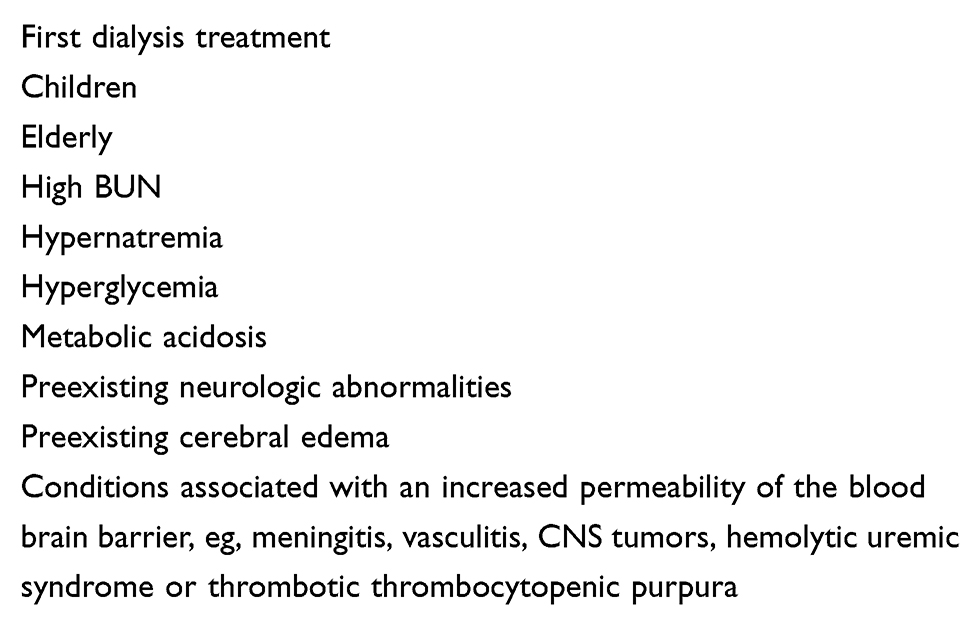 | Table 2 Risk factors for developing DDS |
Since the DDS is primarily the result of osmotic fluid shifts into the brain, avoidance of generation of a significant osmotic gradient between the blood and brain during hemodialysis should prevent the syndrome. This can be achieved using three strategies: 1) reducing clearance so as to lessen the reduction of plasma osmolality, and thus osmotic gradient post dialysis, 2) increasing the time over which clearance is performed and 3) adding another osmotically active agent like sodium or mannitol as urea is removed by hemodialysis, so that plasma osmolality does not change significantly.
There are no controlled trials demonstrating ideal urea clearance and the time on dialysis over which to achieve the clearance in order to prevent DDS. Compared with hemodialysis, a 5-hr hemofiltration treatment has a slower rate of urea reduction and lower post-dialysis CSF urea, that is, a smaller gradient between blood and CSF.38 In this study, hemofiltration reduced symptoms of DDS.
In adults with ESRD, reducing urea by 40% over 2 hrs is generally recommended when initiating dialysis. However, this recommendation is not evidence based and the prescription should be adjusted for less efficient and slower urea clearance in populations at high risk for DDS.
Studies in guinea pigs revealed that a change in plasma osmolality of about 45 mmol/kg is required for cerebral edema to develop.39 Cerebral edema develops in children with hypernatremia when plasma osmolality is decreased by 48 mmol/kg per day, but not 24–28.8 mmol/kg per day; that is to say rapid correction of hypernatremia at a rate of 1 mmol/L per hour results in cerebral edema but not at a slower correction rate of 0.5–0.6 mmol/L per hour.40,41 Hence the current recommendations for correcting chronic hypernatremia at a maximum rate of 0.5 mmol/L per hour or 12 mmol/L per day. This is equivalent to decreasing plasma osmolality by a maximum of 24 mmol/kg per day.
Since the reflection coefficient of sodium is 1 compared with 0.44 for urea, there may be room for allowance of a larger osmotic drop in renal failure as urea equilibrates between the brain and blood. However, as previously mentioned, this equilibration takes time, and hence for several hours during and following the hemodialysis procedure, urea serves as an effective osmole. Furthermore, the up-regulation of AQP and down-regulation of UT-B increases the likelihood of cerebral edema in uremic patients undergoing renal replacement therapy. Thus, targeting the urea reduction so as not to decrease the plasma osmolality by >20–24 mmol/kg per day makes sense. This amounts to urea reduction of not >56–67 mg/dL per day. If, in addition to urea, there are other substances like glucose or sodium contributing to hyperosmolality, then consideration should be given to slower correction of all the osmotically active substances, so as to limit the reduction of plasma osmolality. Supportive evidence of this approach is provided by a report of a patient with severe AKI who developed DDS despite a modest 23% urea reduction over 10 hrs of CRRT because a concomitant correction of hypernatremia led to plasma osmolality decreasing by 38 mmol/kg in 10 hrs.26
It is not only the magnitude of urea reduction but the rate of reduction that is important. In animal studies, dogs dialyzed rapidly over 100 mins developed DDS compared with those dialyzed slowly over 200 mins, despite similar degrees of urea reduction in the two groups.29 It is important to note that in this study, animals dialyzed slowly had raised intracranial pressure, although they did not develop cerebral edema.
Thus, taking measures to limit clearance so as not to reduce plasma osmolality by >20–24 mmol/kg per day, while at the same time selecting for a longer duration of dialysis, should prevent DDS. This can be achieved by choosing smaller dialyzers and reducing the blood flow rate, especially when dialysis is first initiated. Clearance can gradually be increased by approximately 20% daily over 3–4 days to achieve goal urea reduction of approximately 70% during the hemodialysis session. Of course, the more risk factors for DDS present, the slower the rate and degree of urea reduction should be.
In uremic patients with severe fluid overload, consider performing ultrafiltration only followed by hemodialysis, or vice versa, in order to address the volume overload while limiting urea clearance. Plasma osmolality has been shown not to decrease during ultrafiltration alone, making this a safe option.42
Another strategy for reducing the osmotic gradient created by the rapid removal of urea during hemodialysis is to replace the urea with another osmotically active substance during the dialysis procedure, thus maintaining plasma osmolality. The most commonly used agents are sodium and mannitol, less commonly used agents include glucose and urea, while other agents like glycerol in dialysate have not been studied in humans.
Serum sodium can be raised during the dialysis procedure by using hypernatremic dialysate. In a small study, patients undergoing highly efficient hemodialysis, including some for the first time, were monitored clinically and by electroencephalography (EEG). Patients who underwent dialysis maintaining the plasma osmolality using higher dialysate sodium chloride concentrations of 144–154 mmol/L had a significantly lower incidence of EEG changes and none developed symptoms suggestive of DDS compared with controls dialyzed against a standard 133 mmol/L sodium dialysate.43
Similarly, glucose and urea can be added to dialysate. Hyperglycemia induced by high glucose dialysate acts similarly to hypernatremia. Urea can be added to achieve the concentration to which one wants it to equilibrate, limiting the decline of urea concentration irrespective of the efficiency of hemodialysis. However, neither high glucose dialysate nor adding urea to dialysate is readily available for routine clinical use.
In a study evaluating high glucose dialysate (717 mg/dL) and intravenous mannitol (1 g/kg) on plasma osmolality in chronic dialysis patients, it was found that the usual 10 mmol/kg fall in plasma osmolality during hemodialysis was reduced by about 50% to 5.2 mmol/kg with the use of high glucose dialysate, to 4.3 mmol/kg with intravenous mannitol and 1.7 mmol/kg in patients treated with both.44 The investigators found that mild symptoms of DDS decreased from 67% to 10% in these patients, an effect independent of ultrafiltration rate. When used alone, intravenous mannitol is more effective than high glucose dialysate.
In addition to the hyperosmolality, addressing other factors that could contribute to cerebral edema and hypoxia may be important. Using a lower bicarbonate dialysate concentration and improving metabolic acidosis more gradually may ameliorate the adverse effects of rapid alkalization.
Treatment of DDS
The most critical intervention is the prevention of DDS. When neurologic symptoms and signs (Table 2) develop in patients undergoing renal replacement therapy, especially hemodialysis but also CRRT, the differential diagnosis includes uremic, toxic and infectious encephalopathy, electrolyte abnormalities like hyponatremia, hyper-or hypoglycemia, hemorrhagic and ischemic cerebrovascular accidents, subdural hematoma, malignant hypertension, and DDS. There is no diagnostic test for DDS; it is a diagnosis of exclusion.
When DDS is suspected, strong consideration should be given to discontinuing the dialysis treatment. If symptoms are very mild, blood flow rate should be reduced to decrease urea clearance. The patient should be closely monitored and the dialysis session discontinued immediately if symptoms worsen or if severe. Evaluation for other causes of neurologic deterioration should be undertaken (see differential diagnosis above) and appropriately managed.
When it occurs, management of DDS is supportive, as with any other patient with acute neurologic deterioration and suspected raised intracranial pressure and cerebral edema. Maintain the airway and consider hyperventilation. In addition, the cerebral edema can be treated by increasing plasma osmolality with mannitol or hypertonic saline to reduce the osmotic gradient between the blood and brain.44–46 Nevertheless, when advanced and severe, DDS may progress rapidly and be fatal.47 Thus, early recognition of risk factors for DDS in patients beginning renal replacement therapy for severe AKI and/or advanced CKD, and execution of preventive measures is essential in managing these patients and improving outcomes.
Conclusion
The population with renal failure at risk for developing DDS is large, yet the syndrome is rare because measures to prevent it are already part of routine practice. While most commonly associated with advanced CKD and initiation of hemodialysis, DDS can occur in patients with severe AKI and those treated with CRRT. Recognition of patients at high risk, slowing down the efficiency and rate of urea clearance, limiting the decrease in plasma osmolality and avoiding bicarbonate-based rapid correction of metabolic acidosis are strategies for prevention of this syndrome.
Disclosure
The author reports no conflicts of interest in this work.
References
1.
2. Dalia T, Tuffaha AM. Dialysis disequilibrium syndrome leading to sudden brain death in a chronic hemodialysis patient. Hemodial Int. 2018;22(3):E39–E44. doi:10.1111/hdi.12635
3. La Greca G, Biasioli S, Chiaramonte S, et al. Studies on brain density in hemodialysis and peritoneal dialysis. Nephron. 1982;31(2):146–150. doi:10.1159/000182634
4. Acchiardo SR, Hayden AJ. Is Na+ modeling necessary in high flux dialysis? ASAIO Trans. 1991;37(3):M135–137.
5. Sadowski RH, Allred EN, Jabs K. Sodium modeling ameliorates intradialytic and interdialytic symptoms in young hemodialysis patients. J Am Soc Nephrol. 1993;4(5):1192–1198.
6. Sav MY, Sav T, Senocak E, Sav NM. Hemodialysis-related headache. Hemodial Int. 2014;18(4):725–729. doi:10.1111/hdi.12171
7. Milinkovic M, Zidverc-Trajkovic J, Sternic N, et al. Hemodialysis headache. Clin Nephrol. 2009;71(2):158–163.
8. Gottschalk CW, Fellner SK. History of the science of dialysis. Am J Nephrol. 1997;17(3–4):289–298. doi:10.1159/000169116
9. Kennedy AC, Linton AL, Eaton JC. Urea levels in cerebrospinal fluid after haemodialysis. Lancet. 1962;1(7226):410–411.
10. Sitprija V, Holmes JH. Preliminary observations on the change in intracranial pressure and intraocular pressure during hemodialysis. Trans Am Soc Artif Intern Organs. 1962;8:300–308.
11. Lund A, Damholt MB, Strange DG, Kelsen J, Moller-Sorensen H, Moller K. Increased intracranial pressure during hemodialysis in a patient with anoxic brain injury. Case Rep Crit Care. 2017;2017:5378928. doi:10.1155/2017/5378928
12. Krane NK. Intracranial pressure measurement in a patient undergoing hemodialysis and peritoneal dialysis. Am J Kidney Dis. 1989;13(4):336–339.
13. Jenkins WJ. The significance of blood and cerebrospinal fluid urea levels estimated after death. J Clin Pathol. 1953;6(2):110–113.
14. Fenstermacher JD, Johnson JA. Filtration and reflection coefficients of the rabbit blood-brain barrier. Am J Physiol. 1966;211(2):341–346. doi:10.1152/ajplegacy.1966.211.2.341
15. Klein JD, Blount MA, Sands JM. Molecular mechanisms of urea transport in health and disease. Pflugers Arch. 2012;464(6):561–572. doi:10.1007/s00424-012-1157-0
16. Kruse E, Uehlein N, Kaldenhoff R. The aquaporins. Genome Biol. 2006;7(2):206. doi:10.1186/gb-2006-7-8-R72
17. Zelenina M. Regulation of brain aquaporins. Neurochem Int. 2010;57(4):468–488. doi:10.1016/j.neuint.2010.03.022
18. Manley GT, Fujimura M, Ma T, et al. Aquaporin-4 deletion in mice reduces brain edema after acute water intoxication and ischemic stroke. Nat Med. 2000;6(2):159–163. doi:10.1038/72256
19. Galons JP, Trouard T, Gmitro AF, Lien YH. Hemodialysis increases apparent diffusion coefficient of brain water in nephrectomized rats measured by isotropic diffusion-weighted magnetic resonance imaging. J Clin Invest. 1996;98(3):750–755. doi:10.1172/JCI118847
20. Schoolar JC, Barlow CF, Roth LJ. The penetration of carbon-14 urea into cerebrospinal fluid and various areas of the cat brain. J Neuropathol Exp Neurol. 1960;19:216–227.
21. Kleeman CR, Davson H, Levin E. Urea transport in the central nervous system. Am J Physiol. 1962;203:739–747. doi:10.1152/ajplegacy.1962.203.4.739
22. Rosen SM, O’Connor K, Shaldon S. Haemodialysis disequilibrium. Br Med J. 1964;2(5410):672–675.
23. Trinh-Trang-Tan MM, Cartron JP, Bankir L. Molecular basis for the dialysis disequilibrium syndrome: altered aquaporin and urea transporter expression in the brain. Nephrol Dial Transplant. 2005;20(9):1984–1988. doi:10.1093/ndt/gfh877
24. Chen CL, Lai PH, Chou KJ, Lee PT, Chung HM, Fang HC. A preliminary report of brain edema in patients with uremia at first hemodialysis: evaluation by diffusion-weighted MR imaging. AJNR Am J Neuroradiol. 2007;28(1):68–71.
25. Jeppsson B, Freund HR, Gimmon Z, James JH, von Meyenfeldt MF, Fischer JE. Blood-brain barrier derangement in uremic encephalopathy. Surgery. 1982;92(1):30–35.
26. Tuchman S, Khademian ZP, Mistry K. Dialysis disequilibrium syndrome occurring during continuous renal replacement therapy. Clin Kidney J. 2013;6(5):526–529. doi:10.1093/ckj/sft087
27. Arieff AI, Kleeman CR. Studies on mechanisms of cerebral edema in diabetic comas. Effects of hyperglycemia and rapid lowering of plasma glucose in normal rabbits. J Clin Invest. 1973;52(3):571–583. doi:10.1172/JCI107218
28. Lien YH, Shapiro JI, Chan L. Effects of hypernatremia on organic brain osmoles. J Clin Invest. 1990;85(5):1427–1435. doi:10.1172/JCI114587
29. Arieff AI, Massry SG, Barrientos A, Kleeman CR. Brain water and electrolyte metabolism in uremia: effects of slow and rapid hemodialysis. Kidney Int. 1973;4(3):177–187.
30. Silver SM. Cerebral edema after rapid dialysis is not caused by an increase in brain organic osmolytes. J Am Soc Nephrol. 1995;6(6):1600–1606.
31. Trachtman H, Futterweit S, Tonidandel W, Gullans SR. The role of organic osmolytes in the cerebral cell volume regulatory response to acute and chronic renal failure. J Am Soc Nephrol. 1993;3(12):1913–1919.
32. Sabatini S, Kurtzman NA. Bicarbonate therapy in severe metabolic acidosis. J Am Soc Nephrol. 2009;20(4):692–695. doi:10.1681/ASN.2007121329
33. Abeysekara S, Zello GA, Lohmann KL, Alcorn J, Hamilton DL, Naylor JM. Infusion of sodium bicarbonate in experimentally induced metabolic acidosis does not provoke cerebrospinal fluid (CSF) acidosis in calves. Can J Vet Res. 2012;76(1):16–22.
34. Posner JB, Plum F. Spinal-fluid pH and neurologic symptoms in systemic acidosis. N Engl J Med. 1967;277(12):605–613. doi:10.1056/NEJM196709212771201
35. Glaser N, Barnett P, McCaslin I, et al. Risk factors for cerebral edema in children with diabetic ketoacidosis. The Pediatric Emergency Medicine Collaborative Research Committee of the American Academy of Pediatrics. N Engl J Med. 2001;344(4):264–269. doi:10.1056/NEJM200101253440404
36. Raidis PC, Papadimitriou M, Metaxas P, Valtis DJ Haemoglobin oxygen dissociation curve in patients on regular haemodialysis. Proc Eur Dial Transplant Assoc. 1977;14:200–206.
37. Soliani F, Davoli V, Franco V, et al. Intradialytic changes of the oxyhaemoglobin dissociation curve during acetate and bicarbonate haemodialysis. Possible interactions with haemodialysis-associated hypoxaemia. Nephrol Dial Transplant. 1990;5(Suppl 1):119–121.
38. Kishimoto T, Yamagami S, Tanaka H, et al. Superiority of hemofiltration to hemodialysis for treatment of chronic renal failure: comparative studies between hemofiltration and hemodialysis on dialysis disequilibrium syndrome. Artif Organs. 1980;4(2):86–93.
39. Stern WE, Coxon RV. Osmolality of brain tissue and its relation to brain bulk. Am J Physiol. 1964;206:1–7. doi:10.1152/ajplegacy.1964.206.1.1
40. Fang C, Mao J, Dai Y, et al. Fluid management of hypernatraemic dehydration to prevent cerebral oedema: a retrospective case control study of 97 children in China. J Paediatr Child Health. 2010;46(6):301–303. doi:10.1111/j.1440-1754.2010.01712.x
41. Kahn A, Brachet E, Blum D. Controlled fall in natremia and risk of seizures in hypertonic dehydration. Intensive Care Med. 1979;5(1):27–31.
42. Rodriguez M, Pederson JA, Llach F. Effect of dialysis and ultrafiltration on osmolality, colloid osmotic pressure, and vascular refilling rate. Kidney Int. 1985;28(5):808–813.
43. Port FK, Johnson WJ, Klass DW. Prevention of dialysis disequilibrium syndrome by use of high sodium concentration in the dialysate. Kidney Int. 1973;3(5):327–333.
44. Rodrigo F, Shideman J, McHugh R, Buselmeier T, Kjellstrand C. Osmolality changes during hemodialysis. Natural history, clinical correlations, and influence of dialysate glucose and intravenous mannitol. Ann Intern Med. 1977;86(5):554–561.
45. Donegan D, Kashani K. Dialysis disequilibrium syndrome: a swell diagnosis? J Med Cases. 2014;5(8):437–440.
46. DiFresco V, Landman M, Jaber BL, White AC. Dialysis disequilibrium syndrome: an unusual cause of respiratory failure in the medical intensive care unit. Intensive Care Med. 2000;26(5):628–630.
47. Bagshaw SM, Peets AD, Hameed M, Boiteau PJ, Laupland KB, Doig CJ. Dialysis disequilibrium syndrome: brain death following hemodialysis for metabolic acidosis and acute renal failure–a case report. BMC Nephrol. 2004;5:9. doi:10.1186/1471-2369-5-9
 © 2019 The Author(s). This work is published and licensed by Dove Medical Press Limited. The full terms of this license are available at https://www.dovepress.com/terms.php and incorporate the Creative Commons Attribution - Non Commercial (unported, v3.0) License.
By accessing the work you hereby accept the Terms. Non-commercial uses of the work are permitted without any further permission from Dove Medical Press Limited, provided the work is properly attributed. For permission for commercial use of this work, please see paragraphs 4.2 and 5 of our Terms.
© 2019 The Author(s). This work is published and licensed by Dove Medical Press Limited. The full terms of this license are available at https://www.dovepress.com/terms.php and incorporate the Creative Commons Attribution - Non Commercial (unported, v3.0) License.
By accessing the work you hereby accept the Terms. Non-commercial uses of the work are permitted without any further permission from Dove Medical Press Limited, provided the work is properly attributed. For permission for commercial use of this work, please see paragraphs 4.2 and 5 of our Terms.