")
Back to Journals » OncoTargets and Therapy » Volume 9
Diagnostic value of two-dimensional shear wave elastography in papillary thyroid microcarcinoma
Authors Duan S, Yu J, Li X, Han Z, Zhai H, Liang P
Received 19 October 2015
Accepted for publication 15 January 2016
Published 9 March 2016 Volume 2016:9 Pages 1311—1317
DOI https://doi.org/10.2147/OTT.S98583
Checked for plagiarism Yes
Review by Single anonymous peer review
Peer reviewer comments 2
Editor who approved publication: Professor Daniele Santini
Shao-Bo Duan,1,2 Jie Yu,2 Xin Li,2 Zhi-Yu Han,2 Hong-Yan Zhai,2 Ping Liang2
1Department of Interventional Ultrasound, Medical Center Tsinghua University, 2Department of Interventional Ultrasound, PLA General Hospital, Beijing, People’s Republic of China
Objective: The purpose of this study was to evaluate the predictability of two-dimensional shear wave elastography (2D-SWE) for papillary thyroid microcarcinoma (PTMC).
Materials and methods: One hundred and eighteen patients with 137 thyroid nodules (46 benign nodules, 91 malignant nodules) were included in this study who received conventional ultrasound (US) and 2D-SWE before fine-needle aspiration or surgery. The diagnostic performance was compared between US findings only and the combined use of US findings with 2D-SWE, which were correlated with pathology results.
Results: Receiver-operating characteristic curve analysis was performed to assess the diagnostic performance of 2D-SWE. Conventional US findings and 2D-SWE values were analyzed and compared between benign and malignant thyroid nodules. The mean values of SWE_mean, SWE_min, and SWE_max were 46.6±16.7, 26.2±9.5, and 73.6±18.1 kPa, respectively, in PTMC, which were significantly higher than those in benign tumors (27.8±12.4, 15.8±8.6, and 50.3±22.6 kPa, P<0.001). The optimal cut-off values of SWE_mean, SWE_min, and SWE_max for predicting malignancy were 34.5, 21.8, and 53.2 kPa, respectively. Taller than wide, micro-calcification, and SWE_mean were found to be independent risk factors for predicting PTMC. The overall sensitivity, specificity, accuracy, positive predictive value, and negative predictive value of combined conventional US features with 2D-SWE parameters were 95.7%, 94.5%, 94.9%, 89.8%, and 97.7%, respectively; these were superior to those of conventional US (89.1%, 90.1%, 89.9%, 82.0%, and 93.2%).
Conclusion: The study indicates that the quantitative parameters of 2D-SWE are an independent predictive factor for diagnosing PTMC, which could provide valuable information when conventional US cannot give determinate results.
Keywords: shear wave elastography, thyroid nodule, malignancy, diagnostic performance
Introduction
Papillary thyroid microcarcinoma (PTMC) is defined as a papillary thyroid cancer where the maximum diameter is <10 mm.1 Recent studies have suggested that the overall incidence of PTMC is rapidly increasing.2,3 It has been reported that the treatment of PTMC should be tailored to the biological behavior of tumors. For some PTMC, consecutive follow-up with ultrasound (US) every 6 or 12 months is feasible4 because of the wide availability of high-frequency ultrasonic transducers and the improvement of spatial resolution. US is now the preferred imaging method for the screening of thyroid diseases and is one of the most important methods used to monitor patients with PTMC. The feature of firmness and hardness on palpation is known to be associated with a higher risk of malignancy.5
Two-dimensional shear wave elastography (2D-SWE) uses the acoustic radiation force induced by a focused US beam to reach underlying tissues, and an ultrafast US sequence (up to 20,000 Hz) to record the propagation of the shear waves in real time. It does not rely on external compression.6 As a novel, reproducible, and quantitative sonographic technique, 2D-SWE is widely used in diagnosing differential benign and malignant liver, breast, and thyroid lesions.7,8 Several reports about 2D-SWE on the quantitative evaluation of thyroid malignant nodules elasticity showed that the optimal cut-off values vary, ranging from 39.3 to 87.8 kPa.9–12 Therefore, the purpose of this study was to evaluate how valuable 2D-SWE is in predicting PTMC by using biopsy and surgery histopathological references and establishing the optimal cut-off values for predicting PTMC.
Materials and methods
Patients
Between February 2014 and May 2015, 118 patients (75 females and 43 males) with 137 thyroid nodules were enrolled in the study. The mean age was 45.9±13.4 years (range: 18–83 years). The inclusion criteria were as follows: 1) the diameter of thyroid nodules ≤10 mm; 2) patients diagnosed with solid thyroid nodules on US examination, including one or more suspicious characteristics, such as irregular shape, poorly defined margins, absence of halo sign, hypo-echogenicity, and presence of microcalcification; and 3) patients scheduled to undergo fine-needle aspiration or thyroid surgery. Diffuse thyroid disease and nodules with nondiagnostic or indeterminate results were excluded.
Imaging evaluation and measurement
Written informed consent was obtained from all enrolled patients. This study was approved by the ethics committee of PLA General Hospital.
Thyroid US and 2D-SWE scans were performed using a real-time US device (Aixplorer; Supersonic Imagine, Aix en Provence, France) equipped with a linear transducer with 4–15 MHz liner transducer.
The patient was positioned on his or her back with the neck slightly extended over a pillow. After US examination, the transducer was switched to SWE mode. The probe was applied as lightly as possible to the lesion to minimize the compression artifact. The probe must be kept still during image acquisition. The patient was requested not to breathe for a few seconds to avoid influencing the results. After a stable image was recorded, a region of interest was chosen to cover the lesion and a part of normal thyroid parenchyma to calculate elasticity value. Maximum, mean, and minimum elasticity and elasticity ratio between lesions and the surrounding parenchyma were recorded. Three regions of interest in the lesion and peripheral parenchyma were selected; the average values were used to calculate the final value.
Statistical analysis
SPSS 18.0 software was applied to all the statistical analyses in our study. Descriptive statistics were applied to all collected variables expressed as frequency tables for categorical data or mean values ± standard deviations for continuous data. Student’s t-tests or Mann–Whitney tests were used to assess the differences between two groups of quantitative variables. Links between these two qualitative variables were estimated using a chi-square test or Fisher’s exact test. The diagnostic value of SWE in distinguishing between benign and malignant nodules was analyzed by means of the receiver-operating characteristic curve and calculated area under the curve. Using this curve to establish a cut-off point, we established sensitivity and specificity values and likelihood ratios. Logistic regression analysis was used to assess independent factors for predicting malignancy of each suspicious conventional US finding and each optimal cut-off value. For all analyses, P-value <0.05 was considered statistically significant.
Results
Patients
The mean size of the 137 thyroid nodules was 6.0±3.2 mm, ranging from 2 to 10 mm. Fifty-seven nodules were located in the right lobe, 66 in the left, and 14 in the isthmus. Of the 137 cases, 91 cases had a final diagnosis of malignancy based on histological evidence of PTMC. Benign nodules included nodular goiter (n=20), follicular adenomas (n=16), eosinophilia granuloma (n=7), and Hashimoto pseudo-nodule (n=3). The characteristics of the nodules are reported in Table 1.
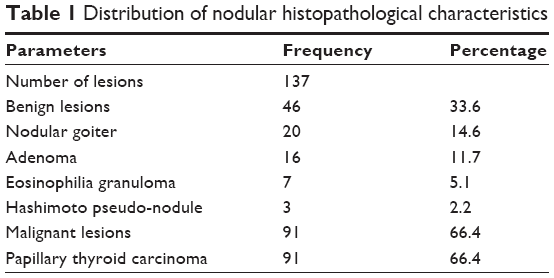 | Table 1 Distribution of nodular histopathological characteristics |
Conventional US features
The following conventional US features were recorded as the suspicious characteristics of PTMC: hypoechogenicity, irregular margin, shape (taller than wide), halo sign, micro-calcification, and vascularity. The corresponding sensitivity, specificity, accuracy, positive predictive value (PPV), and negative predictive value (NPV) are shown in Table 2. Hypo-echogenicity and absence of halo sign had higher sensitivities (82.4% and 85.7%). The overall sensitivity, specificity, accuracy, PPV, and NPV of conventional US were 89.1%, 90.1%, 89.9%, 82.0%, and 93.2%, respectively.
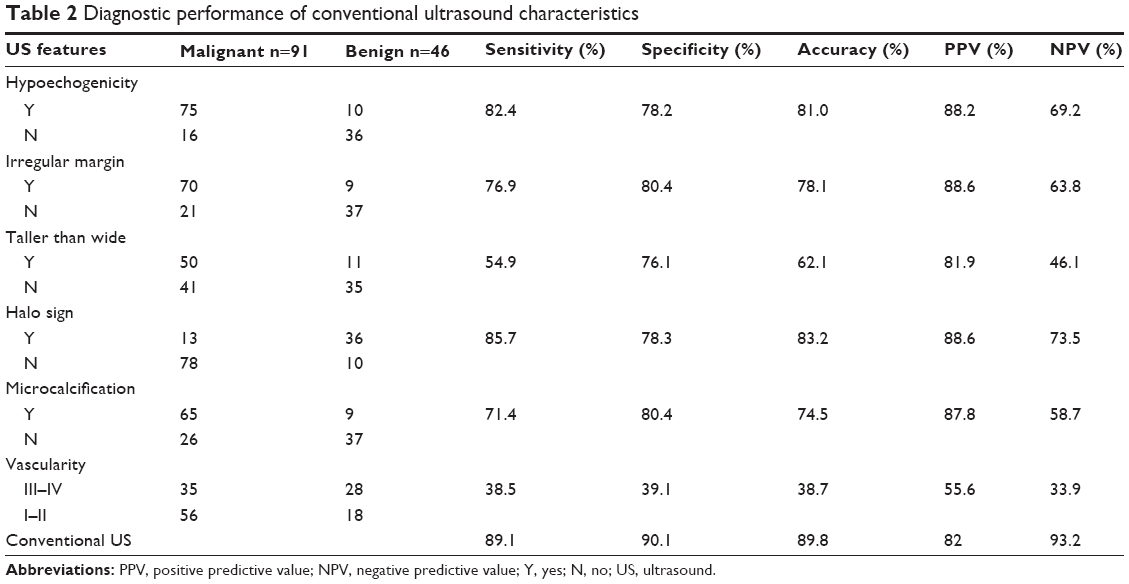 | Table 2 Diagnostic performance of conventional ultrasound characteristics |
Shear wave elastography
The values of SWE_mean and SWE_min (46.6±16.7 and 26.2±9.5 kPa) in PTMC were significantly higher than those in benign tumors (27.8±12.4 and 15.8±8.6 kPa, P<0.01). The value of SWE_max (73.6±18.1 kPa) in PTMC was higher than that in benign tumors (50.3±22.6 kPa, P>0.05), and there was no statistical significance (Table 3). The optimal cut-off values (SWE_mean, SWE_min, and SWE_max) for predicting malignancy were 34.5, 21.8, and 53.2 kPa, respectively (Table 4). The area under the curve of SWE_mean, SWE_min, and SWE_max was 0.789, 0.703, and 0.701, respectively (Table 4). The diagnostic performance of each value in predicting PTMC is shown in Figure 1. This result suggested that SWE_mean had more sensitivity and specificity in predicting PTMC. Figures 2 and 3 show typical nodules correctly classified by 2D-SWE.
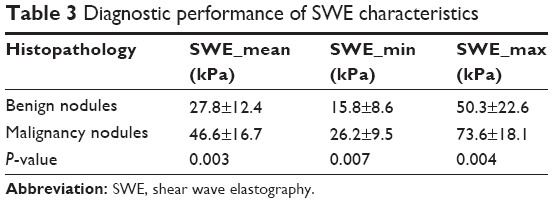 | Table 3 Diagnostic performance of SWE characteristics |
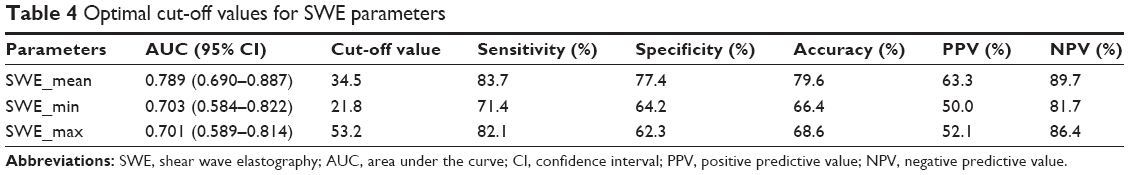 | Table 4 Optimal cut-off values for SWE parameters |
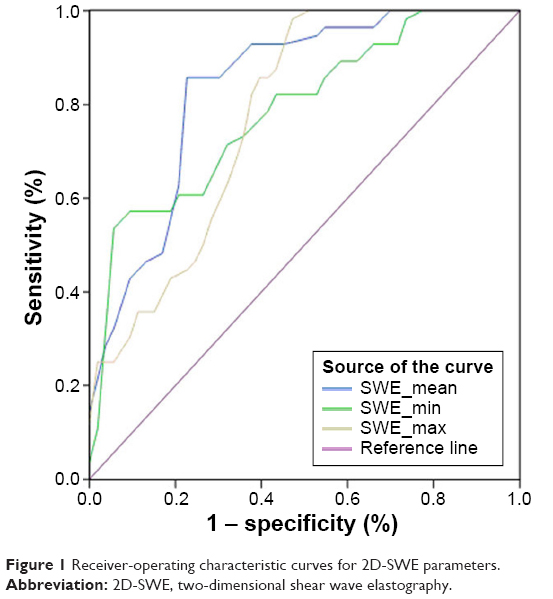 | Figure 1 Receiver-operating characteristic curves for 2D-SWE parameters. |
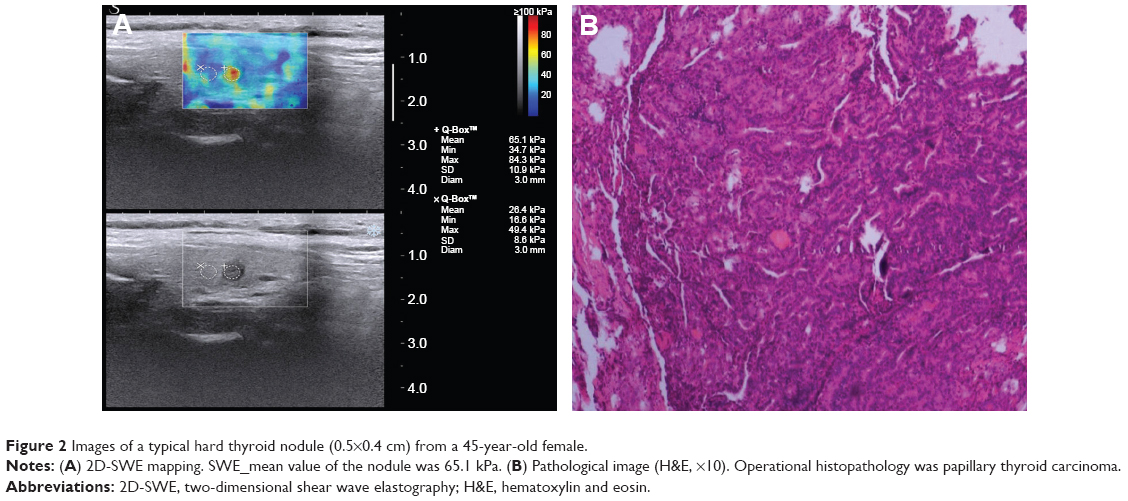 | Figure 2 Images of a typical hard thyroid nodule (0.5×0.4 cm) from a 45-year-old female. |
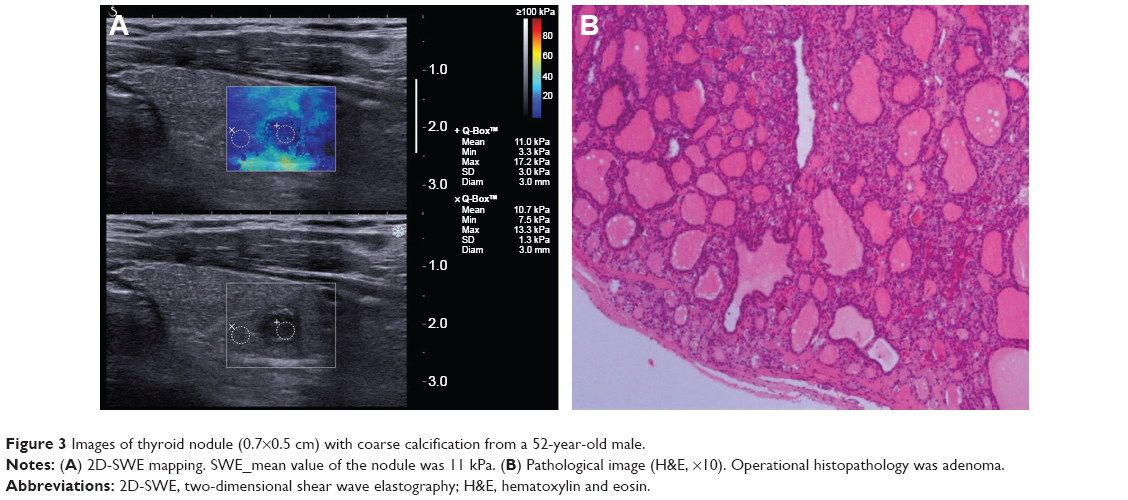 | Figure 3 Images of thyroid nodule (0.7×0.5 cm) with coarse calcification from a 52-year-old male. |
Multivariate logistic regression analysis for predicting PTMC
In univariate logistic regression analysis, each suspicious conventional US finding and the cut-off value were statistically significant predictors of PTMC: hypoechogenicity (odds ratio [OR] =0.280, P=0.009), taller than wide (OR =9.006, P=0.003), microcalcification (OR =4.667, P=0.015), and SWE_mean (OR =2.083, P=0.037). Taller than wide (OR =5.461, P=0.019), microcalcification (OR =2.239, P=0.049), and SWE_mean (OR =6.025, P=0.031) were found to be independent risk factors for predicting PTMC by multivariate analysis (Table 5).
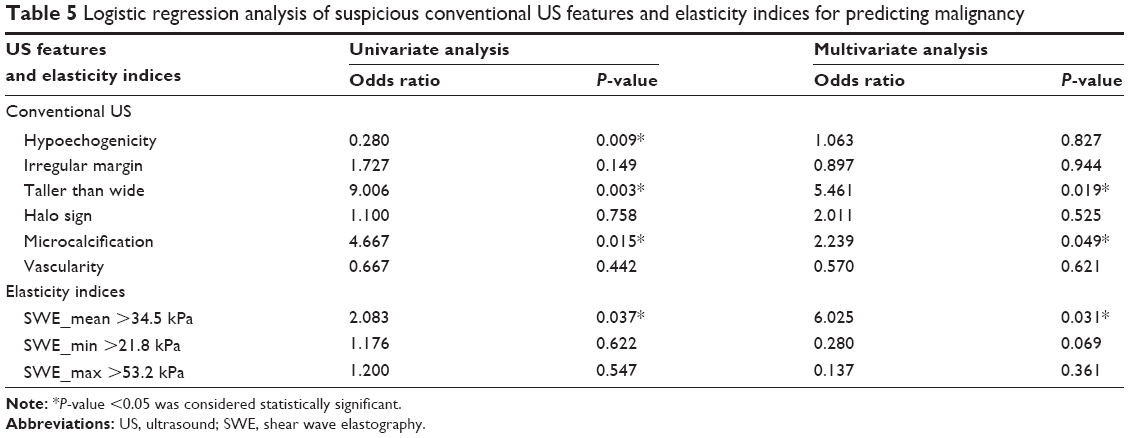 | Table 5 Logistic regression analysis of suspicious conventional US features and elasticity indices for predicting malignancy |
Comparison of conventional US and combined conventional US with 2D-SWE
The overall sensitivity, specificity, accuracy, PPV, and NPV of combined conventional US features with 2D-SWE parameters were 95.7%, 94.5%, 94.9%, 89.8%, and 97.7%, which were superior to those of conventional US (89.1%, 90.1%, 89.9%, 82.0%, and 93.2%), respectively. This indicates that the quantitative parameters of 2D-SWE provide useful and additional information for diagnosing PTMC, which improved the diagnosis efficiency.
Discussion
The treatment for patients with PTMC remains a debatable topic. Although the majority of PTMC are considered indolent and innocuous, some may be inclined to aggressive behaviors.13,14 High rates of invasiveness, lymph node metastases, and distant organ metastases were also reported in several experiments. Therefore, it is necessary to make an early and accurate diagnosis of PMTC.15,16
It is well known that US is one of the most valuable tools for diagnosing thyroid diseases, but, up until now, no single US pattern could be used as a definite criterion of malignancy. 2D-SWE, as a novel developed quantitative elastography, does not require the compression of the tissues and depends less on the individual operator during the examination. Therefore, the information obtained is more objective and can be reproduced more easily.17 The quantitative parameters of elastography reported differ significantly between malignant and benign lesions.18–21
To our knowledge, the study on the value of 2D-SWE in diagnosing PTMC is seldom, and the optimal cut-off value is not consistent. One previously study referred to the value of 2D-SWE in differentiating PTMC. Unfortunately, only 19 nodules were evaluated in their study; the majority of the microcarcinomas were missed by 2D-SWE.22 The latest study by Kim et al reported that the SWE_mean was significantly higher in papillary thyroid carcinoma (85.52±41.94 kPa) than in benign thyroid nodules, in which 49.4% nodules included were <1 cm.12 Therefore, further study to evaluate the value of 2D-SWE in diagnosing PTMC and determine the optimal cut-off value is needed.
In our study, the SWE_mean was significantly higher in PTMC (46.6±16.7 kPa) than in benign thyroid nodules (27.8±12.4 kPa). The SWE_max and SWE_min were also significantly higher in malignant tumors (73.6±18.1 and 26.2±9.5 kPa) than those in benign nodules (50.3±22.6 and 15.8±8.6 kPa). Fukuhara et al’s study showed that while the normal thyroid tissue had a low cell density, the benign thyroid nodules had a high cell density. The PTMC had a mixed pathologic structure with solid cells, fibrosis, and adipose tissue.23 This result demonstrated that the shear wave velocity was critically increased in fibrotic tissue, and was only mildly influenced by cellular density. The shear wave velocity of malignant samples was significantly higher than those of benign nodules, which was inconsistent with the result of our study.
The result of our study also showed that the optimal cut-off value for predicting malignancy was in accordance with previous reports (SWE_mean: 34.5 kPa; SWE_min: 30.0 kPa; SWE_max: 55.8 kPa). The sensitivity and specificity were 83.7% and 77.4%, 71.4% and 64.2%, and 82.1% and 62.3%, respectively. When combined with the conventional US features, the overall sensitivity, specificity, accuracy, PPV, and NPV were 95.7%, 94.5%, 94.9%, 89.8%, and 97.7%, respectively; these were higher than those of conventional US (89.1%, 90.1%, 89.9%, 82.0%, and 93.2%). According to Sebag et al’s report,18 the combination of the higher value (>65 kPa) and gray-scale US finding increased the diagnostic performance with a sensitivity of 81.5% and a specificity of 97%. The result of Veyrieres et al’s study also showed that association of higher value (>66 kPa) and morphological features presented elevated sensitivity (97%) and NPV (99.5%).19 These findings suggest that SWE can be used as a feasible technique to provide quantitative information of tissue stiffness. It is of great value to differentiate small thyroid nodules, combined with conventional US.
Our study comprehensively analyzed the value of each US feature in differential diagnosis of benign and malignant nodules by using binary logistic regression analysis. In univariate logistic regression analysis, hypoechogenicity, taller-than-wide shape, microcalcification, and SWE_mean value were found to be the significant predictors of thyroid malignancy, while only taller-than-wide shape, micro-calcification, and SWE_mean value were the independent predictors of thyroid malignancy in multivariate logistic regression analysis. In fact, microcalcification is considered a specific sign of malignancy; macrocalcifications were usually features of benignity observed by conventional US. Liu et al reported that microcalcification was the most predictive index of the conventional US features in the diagnosis of thyroid malignancy with the highest sum of sensitivity and specificity and the accuracy can achieve 76.6%.21 Furthermore, Park et al reported a retrospective analysis of 476 thyroid nodules in 453 patients. The multivariate regression analysis result showed that microcalcification or mixed calcification, taller-than-wide shape, SWE_mean, and SWE_max were the independent predictors for the diagnosis of thyroid malignancy.20
There were several limitations in our study. First, the patients enrolled in this study were scheduled for fine-needle aspiration or surgical excision, which may result in selection bias that benign nodules were relatively fewer than the literatures. Second, the number of involved nodules was small; the malignant nodules were only papillary carcinoma. Previous studies reported that elasticity values of 2D-SWE were different in various pathology types of thyroid nodules. Therefore, further prospective studies with larger samples are needed in the future.
Conclusion
In summary, the results of the present study indicate that 2D-SWE is a promising imaging technique. Quantitative parameters of 2D-SWE are an independent predictive factor for diagnosing PTMC. This could provide valuable information when conventional US cannot produce determinate results.
Acknowledgments
This paper was supported by the National Natural Science Foundation of China (grant numbers 81127006 and 81430039) and by the National Key Technology Research and Development Programme of China (2013BAI01B01).
Disclosure
The authors alone are responsible for the content and writing of the paper and report no conflicts of interest.
References
Cooper DS, Doherty GM, Haugen BR, et al. Revised American Thyroid Association management guidelines for patients with thyroid nodules and differentiated thyroid cancer. Thyroid. 2009;19(11):1167–1214. | ||
Cramer JD, Fu P, Harth KC, Margevicius S, Wilhelm SM. Analysis of the rising incidence of thyroid cancer using the Surveillance, Epidemiology and End Results National Cancer Data Registry. Surgery. 2010;148(6):1147–1152. | ||
Hughes DT, Haymart MR, Miller BS, Gauger PG, Doherty GM. The most commonly occurring papillary thyroid cancer in the United States is now a microcarcinoma in a patient older than 45y. Thyroid. 2011;21(3):231–236. | ||
Sugitani I, Toda K, Yamada K, Yamamoto N, Ikenaga M, Fujimoto Y. Three distinctly different kinds of papillary thyroid microcarcinoma should be recognized: our treatment strategies and outcomes. World J Surg. 2010;34(6):1222–1231. | ||
Gharib H, Papini E, Paschke R, et al. American Association of Clinical Endocrinologists, Associazione Medici Endocrinologi, and European Thyroid Association Medical Guidelines for Clinical Practice for the Diagnosis and Management of Thyroid Nodules: Executive summary of recommendations. J Endocrinol Invest. 2010;33(5):287–291. | ||
Chang JM, Moon WK, Cho N, et al. Clinical application of shear wave elastography (SWE) in the diagnosis of benign and malignant breast diseases. Breast Cancer Res Treat. 2011;129(1):89–97. | ||
Lee BE, Chung J, Cha ES, Lee JE, Kim JH. Role of shear-wave elastography (SWE) in complex cystic and solid breast lesions in comparison with conventional ultrasound. Eur J Radiol. 2015;84(7):1236–1241. | ||
Kim HJ, Lee HK, Cho JH, Yang HJ. Quantitative comparison of transient elastography (TE), shear wave elastography (SWE) and liver biopsy results of patients with chronic liver disease. J Phys Ther Sci. 2015;27(8):2465–2468. | ||
Szczepanek-Parulska E, Woliński K, Stangierski A, et al. Comparison of diagnostic value of conventional ultrasonography and shear wave elastography in the prediction of thyroid lesions malignancy. PLoS One. 2013;8(11):e81532. | ||
Park YJ, Kim J, Son EJ, et al. Quantitative shear wave elastography as a prognostic implication of papillary thyroid carcinoma (PTC): elasticity index can predict extrathyroidal extension (ETE). Ann Surg Oncol. 2013;20(8):2765–2771. | ||
Magri F, Chyteris S, Capelli V, et al. Shear wave elastography in the diagnosis of thyroid nodules: feasibility in the case of coexistent chronic autoimmune Hashimoto’s thyroiditis. Clin Endocrinol. 2012;76(1):137–141. | ||
Kim H, Kim JA, Son EJ, Youk JH. Quantitative assessment of shear-wave ultrasound elastography in thyroid nodules: diagnostic performance for predicting malignancy. Eur Radiol. 2013;23(9):2532–2537. | ||
Malandrino P, Pellegriti G, Attard M, et al. Papillary thyroid microcarcinomas: a comparative study of the characteristics and risk factors at presentation in two cancer registries. J Clin Endocrinol Metab. 2013;98(4):1427–1434. | ||
Rossi ED, Martini M, Capodimonti S, et al. BRAF (V600E) mutation analysis on LBC-processed aspiration biopsies predicts bilaterality and nodal involvement in papillary thyroid microcarcinoma. Cancer Cytopathol. 2013;121(6):291–297. | ||
Pellegriti G, Scollo C, Lumera G, et al. Clinical behavior and outcome of papillary thyroid cancers smaller than 1.5 cm in diameter: study of 299 cases. J Clin Endocrinol Metab. 2004;89(8):3713–3720. | ||
Elisei R, Molinaro E, Agate L, et al. Have the clinical and pathological features of differentiated thyroid carcinoma really changed over the last 35 years? Study on 4187 patients from a single Italian institution to answer this question. J Clin Endocrinol Metab. 2010;95(4):1516–1527. | ||
Tanter M, Bercoff J, Athanasiou A, et al. Quantitative assessment of breast lesion viscoelasticity: initial clinical results using supersonic shear imaging. Ultrasound Med Biol. 2008;34(9):1373–1386. | ||
Sebag F, Vaillant-Lombard J, Berbis J, et al. Shear wave elastography: a new ultrasound imaging mode for the differential: diagnosis of benign and malignant thyroid nodules. J Clin Endocrinol Metab. 2010;95(12):5281–5288. | ||
Veyrieres JB, Albarel F, Lombard JV, et al. A threshold value in shear wave elastography to rule out malignant thyroid nodules: a reality? Eur J Radiol. 2012;81(12):3965–3972. | ||
Park AY, Son EJ, Han K, Youk JH, Kim JA, Park CS. Shear wave elastography of thyroid nodules for the prediction of malignancy in a large-scale study. Eur J Radiol. 2015;84(3):407–412. | ||
Bhatia KS, Tong CS, Cho CC, Yuen EH, Lee YY, Ahuja AT. Shear wave elastography of thyroid nodules in routine clinical practice: preliminary observations and utility for detecting malignancy. Eur Radiol. 2012;22(11):2397–2406. | ||
Liu BX, Xie XY, Liang JY, et al. Shear wave elastography versus real-time elastography on evaluation thyroid nodules: a preliminary study. Eur J Radiol. 2014;83(7):1135–1143. | ||
Fukuhara T, Matsuda E, Endo Y, et al. Correlation between quantitative shear wave elastography and pathology structures of thyroid lesions. Ultrasound Med Biol. 2015;41(9):2326–2332. |
 © 2016 The Author(s). This work is published and licensed by Dove Medical Press Limited. The full terms of this license are available at https://www.dovepress.com/terms.php and incorporate the Creative Commons Attribution - Non Commercial (unported, v3.0) License.
By accessing the work you hereby accept the Terms. Non-commercial uses of the work are permitted without any further permission from Dove Medical Press Limited, provided the work is properly attributed. For permission for commercial use of this work, please see paragraphs 4.2 and 5 of our Terms.
© 2016 The Author(s). This work is published and licensed by Dove Medical Press Limited. The full terms of this license are available at https://www.dovepress.com/terms.php and incorporate the Creative Commons Attribution - Non Commercial (unported, v3.0) License.
By accessing the work you hereby accept the Terms. Non-commercial uses of the work are permitted without any further permission from Dove Medical Press Limited, provided the work is properly attributed. For permission for commercial use of this work, please see paragraphs 4.2 and 5 of our Terms.