")
Back to Journals » Journal of Blood Medicine » Volume 12
Diagnostic Value of Neutrophil Lymphocyte Ratio and D-Dimer as Biological Markers of Deep Vein Thrombosis in Patients Presenting with Unilateral Limb Edema
Authors Rinaldi I , Hamonangan R, Azizi MS, Cahyanur R , Wirawan F, Fatya AI, Budiananti A, Winston K
Received 9 November 2020
Accepted for publication 26 March 2021
Published 20 May 2021 Volume 2021:12 Pages 313—325
DOI https://doi.org/10.2147/JBM.S291226
Checked for plagiarism Yes
Review by Single anonymous peer review
Peer reviewer comments 2
Editor who approved publication: Dr Martin H Bluth
Ikhwan Rinaldi,1 Rachmat Hamonangan,2 Mohamad Syahrir Azizi,3 Rahmat Cahyanur,1 Fadila Wirawan,4 Atikah Isna Fatya,4 Ageng Budiananti,4 Kevin Winston4
1Division of Hematology and Medical Oncology, Department of Internal Medicine, Cipto Mangunkusumo National General Hospital, Faculty of Medicine, Universitas Indonesia, Jakarta, 10430, Indonesia; 2Department of Internal Medicine, PGI Cikini Hospital, Jakarta, Indonesia; 3Division of Cardiology, Department of Internal Medicine, Cipto Mangunkusumo National General Hospital, Faculty of Medicine, Universitas Indonesia, Jakarta, Indonesia; 4Department of Internal Medicine, Faculty of Medicine, Universitas Indonesia, Jakarta, Indonesia
Correspondence: Ikhwan Rinaldi
Division of Hematology and Medical Oncology, Department of Internal Medicine, Cipto Mangunkusumo National General Hospital, Faculty of Medicine, Universitas Indonesia, Jakarta, 10430, Indonesia
Tel +62 811177997
Email [email protected]
Introduction: Patients with deep vein thrombosis (DVT) pose high morbidity and mortality risk thus needing fast and accurate diagnosis. Wells clinical prediction scores with D-dimer testing are traditionally used to rule out patients with low probability of DVT. However, D-dimer testing has a few limitations regarding its relatively low specificity. Neutrophil-lymphocyte ratio (NLR), a marker of inflammation, was found to increase in DVT. Hence, we aimed to evaluate the role of NLR for DVT diagnosis.
Methods: Data were collected from medical records of patients with suspected DVT at Cipto Mangunkusumo National General Hospital during January–December 2014. Diagnosis of DVT was conducted using lower limb ultrasonography. Diagnostic values for NLR, D-dimer, and NLR + D-dimer were determined by receiver operating characteristic (ROC) analysis to obtain area under the curve (AUC), sensitivity, specificity, negative predictive value, and positive predictive values. Sensitivity and specificity analyses of NLR and D-dimer were also conducted based on Wells score and divided into groups of low and high probability of DVT.
Results: The AUC values for NLR, D-dimer, and NLR + D-dimer were 72.6%, 70.4%, and 76.1%, respectively. The optimal cut-off value determined for NLR was 5.12 with sensitivity of 67.7%, specificity of 67.9%, PPV of 68.85%, and NPV of 64.91% in differentiating subjects with and without DVT. This study also found that D-dimer had sensitivity of 69.4%, specificity of 71.4%, PPV of 72.88%, and NPV of 67.8%. Meanwhile, the NLR + D-dimer combination had sensitivity of 66.1% and specificity of 72.6%. Multivariate analysis showed that NLR (OR: 2.636; 95% CI: 1.144– 6.076; p: 0.023) and D-dimer (OR: 4.175; 95% CI: 1.810– 9.633; p: 0.001) were associated with DVT.
Conclusion: NLR value has wider AUC than D-Dimer and is relatively easier to obtain and does not require specific assay, thus enabling rapid evaluation of symptomatic patients suspected of having DVT. Adding NLR to D-dimer increased AUC to detect DVT. Therefore, NLR could serve as a complementary diagnostic tool for D-dimer to exclude DVT, especially in low clinical probability patients.
Keywords: deep vein thrombosis, neutrophils lymphocyte ratio, NLR, inflammation, D-dimer
Introduction
Deep vein thrombosis (DVT) is a form of venous thromboembolism, which is the third most common cardiovascular disorder.1 DVT is present in about two thirds in a group of venous thromboembolism that affects around 300,000–600,000 individuals in the US.2 DVT poses a high risk of mortality and long-term complications if not treated properly.3 Therefore, accurate diagnosis is imperative to initiate prompt treatment and prevent mortality. However, the diagnosis of DVT still remains a challenge for physicians due to lack of symptoms’ accuracy.1,4
Venography as the gold standard for DVT diagnosis is rarely used nowadays due to its invasive property, high cost, and the requirement to use contrast agent.2,5,6 Currently, venous ultrasonography is the first imaging modality choice for DVT diagnosis due to its high sensitivity and specificity, although the diagnostic value is limited for distal thrombosis.5–9 On the other hand, performing ultrasonography for all patients suspected of having DVT is not a cost-effective approach as it is time-consuming and expensive.10 Finally, not all physicians are trained to use venous ultrasonography. Hence, current practice implements the use of clinical prediction scores to estimate pretest probability of DVT. One of the most commonly used scores is Wells score for DVT which has been widely validated. Wells score considers clinical features and risk factors for DVT to categorize patients as high probability (Wells score ≥ 2) and low probability (Wells score < 2).4,11
While high probability Wells scores should be followed by diagnostic imaging to confirm the diagnosis, low probability scores are not enough to safely rule out suspected DVT inpatients. Therefore, Wells score should be used in conjunction with other diagnostic testing such as D-dimer.11 D-dimer is a fibrin degradation product which may be elevated in DVT and other conditions such as pregnancy, infection, malignancy, and trauma. D-dimer test is highly sensitive but not specific in diagnosing DVT. The commonly used threshold for normal D-dimer levels is <500 ng/mL.1,4,11 Combination of D-dimer and low probability Wells score yields high negative predictive value to rule out DVT in symptomatic patients.2,12,13 Despite the important role of D-dimer testing in the diagnosis of DVT, it has some pitfalls such as high false positive rate.14 D-dimer levels can be assessed using various assays with variable sensitivity and specificity. D-dimer levels can also be elevated in many conditions other than DVT.15,16 Therefore, interpretation of D-dimer should be done carefully. D-dimer testing is also not available in all health care facilities, limiting its use to rule out suspected DVT in patients.2,11
Nowadays, the role of inflammation in the pathogenesis of DVT has been recognized.17–20 Neutrophil-lymphocyte ratio (NLR) is a non-specific marker of inflammation which is related to many diseases, including venous thromboembolism. Several studies have shown the role of NLR as predictor and prognostic factor for mortality in pulmonary embolism and venous thromboembolism.21–25 For example, a study by Farah et al showed that NLR was associated with acute pulmonary embolism (OR 1.2; 95% CI: 1.01‐1.4; p: 0.041).22
NLR is obtained by dividing neutrophil count with lymphocyte count.17,26,27 The rise of neutrophil count represents a systemic inflammatory process, while the decrease of lymphocyte shows an ongoing stress inflicted by the disease.17 The role of neutrophils in thrombus formation has been elucidated. Neutrophils release neutrophil extracellular traps (NETs) that initiate and propagate thrombus formation.28,29
The role of neutrophils in thrombus formation presents a possibility to use NLR as a biological marker in DVT. Compared with D-dimer, NLR is easy to evaluate and widely available in many healthcare facilities since it does not require special assays. Therefore, this study aimed to evaluate the diagnostic value of NLR compared with D-dimer as a marker in DVT.
Methods
Study Design and Subjects
This was a cross-sectional study of secondary data obtained from medical records. All medical records were obtained from January 1st 2014 to December 31st 2014 and were looked through for adult patients suspected of having DVT presenting with unilateral lower limb edema who underwent ultrasonography for diagnosis at Cipto Mangunkusumo National General Hospital, Jakarta, Indonesia. This study identified a total of 160 subjects suspected of having DVT. However, 42 subjects were excluded due to lack of USG Doppler examination and/or incomplete laboratory data, resulting in the study size of 118 patients.
Clinical characteristics of excluded patients were presented in Supplementary File. We excluded patients without USG Doppler examination to prevent bias in this study and incorrect diagnosis. Another exclusion criterion was pregnancy which was not found in any subjects. As this was a cross-sectional study from secondary data of medical records, the authors chose total sampling method to achieve the minimal sample size.
Data Collection
Data were collected from medical records which included subjects’ baseline characteristics, the presence of comorbidities, clinical findings, Wells score, complete blood count, differential count, D-dimer, and results of ultrasonography (USG) of the lower limbs.
The Wells score of patients was previously determined, evaluated, and recorded by internal medicine specialist in Cipto Mangunkusumo National General Hospital. Additionally, USG Doppler examination for DVT diagnosis was also conducted by internal medicine specialist. Both total Wells score and USG Doppler examination status were obtained directly from medical records.
Wells score of <2 is classified as low probability for DVT while score ≥2 is classified as high probability. NLR was calculated by dividing absolute neutrophil count with absolute lymphocyte count. The presence of uncompressible vein on USG confirmed the diagnosis of DVT.
The presence of comorbidities including diabetes mellitus, chronic kidney disease, heart disease, infection, cerebrovascular disease, hypertension, hematological disorders, and malignancy was documented in medical records and obtained for this study.
Ethics Approval
Informed consent of the subjects in this study was represented by the ethical approval from Ethics Committee of the Faculty of Medicine, Universitas Indonesia number 0558/UN2.F1/ETIK/2018 with protocol number 18–06-0646 due to the study having a cross-sectional design using secondary data from medical records. Hence, no informed consent from the patients was required. Finally, this study complied with Declaration of Helsinki and confidentiality of patients’ data was maintained.
Statistical Methods
Baseline characteristics of samples were described as mean or median for numerical data and percentage for categorical data. Age was categorized as <45 years and ≥45 years since rate of DVT was found to increase significantly after the age of 45 years.30 Study subjects were classified into two groups based on the presence of DVT confirmed by lower limb USG.
Statistical analysis was performed using IBM SPSS Statistics 20.0. In all analysis, P value ≤0.05 for the two-tailed test was considered significant. The relationship between NLR and DVT was analyzed with unpaired t-test. Distribution of NLR was skewed, so the data were log transformed before being analyzed. Back-transformation was then performed to obtain the geometric mean which was presented in the results.
Receiver operating characteristic (ROC) curve analysis was used to assess the diagnostic value of NLR and identify its optimal cut-off value. The area under the ROC curve (AUC), sensitivity, specificity, negative predictive value, positive predictive value, and the likelihood ratio were presented to describe the diagnostic value of NLR.
D-dimer was categorized as positive if the D-dimer level was ≥ 500 ng/dL and negative if <500 ng/dL, as this is a universal cutoff used in clinical setting. The area under the ROC curve (AUC), sensitivity, specificity, negative predictive value, and positive predictive value were presented to describe the diagnostic value of NLR.
The diagnostic value of NLR was then compared with D-dimer. A model incorporating both NLR and D-dimer was analyzed to see if NLR could add diagnostic value to D-dimer in diagnosing DVT. The diagnostic value of both NLR and D-dimer were also analyzed while subjects were divided into low and high probability groups based on Wells score. Statistical comparison between AUC of each variable was also conducted. Logistic regression was then performed to determine the independent association between NLR and D-dimer with DVT.
Results
A total of 160 subjects were gathered but 42 subjects were excluded from the study. Hence, a total of 118 subjects were included in this study. Clinical characteristics of excluded patients can be seen in Supplementary Table 1.
The mean age was 54.78 (SD: 13.87) years with 22.1% of them younger than 45 years. Half (50%) of the subjects were male. The majority of subjects (87.3%) had comorbidities. Subject baseline characteristics can be viewed in Table 1.
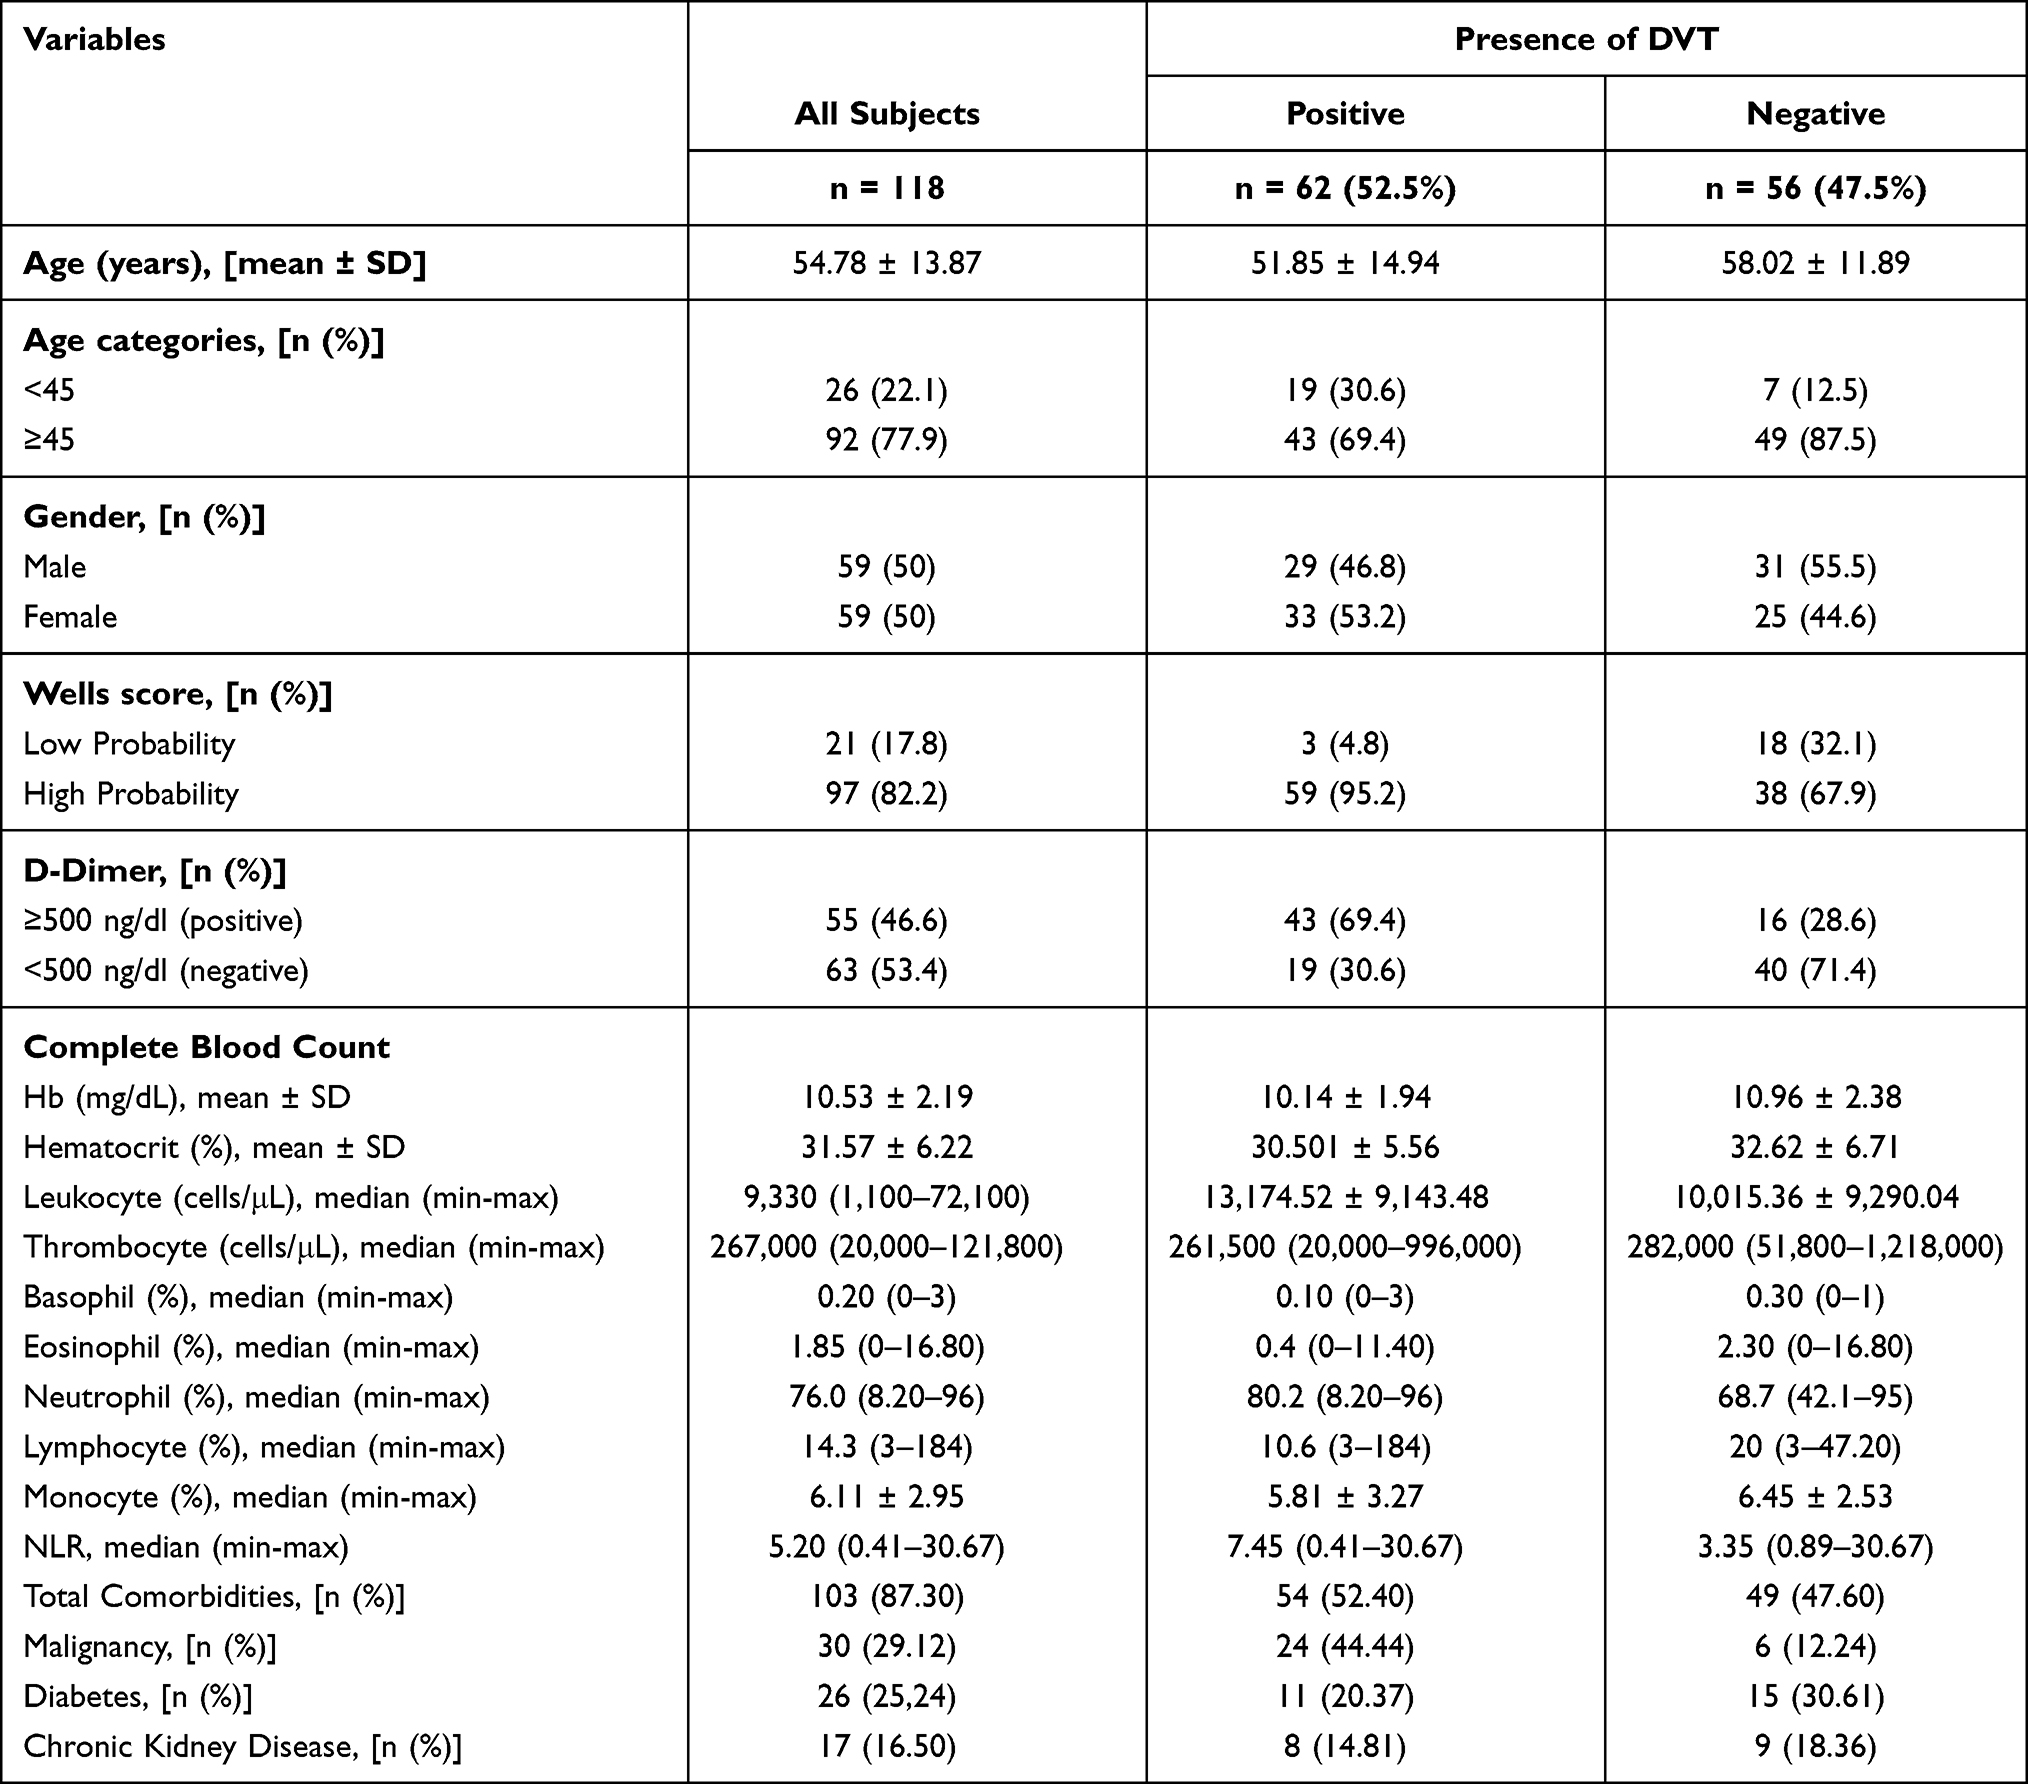 |
Table 1 Subject Characteristics |
Out of 118 subjects, 62 (52.5%) had DVT. Baseline characteristic of hematological parameters showed indication of higher leukocyte levels in the DVT-positive group when compared with non-DVT group (13,174.52 versus 10,015.36). Additionally, the comparison revealed higher percentage of neutrophil in DVT-positive group (80.2% versus 68.7%) while the percentage for lymphocyte was lower in DVT-positive group (10.6% versus 20%). The median NLR was higher in DVT-positive group (7.45 versus 3.35).
The proportion of subjects with high probability of DVT (Wells score ≥ 2) were significantly higher in the group with DVT. The presence of comorbidities was equal between subjects who had and did not have DVT. However, subjects who had DVT had higher number of malignancies. The main comorbidities in our subjects were presence of malignancies with 24 subjects in DVT group having malignancies and only 6 subjects in non-DVT group having malignancies.
ROC Analysis of NLR
ROC analysis was performed to find out the optimal cut-off value for NLR. ROC analysis was conducted using NLR as continuous data. The area under ROC curve (AUC) for NLR was 72.6% (63.4%–81.8%) with p<0.001 (Figure 1) (Table 2). The optimal cut-off value for NLR based on sensitivity and specificity curve analysis was determined to be 5.12 (Figure 2). This cutoff had sensitivity of 67.7%, specificity of 67.9%, negative predictive value (NPV) of 64.91%, and positive predictive value (PPV) of 68.85% (Table 2). Coordinates of the curve for NLR can be seen in Supplementary Table 2.
 |
Table 2 ROC Analysis of NLR |
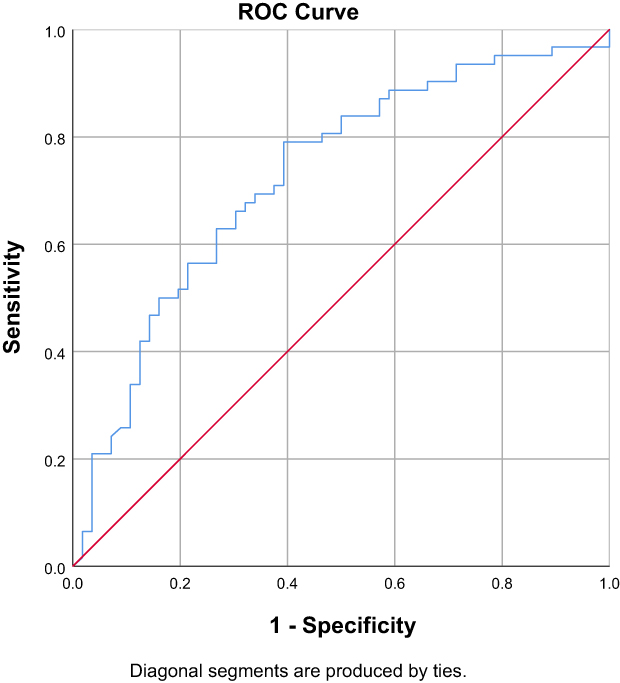 |
Figure 1 Receiver operating characteristic (ROC) analysis of NLR. AUC was 72.6% (63.4%-81.8%). NLR optimal cut-off value was 5.12 (n=118). |
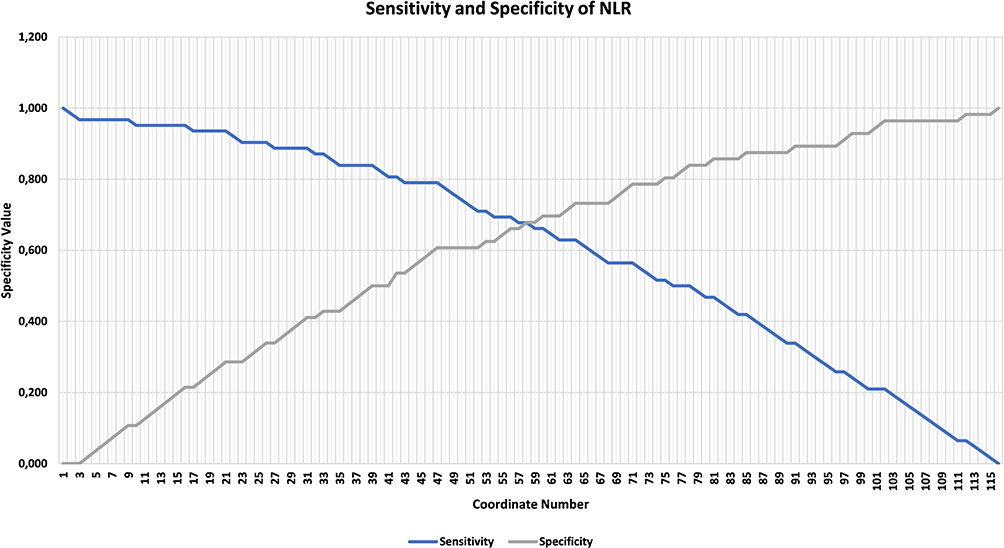 |
Figure 2 Sensitivity and specificity analysis of NLR. NLR optimal cut-off value was determined to be 5.12 (n=118). |
ROC Analysis of D-Dimer
ROC analysis for D-dimer with a cut-off value of 500 showed the area under curve 70.4% (60.8%-80.0%) (Figure 3). Analysis showed that D-Dimer with a cut-off value of 500 had sensitivity of 69.4%, specificity of 71.4%, NPV of 67.8%, and PPV of 72.88% (Table 3).
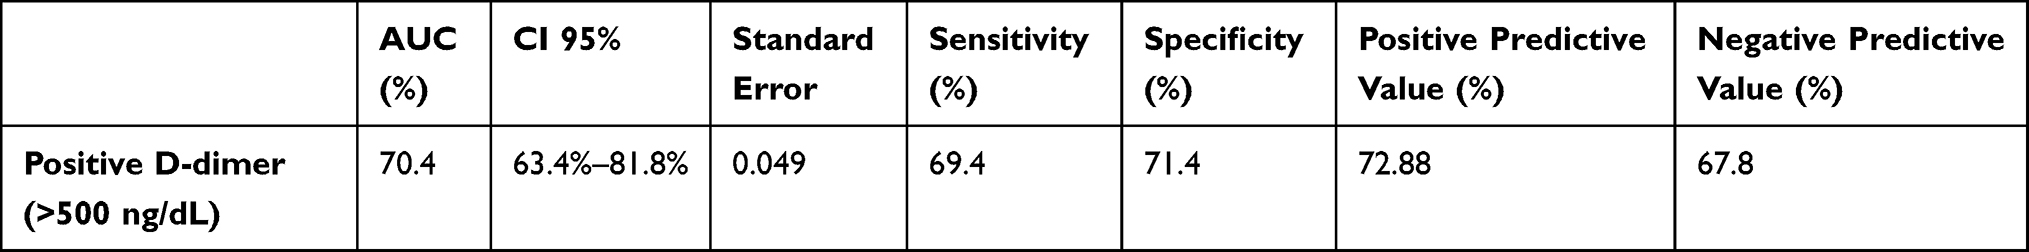 |
Table 3 ROC Analysis of D-Dimer |
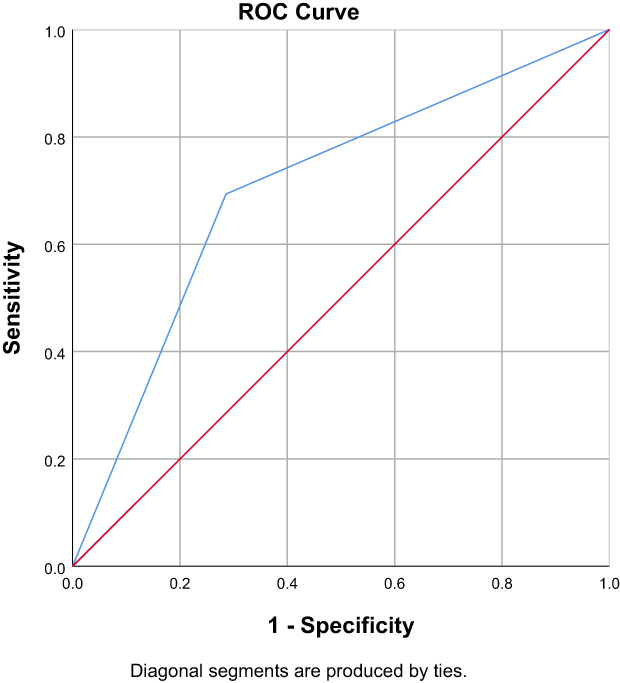 |
Figure 3 Receiver operating characteristic (ROC) analysis of D-dimer. AUC was 70.4% (60.8%–80.0%). |
ROC Analysis of NLR + D-Dimer
When NLR and D-dimer were used together, ROC analysis showed AUC of 76.1% with a sensitivity of 66.1% and specificity of 72.6% (Table 4) (Figure 4). Coordinates of the curve for NLR + D-Dimer can be seen in Supplementary Table 3.
 |
Table 4 ROC Analysis of NLR and D-Dimer |
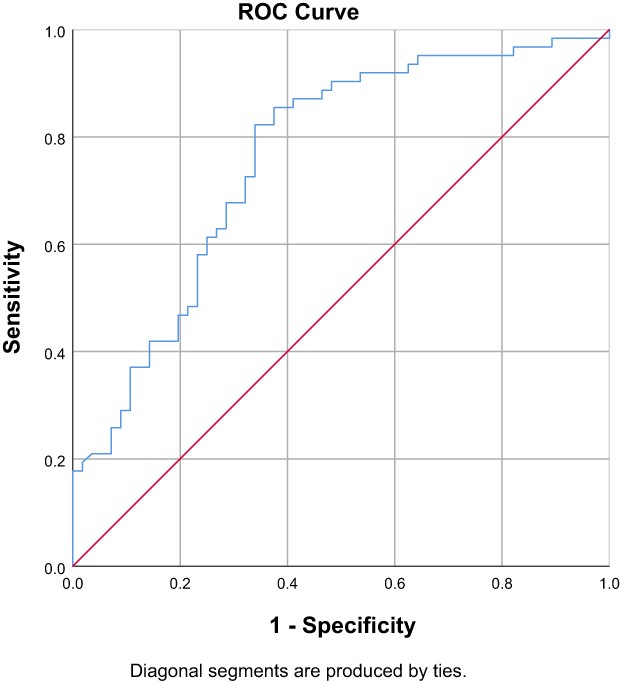 |
Figure 4 Receiver operating characteristic (ROC) analysis of NLR and D-dimer. AUC is 76.1% (67.3%–84.8%). |
AUC Difference Analysis
Comparisons of the 3 AUCs were conducted. Lowest AUC difference was 2.2% between NLR and D-Dimer. Highest AUC difference was 5.7% between D-Dimer and NLR + D-Dimer combination. The difference of 5.7% was statistically significant with p value of 0.047. Based on this, addition of NLR to D-Dimer improved AUC significantly.
We also assessed the overall model quality of the variables using SPSS Software. The model quality for NLR, D-Dimer, and NLR + D-Dimer were 0.63, 0.62, and 0.67 respectively (Figure 5). A good model has a value of more than 0.5.
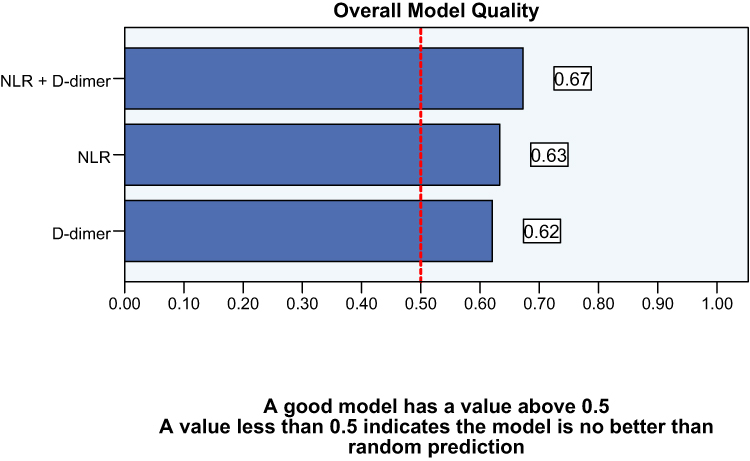 |
Figure 5 Overall model quality. |
Sensitivity and Specificity of NLR + D-Dimer Based on Wells Score Probability
When the subjects were divided based on DVT probability, NLR had higher sensitivity compared to D-dimer in subjects with low probability of DVT. However, D-dimer was shown to be more specific than NLR to differentiate DVT in subjects with low probability (Table 6).
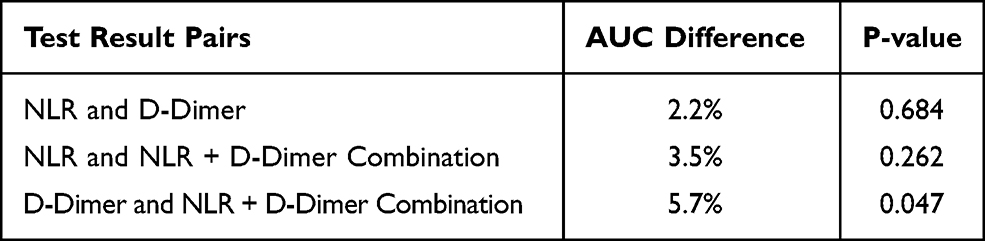 |
Table 5 Statistical Comparison of Obtained AUCs |
Univariate Analysis
We then conducted univariate analysis of NLR with the cutoff value obtained from ROC curve. Result of univariate analysis for NLR using cutoff value of 5.12 showed that subjects with NLR ≥ 5.12 had higher likelihood of having DVT (OR: 4.089; 95% CI:1.898–8.813; p: <0.01). Other variables were also analyzed for univariate analysis (Table 7). Result of the univariate analysis showed that D-Dimer was also significantly associated with DVT.
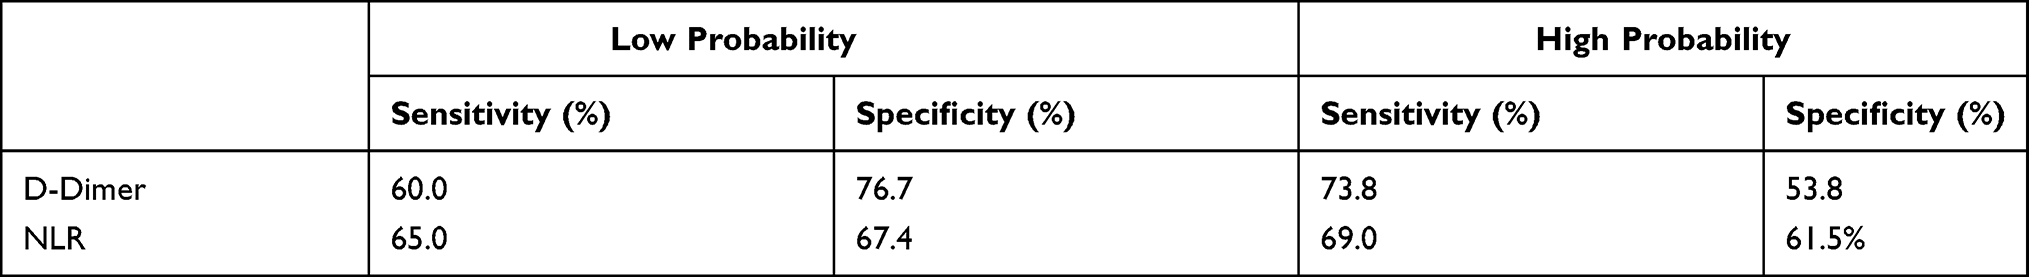 |
Table 6 Sensitivity and Specificity of NLR and D-Dimer in Low Probability and High Probability Groups |
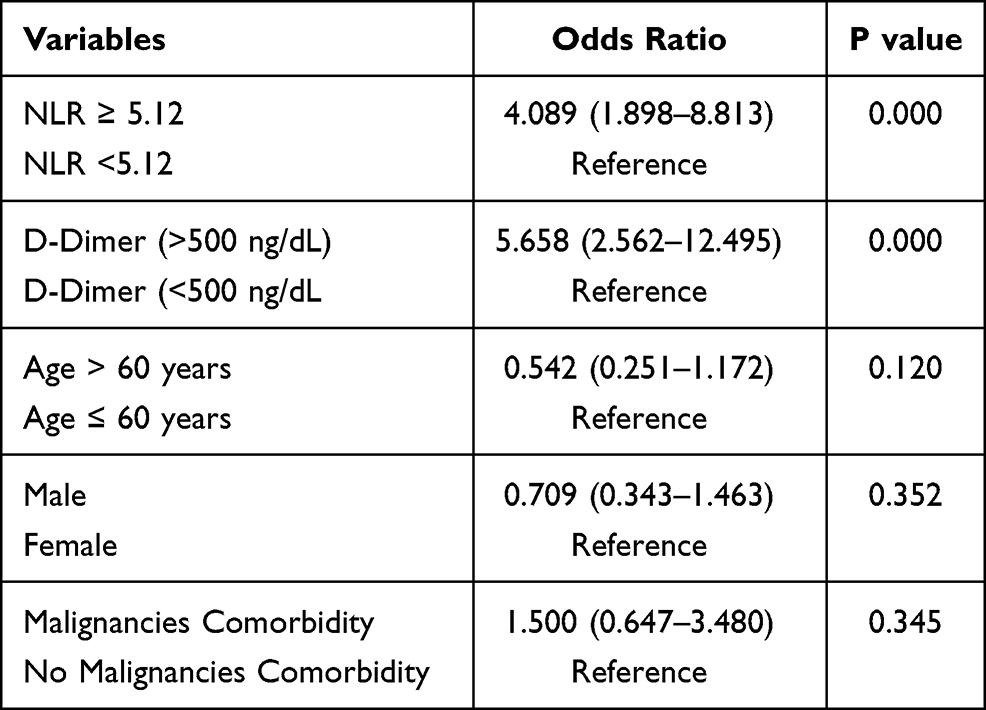 |
Table 7 Univariate Analysis of Variables |
Multivariate Analysis
Variables which had p value of <0.25 were selected for multivariate analysis. Those variables were NLR, D-Dimer, and age. In the multivariate analysis, interaction with each variable was also included. Result of step 1 multivariate analysis is presented in Table 8.
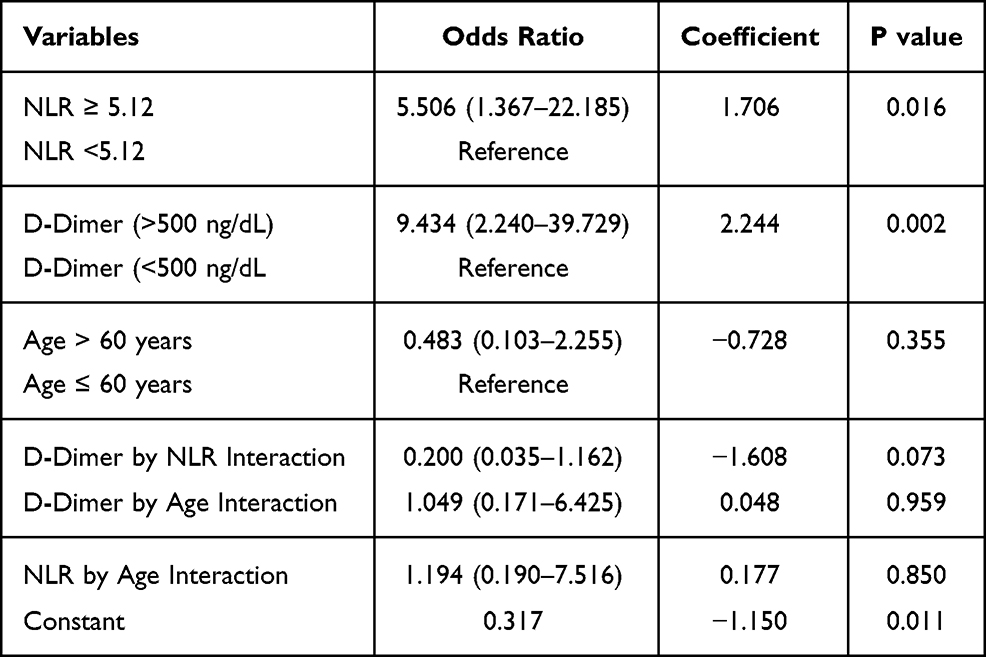 |
Table 8 Step 1 of Multivariate Analysis with Interaction Variable |
Step 4 of multivariate analysis showed that NLR, D-Dimer, and age had statistically significant association with DVT (Table 9). However, the variable interaction between D-Dimer and NLR did not achieve statistical significance (p: 0.080). Hence, we conducted another multivariate analysis without D-Dimer by NLR interaction to obtain the best model.
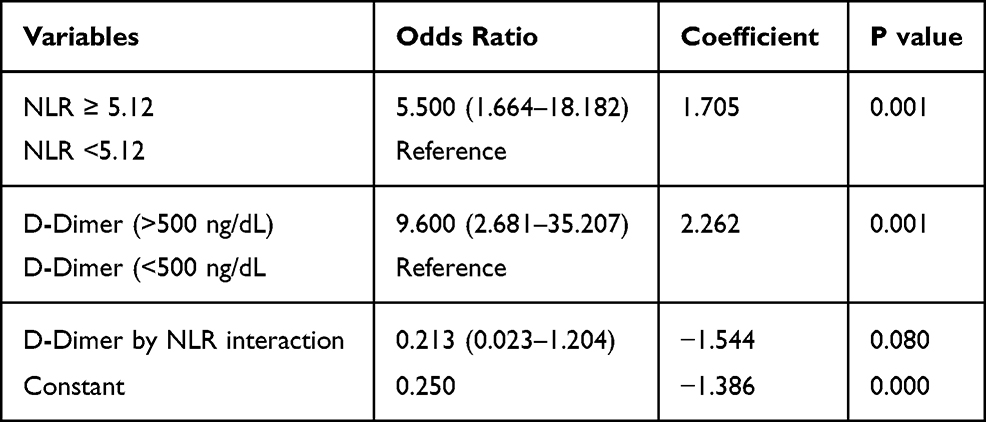 |
Table 9 Step 4 of Multivariate Analysis with Interaction Variable |
Final Model of NLR Diagnostic Study for DVT
Result of multivariate analysis without D-Dimer by NLR interaction showed that NLR (OR: 2.636;95% CI: 1.144–6.076); p: 0.023) and D-Dimer (OR: 4.175; 95% CI: 1.810–9.633; p: 0.001) were associated with DVT (Table 10). Hosmer and Lemeshow test for goodness of fit showed p value of 0.210 which indicated that the model was well calibrated (Table 11). Finally, the formulae from logistic regression were made (Figure 6).
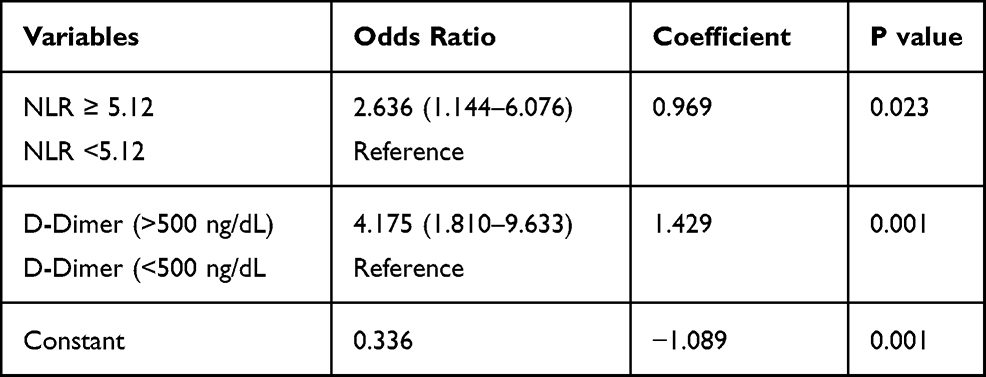 |
Table 10 Best Model of Multivariate Analysis |
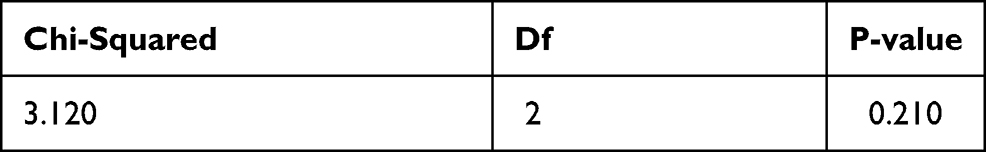 |
Table 11 Hosmer and Lemeshow Test |
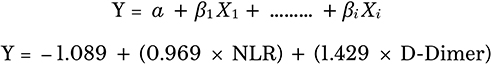 |
Figure 6 Logistic regression formulae obtained from best model of multivariate analysis for odds ratios of having DVT. |
Discussion
The role of inflammation in DVT has been demonstrated in many studies. Neutrophils are thought to mediate the pathogenesis of DVT.30,31 The initiation of thrombus formation involves an inflammatory process which induces activation of endothelial cells, platelets, and leukocytes.18,31 Activated endothelial cells express P-selectin, an adhesion molecule that mediates the attachment of leukocytes and platelets. Additionally, pro-inflammatory cytokines are secreted by the endothelium to recruit innate immune cells, particularly neutrophils and monocytes. Those cells, especially neutrophils, are abundantly found in early thrombi, forming clusters or layers adjacent to the endothelium.23,25,26 Attachment of neutrophils to the endothelium is then followed by platelet adhesion. Finally, neutrophils may propagate thrombus formation through neutrophil extracellular traps (NETs).26,28,29 NETs are released as a response to cellular damage and inflammatory stimuli.29 Other function of NETs is to enhance coagulation by recruiting factor XIIa and cleave tissue factor pathway inhibitor, an inhibitor of coagulation. Additionally, binding of NETs to fibrin and von Willebrand Factor (VWF) leads to recruitment of platelets and red blood cells to the site of thrombus formation.28,29
Neutrophil-lymphocyte ratio (NLR), a non-specific inflammatory marker represents the relationship between neutrophils and lymphocytes in inflammation.14,28,29 Higher NLR indicates high neutrophil count and low lymphocyte count. The rise of neutrophil count represents a systemic inflammatory process while the decrease of lymphocytes shows ongoing stress inflicted by the disease.17 Hence, we aimed to evaluate the role of NLR to diagnose DVT.
Baseline Characteristics
Baseline characteristics showed that the median of NLR is higher in DVT-positive group than in non-DVT group (7.45 versus 3.35). Thrombus development is associated with inflammation and recruitment of leukocytes.32,33 Hence, the difference of median NLR in this study is in concordance with the pathophysiology described previously, where there is an increase of neutrophils due to inflammation. NLR levels therefore correlate with higher level of inflammation. The mean age of the patients was above 50 years old which is in the age range when DVT occurs.
ROC Curve Analysis
We conducted ROC analysis to obtain the AUC value for NLR, D-Dimer, and NLR + D-Dimer with the results of 72.6%, 70.4%, and 76.1% respectively. AUC value of above 70% is considered moderately good for diagnosis. As a result, NLR, D-Dimer, and NLR + D-Dimer combination are good modalities to help diagnose DVT. Of interest is a similar AUC value of NLR with D-Dimer in this study.
D-Dimer is already a well-established marker for thrombosis. D-dimer is a fibrin degradation product which acts as a marker of endogenous thrombus fibrinolysis.16 Therefore, elevated D-dimer levels can indicate the presence of thrombus.34 Meanwhile, NLR represents the inflammatory process that initiates and propagates thrombus formation.26 Our study showed that the addition of NLR to D-Dimer increased the AUC by 5.7% when compared to D-Dimer only (76.1% versus 70.4%). This difference is statistically significant as shown by AUC difference analysis (Table 5). Hence, the addition of NLR increased the diagnostic value of D-Dimer, and NLR therefore may be used as a marker to supplement D-Dimer in diagnosing DVT. NLR is also a laboratory parameter which is easy to obtain in a clinical setting. However, despite the promising result, this needs to be confirmed and evaluated in a clinical setting as the values may be different clinically.
Sensitivity and Specificity Analysis
In our study, the optimal cut-off value for NLR was 5.12. This cutoff had sensitivity of 67.7% and specificity of 67.9% in differentiating subjects with and without DVT. Meanwhile, the NPV and PPV for NLR were 64.91% and 68.85%, respectively. This study also found that D-dimer had sensitivity of 69.4%, specificity of 71.4%, PPV of 72.88%, and NPV of 67.79%. Meanwhile, the NLR + D-dimer combination had sensitivity of 66.1% and specificity of 72.6%.
The cutoff of 5.12 for NLR in this study is different to other studies. For example, in a study by Ferroni et al, which consisted of 810 cancer patients undergoing chemotherapy and aimed to analyze the prognostic value of NLR to predict VTE events yielded a cut-off value of >3 with AUC 55%, sensitivity 59%, and specificity 57%.35 Using that cut-off value, NLR could predict the occurrence of symptomatic VTE with HR 2.5 (95% CI 1.0–6.4, p=0,06). The study by Ferroni et al showed lower sensitivity and specificity of NLR with lower cut-off value compared with the findings in our study.35 Another example was shown in a case-control study by Bakirci et al, which evaluated the relationship between NLR and venous thromboembolism (VTE) consisting of DVT and pulmonary embolism (PE).13 The study showed NLR with a cut-off value of 1.84 with sensitivity of 88.2% and specificity of 67.6%.
These different cutoffs may be explained by several factors. The first example of the study by Ferroni et al was a prognostic study to predict VTE occurrence which differs from this study where the aim was to diagnose VTE.35 The other example is the study by Bakirci et al which included both DVT and PE, in which PE had a more acute setting than DVT which may have produced lower NLR ratio and influenced the results.13 Additionally, the study excluded subjects with comorbidities such as malignancies, inflammatory diseases, rheumatic, antiphospholipid syndrome, chronic kidney disease, and liver disease while most of the subjects in our study had those conditions.13 The inclusion of comorbidities could increase inflammatory conditions, thus increasing the all-subjects median of NLR value in our study.25,34,36–38
Sensitivity and Specificity of NLR Based on DVT Probability
In subjects with low probability of DVT based on Wells score, NLR had higher sensitivity than D-Dimer (65% versus 60%). In contrast, for subjects with high probability of DVT, NLR had higher specificity than D-Dimer (69.2% versus 53.8%). Due to better sensitivity of NLR in low probability group, NLR may be more effective as additional screening in low probability group. Additionally, NLR is easily accessible and does not require specific assay, thus enabling rapid evaluation of symptomatic patients suspected of having DVT and reducing the need to perform USG in low probability patients.37 Therefore, NLR might be better than D-dimer to correctly diagnose DVT in patients with low probability. Finally, in patients with high probability of DVT, the higher specificity of NLR can be useful to exclude patients without DVT.
Multivariate Analysis
Various comorbidities presented in this study were associated with an increase in NLR, resulting in the possibilities of comorbidities as a confounding factor.25,34,36–38 We first conducted univariate logistic regression of malignancies, age, and gender, however, malignancies and gender had p value above 0.25 (Table 8). Hence, they were not statistically significant and were not selected for multivariate analysis. Additionally, this also meant that malignancies did not affect the relationship of DVT and NLR in this study. Other comorbidities beside malignancies were not analyzed due to lack of sufficient high number of subjects with “non-malignancies” comorbidities.
The lack of correlation between malignancies and DVT is in contrast with Wells score where malignancies have positive correlation with DVT. The difference can be explained due to this study being designed as a diagnostic study with the aim to analyze value of NLR and D-Dimer for DVT diagnosis instead of finding variables associated with DVT. Furthermore, sample size calculations for variables such as malignancies were not conducted.
In multivariate analysis, we also included interaction between the variables. In the first model, only NLR, D-dimer, and D-dimer by NLR interaction were left as variables. However, D-dimer by NLR interaction had p value above 0.05 and was eliminated from the model due to being statistically insignificant. Final model showed that only NLR and D-dimer were the significant variables in this study (Table 10). Hosmer and Lemeshow test of the final model showed p value of 0.210, which concluded that the final model had good calibration.
Study Limitations
This study used a relatively small sample size of 118 patients. Hence, the result of this study requires further confirmation from prospective studies with higher sample size to evaluate and confirm the diagnostic value of NLR in DVT. In addition, the effect of additional comorbidities other than malignancies on the results could not be studied here. Finally, this study did not specify whether the DVT was proximal or distal, while the location of DVT may be associated with higher NLR.14,37 Therefore, other factors that may influence NLR such as the location of DVT should also be considered and analyzed in future studies.
Conclusion
The diagnostic value of NLR was comparable with D-dimer in DVT subjects with unilateral limb edema. In subjects with low probability of DVT, NLR had higher sensitivity compared to D-dimer. NLR value is much easier to obtain and does not require specific assay. Therefore, NLR was shown to be a useful complementary diagnostic tool for D-dimer to exclude DVT, especially in low clinical probability patients.
Abbreviations
DVT, deep vein thrombosis; NLR, neutrophil-lymphocyte ratio; ROC, receiver operating characteristic; AUC, area under the curve; NETs, neutrophil extracellular traps; VTE, venous thromboembolism; PE, pulmonary embolism.
Data Sharing Statement
The datasets used and/or analyzed during the current study are available from the corresponding author on reasonable request.
Acknowledgment
The authors acknowledge Vanya Utami Tedhy, Jeffrey Christian Mahardhika and Jessica Novia Hadiyanto who provided support in editing, formatting, and translating the manuscript.
Author Contributions
All authors contributed to data analysis, drafting or revising the article, have agreed on the journal to which the article will be submitted, gave final approval of the version to be published, and agree to be accountable for all aspects of the work.
Funding
All the study and collection, analysis, and interpretation of data and in writing the manuscript was funded by Dr. Cipto Mangunkusumo National General Hospital, Jakarta, Indonesia.
Disclosure
An abstract entitled “The Relationship between Neutrophil Lymphocyte Ratio and Deep Vein Thrombosis in Unilateral Limb Edema in Suspected Deep Vein Thrombosis Patients” has been presented as a poster at The 64th Annual Scientific and Standardization Committee (SSC) Meeting of The International Society on Thrombosis and Haemostasis (ISTH) in Dublin, Ireland on July 18–12, 2018 and has been published as an abstract in Research and Practice in Thrombosis and Haemostasis, 2018, Volume 2, page 1–368, doi: 10.1002/rth2.12125, available from: https://onlinelibrary.wiley.com/doi/epdf/10.1002/rth2.12125. Significant new content, analysis, and discussion of the diagnostic values of D-dimer, combination of NLR and D-dimer, and comparison of diagnostic value between NLR and D-dimer in high and low clinical probability DVT have been added to this present manuscript. The authors declare that they have no competing interests.
References
1. Wells P, Anderson D. The diagnosis and treatment of venous thromboembolism. Hematology Am Soc Hematol Educ Program. 2013;2013:457–463.
2. Beckman MG, Hooper WC, Critchley SE, Ortel TL. Venous thromboembolism: a public health concern. Am J Prev Med. 2010;38(4suppl):S495–501. doi:10.1016/j.amepre.2009.12.017
3. Beyth J, Cohen AM, Landefeld CS. Long-term outcomes of deep-vein thrombosis. Arch Intern Med. 1995;155:1031–1037. doi:10.1001/archinte.1995.00430100053006
4. Le Gal G, Righini M. Controversies in the diagnosis of venous thromboembolism. J Thromb Haemost. 2015;13(S1):S259–65. doi:10.1111/jth.12937
5. Lesmana A, Pratama D, Wangge G. Comparison of wells score, D–dimer and combination of wells score and D–dimer with venous duplex ultrasonography in diagnosis of acute deep vein thrombosis in lower extremity andy. New Ropanasuri J Surg. 2017;2(1):e103–e109. doi:10.7454/nrjs.v2i1.17
6. Tan S, Chong B, Thoo F, Ho J, Boey H. Diagnosis of deep vein thrombosis: accuracy of colour Doppler ultrasound compared with venography. Singapore Med J. 1995;36:362–366.
7. Lewiss RE, Kaban NL, Saul T. Point-of-care ultrasound for a deep venous thrombosis. Glob Heart. 2013;8(4):329–333. doi:10.1016/j.gheart.2013.11.002
8. Mazzolai L, Aboyans V, Ageno W, et al. Diagnosis and management of acute deep vein thrombosis: a joint consensus document from the European Society of Cardiology working groups of aorta and peripheral vascular diseases and pulmonary circulation and right ventricular function. Eur Heart J. 2018;39(47):4208–4218. doi:10.1093/eurheartj/ehx003
9. Bogavac-Stanojević N, Dopsaj V, Jelić-Ivanović Z, Lakić D, Vasić D, Petrova G. Economic evaluation of different screening alternatives for patients with clinically suspected acute deep vein thrombosis. Biochem Medica. 2013;23(1):96–106. doi:10.11613/BM.2013.012
10. Huisman MV, Klok FA. Diagnostic management of acute deep vein thrombosis and pulmonary embolism. J Thromb Haemost. 2013;11(3):412–422. doi:10.1111/jth.12124
11. Geersing GJ, Zuithoff NPA, Kearon C, et al. Exclusion of deep vein thrombosis using the Wells rule in clinically important subgroups: individual patient data meta-analysis. BMJ. 2014;348(g1340):1–13. doi:10.1136/bmj.g1340
12. Ahearn GS, Bounameaux H. The role of the D-dimer in the diagnosis of venous thromboembolism. Semin Respir Crit Care Med. 2000;21(6):521–536. doi:10.1055/s-2000-13186
13. Bakirci EM, Topcu S, Kalkan K, et al. The role of the nonspecific inflammatory markers in determining the anatomic extent of venous thromboembolism. Clin Appl Thromb. 2015;21(2):181–185. doi:10.1177/1076029613494469
14. Chopra N, Doddamreddy P, Grewal H, Kumar PC. An elevated D-dimer value: a burden on our patients and hospitals. Int J Gen Med. 2012;25(5):87–92. doi:10.2147/IJGM.S25027
15. Bounds EJ, Kok SJ, Dimer D. StatPearls [Internet]. Treasure Island (FL): StatPearls Publishing; 2020. Available from http://www.ncbi.nlm.nih.gov/books/NBK431064/.
16. Linkins L-A, Takach Lapner S. Review of D-dimer testing: good, bad, and ugly. Int J Lab Hematol. 2017;39(Suppl 1):98–103. doi:10.1111/ijlh.12665
17. Branchford BR, Carpenter SL. The role of inflammation in venous thromboembolism. Front Pediatr. 2018;6(May):142. doi:10.3389/fped.2018.00142
18. Christiansen SC, Nass IA, Cannegieter SC, Hammerstrom J, Rosendaal FR, Reitsma PH. Inflammatory cytokines as risk factors for a first venous thrombosis: a prospective population-based study. PLoS Med. 2006;3(8):1414–1419. doi:10.1371/journal.pmed.0030334
19. Dowling NF, Hooper WC, Austin H. Understanding and predicting venous thromboembolism: the role of coagulation factors and inflammatory markers. Am J Med. 2002;113(8):689–690. doi:10.1016/S0002-9343(02)01395-5
20. Sharma K, Patel AK, Shah KH, Konat A. Is neutrophil-to-lymphocyte ratio a predictor of coronary artery disease in Western Indians? Int J Inflamm. 2017;2017:1–8. doi:10.1155/2017/4136126
21. Köse N, Yıldırım T, Akın F, Yıldırım SE, Altun İ. Prognostic role of NLR, PLR, and LMR in patients with pulmonary embolism. Bosn J Basic Med Sci. 2020;20(2):248–253. doi:10.17305/bjbms.2019.4445
22. Farah R, Nseir W, Kagansky D, et al. The role of neutrophil-lymphocyte ratio, and mean platelet volume in detecting patients with acute venous thromboembolism. J Clin Lab Anal. 2019;34(1):e23010. doi:10.1002/jcla.23010
23. Phan T, Brailovsky Y, Fareed J, Hoppensteadt D, Iqbal O, Darki A. Neutrophil-to-lymphocyte and platelet-to-lymphocyte ratios predict all-cause mortality in acute pulmonary embolism. Clin Appl Thromb. 2020;Jan(26):1076029619900549.
24. Du P. Neutrophil-lymphocyte ratio is a predictor of venous thromboembolism in gastric cancer patients. Clin Lab. 2019;65(5). doi:10.7754/Clin.Lab.2018.181005
25. Go SI, Lee A, Lee US, et al. Clinical significance of the neutrophil–lymphocyte ratio in venous thromboembolism patients with lung cancer. Lung Cancer. 2014;84(1):79–85. doi:10.1016/j.lungcan.2014.01.014
26. Borazan E, Balik AA, Bozdaǧ Z, et al. Assessment of the relationship between neutrophil lymphocyte ratio and prognostic factors in non-metastatic colorectal cancer. Turk J Surg. 2017;33(3):185–189. doi:10.5152/turkjsurg.2017.3528
27. Papayannopoulos V. Neutrophil extracellular traps in immunity and disease. Nat Rev Immunol. 2018;18(2):134–147. doi:10.1038/nri.2017.105
28. Pfeiler S, Stark K, Massberg S, Engelmann B. Propagation of thrombosis by neutrophils and extracellular nucleosome networks. Haematologica. 2017;102(2):206–213. doi:10.3324/haematol.2016.142471
29. Cushman M. Epidemiology and risk factors for venous thrombosis. Semin Hematol. 2007;44(2):62–69. doi:10.1053/j.seminhematol.2007.02.004
30. von Brühl M-L, Stark K, Steinhart A, et al. Monocytes, neutrophils, and platelets cooperate to initiate and propagate venous thrombosis in mice in vivo. J Exp Med. 2012;209(4):819–835. doi:10.1084/jem.20112322
31. Michel J, Ho-tin-noé B. Thrombi and neutrophils. Circ Res. 2015;116:1107–1109. doi:10.1161/CIRCRESAHA.115.306050
32. Cavuş UY, Yildirim S, Sönmez E, Ertan C, Ozeke O. Prognostic value of neutrophil/lymphocyte ratio in patients with pulmonary embolism. Turk J Med Sci. 2014;44(1):50–55. doi:10.3906/sag-1302-47
33. Aue G, Lozier JN, Tian X, et al. Inflammation, TNFα, and endothelial dysfunction link lenalidomide to venous thrombosis in chronic lymphocytic leukemia. Am J Hematol. 2011;86(10):835–840. doi:10.1002/ajh.22114
34. Papa A, Emdin M, Passino C, Michelassi C, Battaglia D, Cocci F. Predictive value of elevated neutrophil-lymphocyte ratio on cardiac mortality in patients with stable coronary artery disease. Clin Chim Acta. 2008;395:27–31. doi:10.1016/j.cca.2008.04.019
35. Ferroni P, Riondino S, Formica V, et al. Venous thromboembolism risk prediction in ambulatory cancer patients: clinical significance of neutrophil/lymphocyte ratio and platelet/lymphocyte ratio. Int J Cancer. 2015;136(5):1234–1240. doi:10.1002/ijc.29076
36. Imtiaz F, Shafique K, Mirza S, Ayoob Z, Vart P, Rao S. Neutrophil lymphocyte ratio as a measure of systemic inflammation in prevalent chronic diseases in Asian population. Int Arch Med. 2012;5:2. doi:10.1186/1755-7682-5-2
37. Ertaş G, Sönmez O, Turfan M, et al. Neutrophil/lymphocyte ratio is associated with thromboembolic stroke in patients with non-valvular atrial fibrillation. J Neurol Sci. 2013;324(1–2):49–52. doi:10.1016/j.jns.2012.09.032
38. Binnetoğlu E, Şengül E, Halhallı G, Dindar S, Şen H. Is neutrophil lymphocyte ratio an indicator for proteinuria in chronic kidney disease? J Clin Lab Anal. 2014;28(6):487–492. doi:10.1002/jcla.21715
 © 2021 The Author(s). This work is published and licensed by Dove Medical Press Limited. The full terms of this license are available at https://www.dovepress.com/terms.php and incorporate the Creative Commons Attribution - Non Commercial (unported, v3.0) License.
By accessing the work you hereby accept the Terms. Non-commercial uses of the work are permitted without any further permission from Dove Medical Press Limited, provided the work is properly attributed. For permission for commercial use of this work, please see paragraphs 4.2 and 5 of our Terms.
© 2021 The Author(s). This work is published and licensed by Dove Medical Press Limited. The full terms of this license are available at https://www.dovepress.com/terms.php and incorporate the Creative Commons Attribution - Non Commercial (unported, v3.0) License.
By accessing the work you hereby accept the Terms. Non-commercial uses of the work are permitted without any further permission from Dove Medical Press Limited, provided the work is properly attributed. For permission for commercial use of this work, please see paragraphs 4.2 and 5 of our Terms.