")
Back to Journals » Cancer Management and Research » Volume 12
Diagnostic Value of Combining miRNAs, CEA Measurement and the FOBT in Colorectal Cancer Screening
Authors Li X , Chen R, Li Z, Luo B , Geng W, Wu X
Received 17 November 2019
Accepted for publication 14 February 2020
Published 15 April 2020 Volume 2020:12 Pages 2549—2557
DOI https://doi.org/10.2147/CMAR.S238492
Checked for plagiarism Yes
Review by Single anonymous peer review
Peer reviewer comments 2
Editor who approved publication: Professor Rudolph Navari
Xiaodan Li,1 Rong Chen,2 Zhifa Li,2 Bing Luo,1 Wenyan Geng,1 Xiaobing Wu2
1Clinical Laboratory, The Third Affiliated Hospital of the Guangzhou Medical University, Guangzhou 510150, People’s Republic of China; 2Gastrointestinal Surgery, The Third Affiliated Hospital of the Guangzhou Medical University, Guangzhou 510150, People’s Republic of China
Correspondence: Xiaobing Wu
Gastrointestinal Surgery, The Third Affiliated Hospital of the Guangzhou Medical University, NO. 63, Duobao Road, Liwan District, Guangzhou City, Guangdong Prov 510150, People’s Republic of China
Tel +8613544395215
Fax +02081292182
Email [email protected]
Introduction: Colorectal cancer (CRC) is one of the most common illnesses that seriously threatens human health; many papers have reported that microRNAs (miRNAs) are promising biomarkers for cancer detection. However, miRNAs have not been used in clinical practice even though they are superior to the currently used screening tools, such as the fecal occult blood test (FOBT) and carcinoembryonic antigen (CEA) measurement.
Methods: In this study, we focused on the usefulness of a panel of miRNAs and the combination of miRNAs with the FOBT and CEA measurement, the currently used general diagnosis methods, to improve the accuracy of CRC diagnosis.
Results: The results showed that the miRNA panel has great potential value as a diagnostic biomarker with high specificity and sensitivity, and further analysis demonstrated that the miRNA panel had higher sensitivity and specificity than the FOBT and CEA measurement, even when these methods were combined. More importantly, although the miRNA panel is superior to the FOBT and CEA measurement, it cannot replace them.
Conclusions: In this research, we investigated whether complementarity exists between the miRNA panel and the FOBT and CEA measurement for CRC diagnosis. Interestingly, the results indicated that the FOBT and CEA measurement could improve the positivity rate of the miRNA panel as a biomarker and vice versa.
Keywords: microRNAs, colorectal cancer, biomarker
Introduction
Colorectal cancer (CRC) is one of the most common causes of cancer-related death worldwide.1 Although researches about CRC have never stopped, CRC remains one of the most serious health problems, with an estimated incidence of 1.2 million new cases and more than 600,000 deaths estimated worldwide annually.2,3 CRC survival is largely dependent on the stage at which the disease is diagnosed;4 earlier detection can help reduce the significant global mortality rates associated with this malignancy.5,6 Currently, several CRC screening tests, such as the guaiac-based fecal occult blood test (FOBT), carcinoembryonic antigen (CEA) measurement, the fecal immunochemical occult blood test (FIT), and colonoscopy, have been available for years and have resulted in somewhat decreased CRC mortality.7,8 However, large-scale screening studies have revealed the limitations of these tests due to their inherent low accuracy or high cost. FOBTs and CEA measurements are noninvasive and inexpensive to administer but suffer from low screening sensitivity and specificity.9 FITs are similar to FOBTs regarding cost, but the instability of the antibodies used in FITs may cause complications during transport or storage.10 Although colonoscopy is highly reliable for CRC screening, its invasive and costly nature, in addition to the small but significant risk of perforation, has hindered its widespread utilization as an effective and compliant screening method.11 Considering these unfavorable factors, other novel and highly specific biomarkers are clearly needed to improve the accuracy of CRC detection. Here, we focused on the clinical usefulness of applying new signatures in the diagnosis of current patients with CRC.
Many studies have investigated and reported the potential of using miRNAs as novel biomarkers for CRC screening. miRNAs are a class of small single-stranded noncoding RNA molecules (19–22 nucleotides) that negatively regulate gene expression by translation suppression or mRNA degradation.12 Accumulating data have shown that miRNAs play an important role in the process of disease development. Importantly, they function as tumor suppressors or oncogenes13 and seem to be good candidates as biomarkers for cancer detection, including CRC. Among various previous studies, miR-143 and miR-145 were reported to be downregulated in colorectal tissues and precancerous lesions,14 functioning as tumor suppressors by inhibiting the growth of CRC cell lines.15–17 As an oncogenic miRNA, miR-21 is more frequently overexpressed in cancer tissues than in adjacent normal tissues18 and participates in the multistep process of colorectal tumorigenesis by targeting PDCD, PTEN, and DKK2 in the MAPK pathway and WNT/β-catenin signaling.19,20 Other evidence has even described the functional role of miRNAs in carcinogenesis. The miR-17-92a cluster has frequently demonstrated amplification in various types of malignant cancers.21,22 The increased expression of miR-17-92a involved in the progression of tumorigenesis in CRC is associated with the gain of the miR-17-92a locus and increased C-MYC transcriptional activity.21 The miR-17-92a cluster can also activate the WNT signaling pathway by suppressing APC or E2F1.23,24 As mentioned above, although emerging evidence has suggested that miRNAs likely play an important functional role in carcinogenesis and have considerable potential to act as CRC screening biomarkers, several key issues should be addressed collectively and collaboratively before any of these biomarkers can be translated into clinical tools. Previous articles have focused on certain miRNAs, few researchers have emphasized the relationship between miRNAs and other currently used screening tools, and some inconsistent miRNA expression profile results have been reported among different studies. In this study, rather than using a single miRNA, we focused on a panel of miRNAs, and the miRNAs were combined with different types of biomarkers or other available tests, including CEA measurement and the FOBT with the aim of enhancing the sensitivity and specificity of these clinical approaches in the future.
Materials and Methods
Patient and Tissue Samples
One hundred tissue specimens, 50 cancer tissues, and 50 matched adjacent normal mucosal samples (at least 5 cm from the negative surgical margin) were selected from 50 CRC patients who had undergone gastrointestinal resection at the Third Affiliated Hospital of Guangzhou Medical University from October 2014 to October 2018. All the tissues were immediately snap frozen in liquid nitrogen after resection, followed by storage at −80°C until the nucleic acids were extracted and until tissue diagnosis was performed by two experienced pathologists according to the TNM staging system. All the patients were diagnosed with no other primary cancer, and those who had received chemotherapy or radiotherapy before surgery were excluded. Written informed consent was obtained from all the participants, and the study was approved by the institutional Ethical Board of the Third Affiliated Hospital of Guangzhou Medical University. All experiments were performed in accordance with relevant guidelines and regulations.
RNA Isolation
Briefly, approximately 100 mg of frozen tissue was homogenized with 1 mL of RNAzol reagent (Molecular Research Center, USA) to isolate miRNA. Next, 0.4 mL of RNase-free water was added and vortexed for 30 s for complete homogenization and was then centrifuged at 12,000 g for 15 min to precipitate the DNA/protein after 5–10 min. One milliliter of the supernatant was selected and mixed with 0.4 mL of 75% ethanol for 10 min and centrifuged at 12,000 g for 8 min to precipitate the microRNAs (miRNAs). The miRNA supernatant was mixed with isopropanol (0.8 volumes) for 30 min and then centrifuged at 12,000 g for 15 min, washed twice with 0.4 mL of 70% isopropanol, and centrifuged at 8000 g for 3 min. Finally, diethylpyrocarbonate-treated water was used to dissolve the miRNAs. The concentration and purity of the miRNAs were measured using electrophoresis and a NanoDrop spectrophotometer (Thermo Scientific, USA). The quality of the miRNAs was considered acceptable if the OD260/OD280 was between 1.7 and 2.0. The integrity of the miRNAs was evaluated by the determination of robust amplification of small nuclear ubiquitous RNAs (ie, RNU6b, RNU44, and RNU48) by real-time reverse transcription PCR (qRT-PCR) because they are commonly used as endogenous controls in miRNA studies.
miRNA Profiling
The Universal RT microRNA PCR system (GeneCopoeia, USA) was used to profile the miRNAs of the two pooled tissue samples (ie, 50 tumors and 50 matched normal controls). The profiling assay consisted of universal reverse transcription (RT) and sequential qRT-PCR amplification with special primers using SYBR Green (GeneCopoeia, USA).
Pcr
PCR was performed in a 384-well PCR plate, and each well contained 20 µL of the reaction system, including 1 µL of cDNA and 1 µL of gene-specific PCR primers. All reactions were performed in triplicate, and the fold changes in the expression of each type of miRNA were determined.
Quantification of miRNAs by qRT-PCR
RT for the miRNA microarray was carried out using the All-in-One First-Strand cDNA Synthesis kit (GeneCopoeia, USA). The experimental steps were described briefly in our previous studies.25,26 The cDNA product of the RT reaction was diluted ten-fold and subsequently used as the template for PCR in an Applied Biosystems ViiA 7 Real-Time PCR System (Life Technologies, USA). In this study, as an external reference, MS2 RNA was used to evaluate the quality of the extracted miRNAs, and a combination of RNU6b, RNU44, and RNU48 was utilized as an internal reference for the normalization of miRNA concentrations. With a total volume of 20 µL, the PCR mix contained the following: 1 µL of template, 2 µL of PCR forward primer (2 M), 2 µL of PCR reverse primer (2 M), 10 µL of 2× All-in-one qPCR Mix, 4.8 µL of ddH2O, and 0.2 µL of 50× ROX Reference Dye (for calibration). A master mix that included all the components except for the template was often prepared first. If the total volume of the master mix changed, each component was added in the proper proportion. The conditions of real-time PCR were described previously.25,26 To ensure the PCR quality, a preliminary experiment was performed to ensure that the difference in the cycle threshold (CT) value of the MS2 RNA between the two samples was less than 1.0. The expression levels of the miRNAs were quantified using the SYBR Green-based All-in-One qPCR Mix (GeneCopoeia, USA).
Statistical Analyses
SPSS 16.0 (SPSS, UK) and Graph Pad Prism 5.0 (San Diego, CA, USA) statistical software were used for the data analyses. The relative expression of miRNAs was determined by the 2-ΔΔCT method,27 unpaired Student’s t-test, and receiver operating characteristic (ROC) curves. The area under the ROC curve (AUC) was used to evaluate the sensitivity and specificity of the miRNAs from the tissue specimens as a diagnostic marker for the detection of colorectal adenocarcinoma. Combination analysis was calculated by binary logistic regression. In the two-tailed test, a P-value less than 0.05 was considered statistically significant.
Results
miRNAs are Differentially Expressed in CRC Tissues Compared with Adjacent Paired Normal Tissues
Compared with the adjacent normal samples, in the cancer tissues, 7 of the 20 selected miRNAs were significantly dysregulated (P<0.05): 6 were downregulated (including miR-145, miR-23b, miR-204, miR-195, miR-23a, and miR-497), and only one showed upregulation (miR-429, upregulated more than 3.5-fold). The fold changes in all the dysregulated miRNAs were greater than 2-fold, upregulated or downregulated. Furthermore, miR-145 demonstrated the greatest change at more than 16-fold (Table 1, Figure 1).
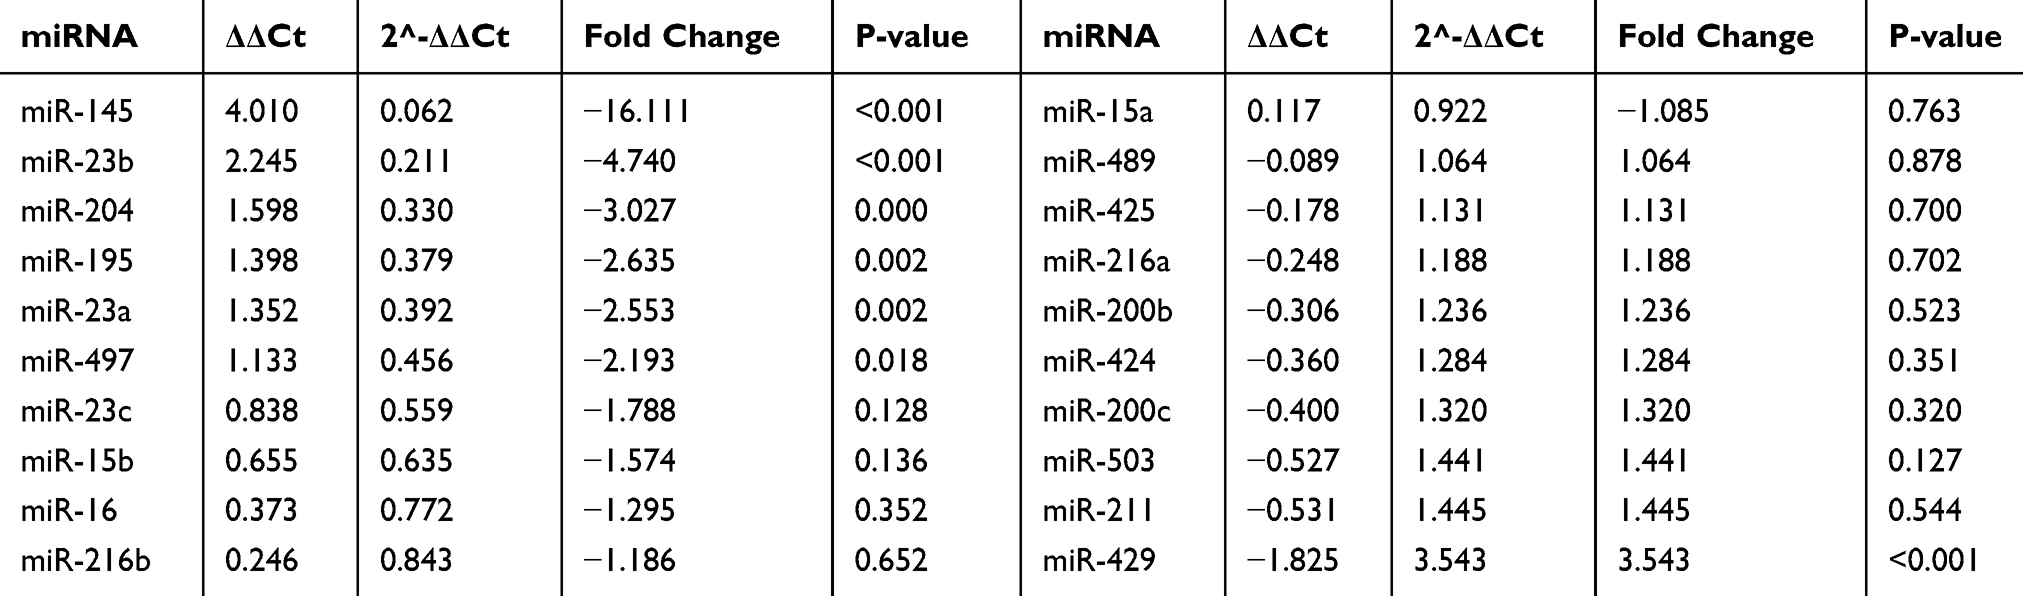 |
Table 1 Expression Levels of 20 miRNAs in Cancer Samples Compared with Those in Normal Controls by Paired t-Test. Compared with the Adjacent Normal Samples, in the Cancer Tissues, 7 of the 20 Selected miRNAs Were Significantly Dysregulated (P<0.05), and Were Likely to Be Good Candidates as Diagnostic Biomarkers. The Fold Changes in All the Dysregulated miRNAs Were Greater Than 2-Fold, Upregulated or Downregulated. Furthermore, miR-145 Demonstrated the Greatest Change at More Than 16-Fold |
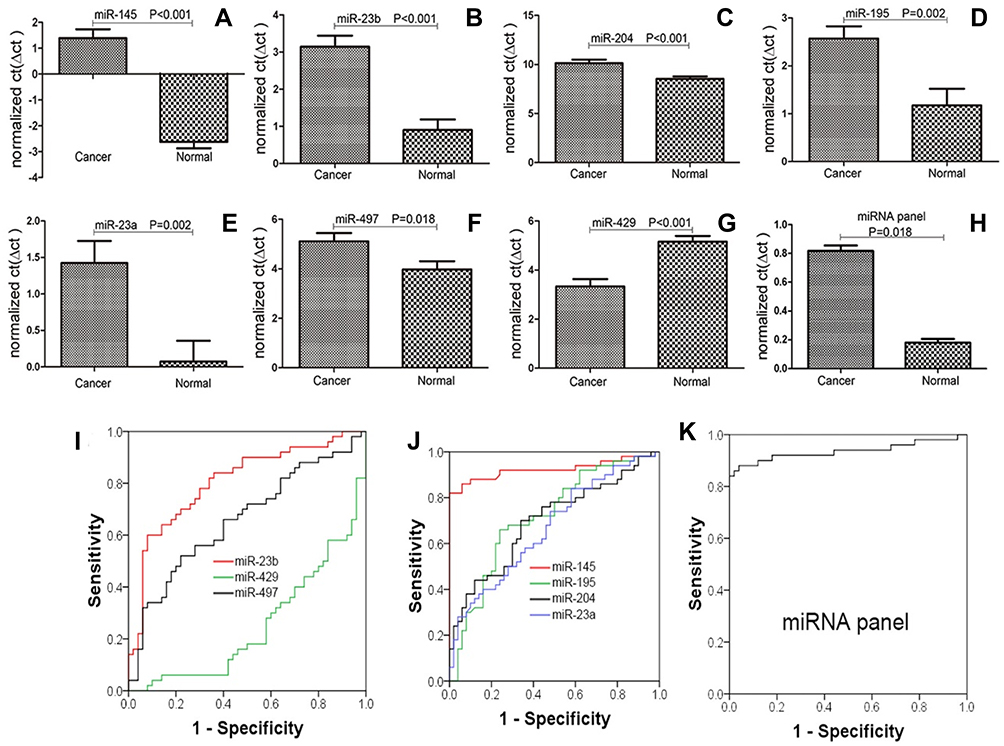 |
Figure 1 Comparison of the miRNA expression levels in cancerous and normal tissues. The results showed that miR-145, miR-23b, miR-204, miR-195, miR-23a, miR-497, miR-429, and the miRNA panel were significantly dysregulated (P<0.05)(A–H); ROC analysis demonstrated that miR-145, miR-23b, miR-195, and the miRNA panel could detect, with a high AUC value, patients with CRC. Regarding miR-204, miR-23a, miR-497, and miR-429, although they caused significant dysregulation, their sensitivity, specificity, and AUC values were unsatisfactory (I–K). |
miRNAs That Can Be Used as Biomarkers for the Diagnosis of Colorectal Adenocarcinoma
miR-145, miR-23b, miR-204, miR-195, miR-23a, miR-497, and miR-429 were significantly dysregulated. These findings prompted us to further evaluate their potential as CRC biomarkers by analyzing their sensitivity and specificity in distinguishing CRC patients from healthy people by ROC analysis (Table 2, Figure 1). The results indicated that miR-145, miR-23b, and miR-195 are likely to be good biomarkers of CRC, with AUCs greater than 0.70. For miR-145, the sensitivity, specificity, and AUC values were 90%, 88%, and 0.924, respectively (P<0.001). For miR-23b, the values were 78%, 70%, and 0.806, respectively (P<0.001). For miR-195, the values were 72%, 74%, and 0.715, respectively (P<0.001). Regarding the other miRNAs, either the sensitivity and specificity values were less than 70% or the AUC values were less than or equal to 0.7, indicating that none of these miRNAs (miR-204, miR-23a, miR-497, and miR-429) were good biomarkers of CRC. Furthermore, we determined whether the diagnostic capacity could be increased when miR-145, miR-23b, and miR-195 were combined to serve as a panel of miRNA biomarkers. The binary logistic regression and ROC results demonstrated that the panel of miRNA biomarkers could distinguish CRC from normal adjacent samples with remarkable diagnostic accuracy—the sensitivity, specificity, and AUC values were 100%, 84%, and 0.936, respectively (P<0.001) (Figure 1, Table 2). The 95% confidence interval for the binary logistic regression analysis of the miRNA panel was 0.1330 to 0.2333; using the cutoff value of 0.2333 allowed correct prediction of 46 of 50 (92%) tumor samples (Figure 2), suggesting that the miRNA panel is an accurate biomarker for CRC diagnosis.
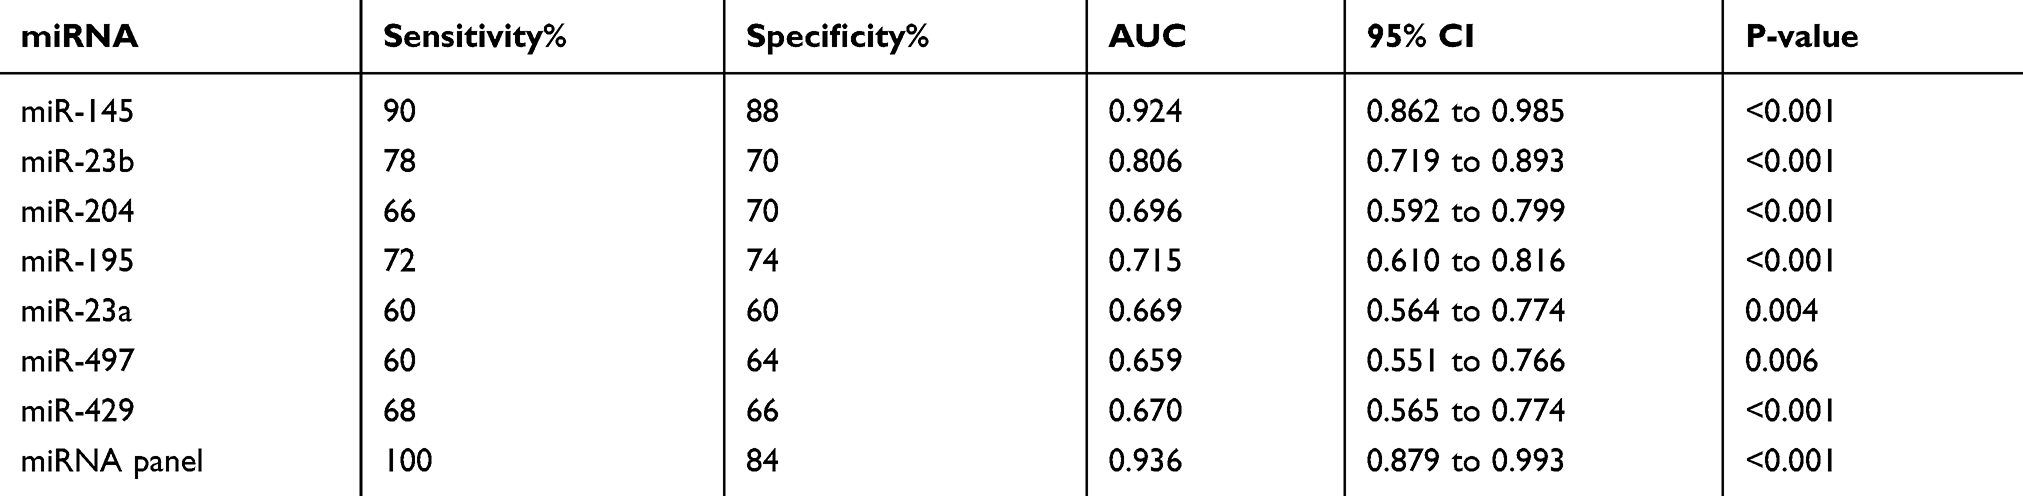 |
Table 2 Evaluation of the Potential of miRNAs and the miRNA Panel to Act as CRC Biomarkers Using ROC Analysis. The Results Showed That miR-145, miR-23b, and miR-195 are Suitable as Biomarkers, with AUC Values Greater Than 0.7. The miRNA Panel Could Improve the Sensitivity, Specificity, and AUC Value, Producing the Highest AUC Value |
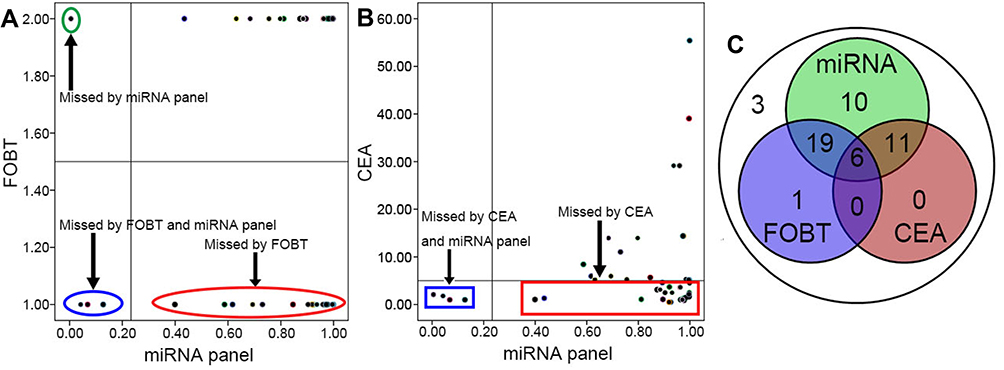 |
Figure 2 Combination of the miRNA panel, FOBT, and CEA measurement to detect CRC. The results demonstrated that the miRNA panel could clearly increase the positivity rate and significantly decrease the missed diagnosis rate; however, at a certain level, the FOBT and CEA measurement could also complement the miRNA panel (A–C). |
Combination of the miRNA Panel with the FOBT to Diagnose Patients with Cancer
All the patients in this study underwent the FOBT before surgery, which is one of the general clinical examinations, especially for patients with suspected CRC. In this research, a sample with a positive FOBT was marked as 2, and a sample with a negative FOBT was marked as 1. Based on the test results, of the 50 CRC patients, 26 (52%) would have been identified as positive and 24 would have been misdiagnosed when the FOBT was used to detect CRC (Table 3). Furthermore, we overlapped the diagnostic results of the miRNA panel and those of the FOBT, and the results showed that 25 CRC patients would have been diagnosed using both the miRNA panel and FOBT; only one patient would have been diagnosed by the FOBT alone and not by the miRNA panel. However, 24 patients whose diagnosis was missed by the FOBT would have been diagnosed by the miRNA panel (Figure 2).
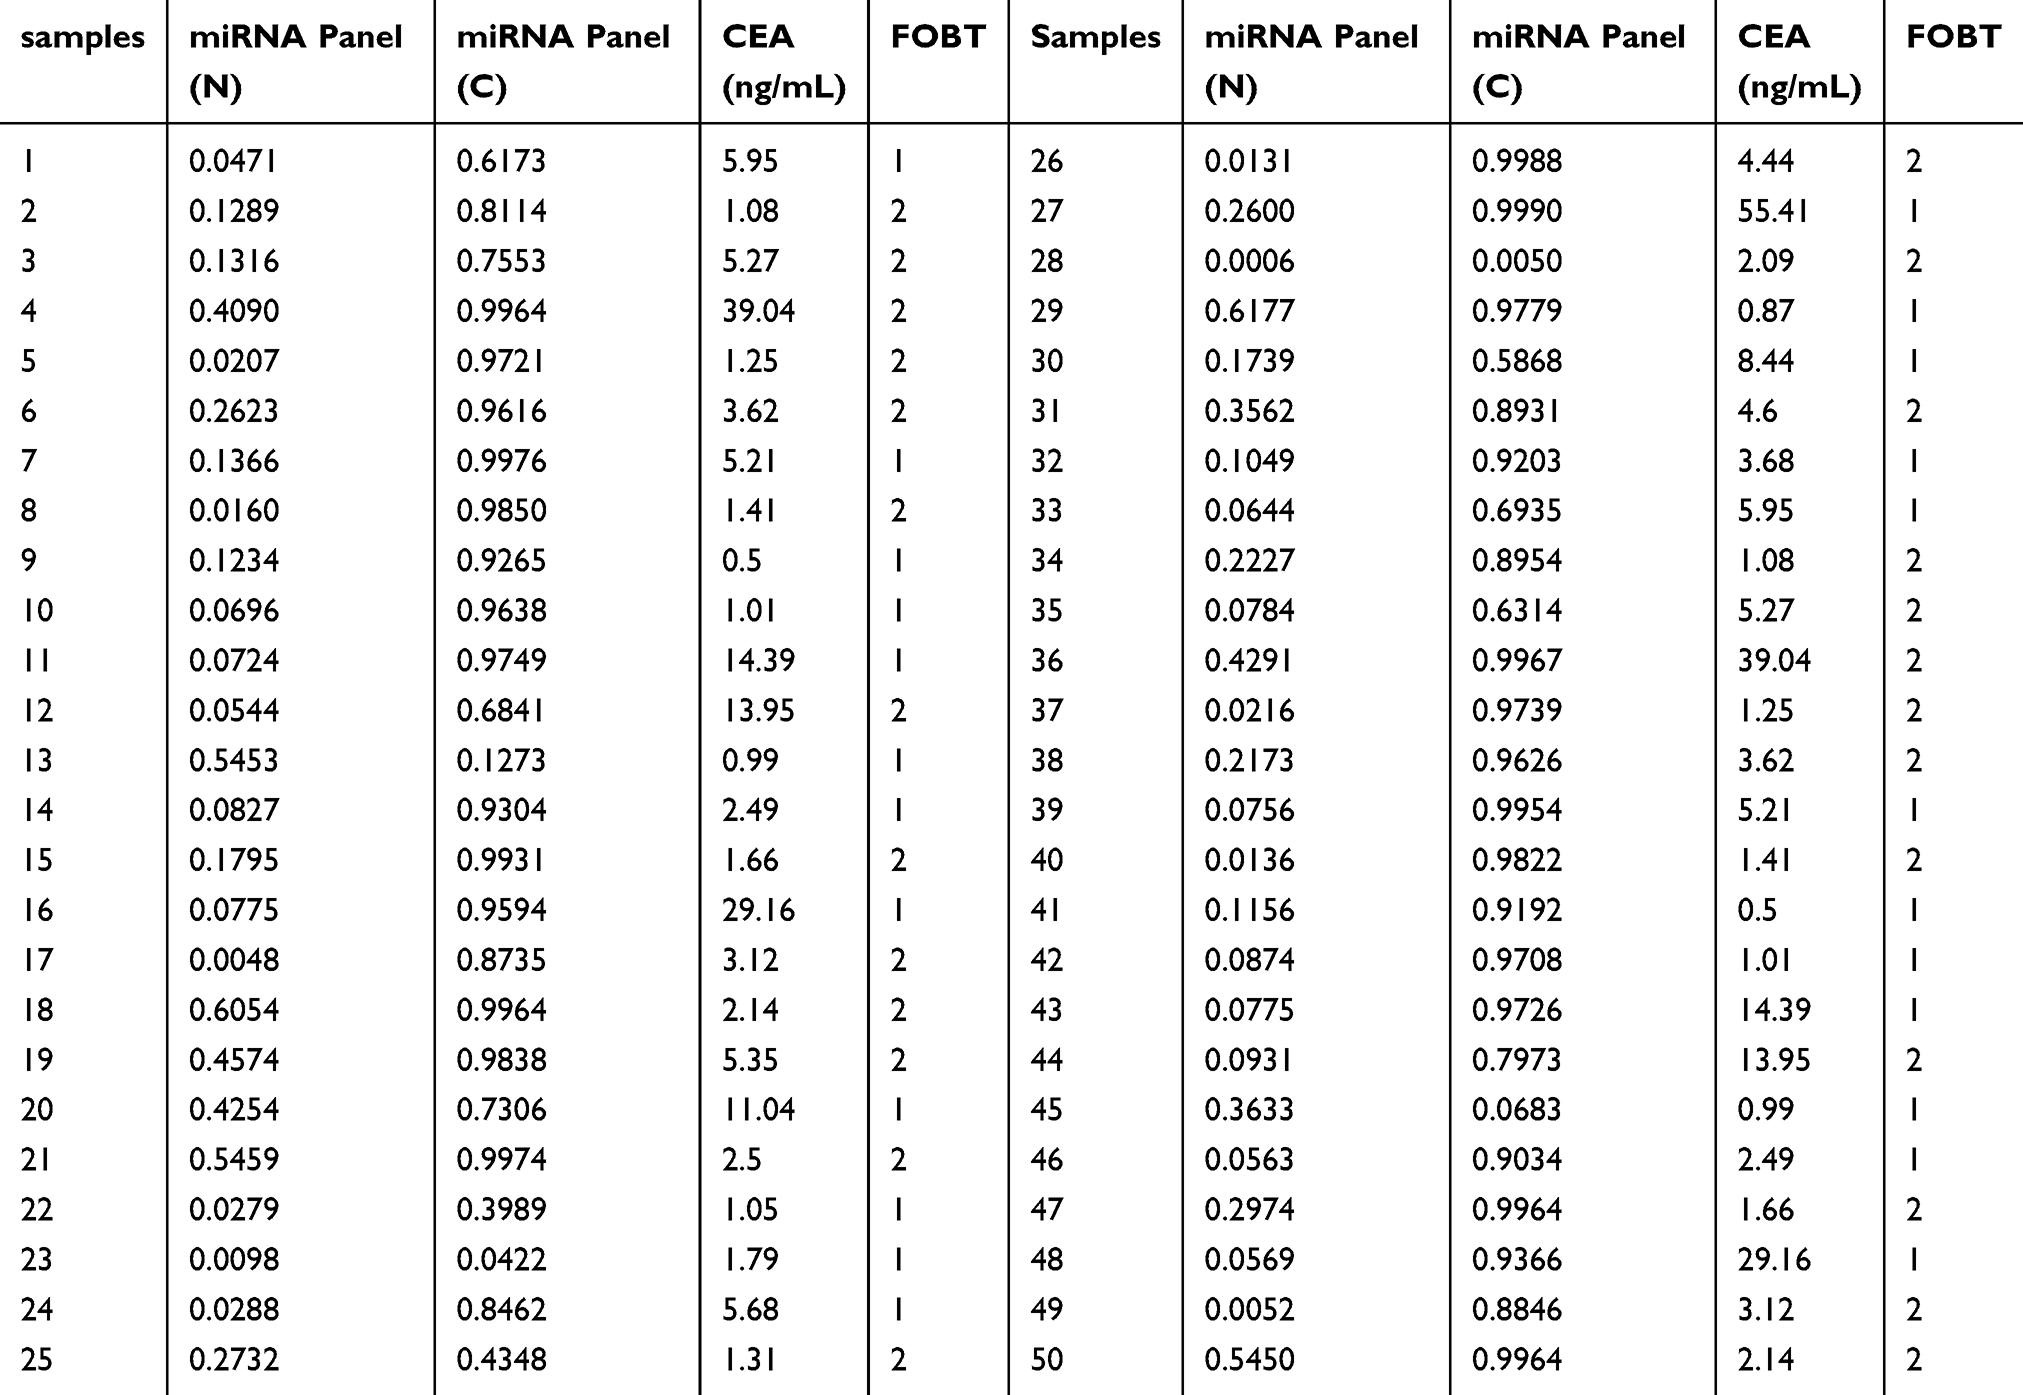 |
Table 3 Results of the FOBT and CEA Measurement. In This Study, a Sample with a Positive FOBT Was Marked as 2, and a Sample with a Negative FOBT Was Marked as 1. miRNA Panel (N) Represents the Results of Binary Logistic Regression of the Expression Level of the miRNA Panel in Normal Samples, and miRNA Panel (C) Represents the Results of Binary Logistic Regression of the Expression Level of the miRNA Panel in Cancer Samples; the 95% Confidence Interval for the Mean of the miRNA Panel (N) Was [0.1300, 0.2333], and a Value of miRNA(C) Greater Than 0.2333 Was Identified as Positive |
Combination of the miRNA Panel and CEA Measurement to Diagnose Patients with Cancer
Similar to the FOBT, CEA measurement is also a routine measurement performed in CRC patients presurgery and is used to distinguish between cancer patients and normal individuals. A hint of cancer was detected when the CEA measurement was greater than 5.00 ng/mL. According to the results of CEA measurement, 17 (34%) patients could be distinguished from normal samples, and 33 (66%) patients would likely have been misdiagnosed as normal or with other diseases. Similar to the FOBT, an overlap of the miRNA panel and CEA measurement was observed, where all 17 patients with a positive CEA result could be diagnosed using the miRNA panel. Furthermore, 29 (58%) patients could have been diagnosed using the miRNA panel but not by CEA measurement (Figure 2).
Combination of the miRNA Panel, FOBT, and CEA Measurement to Diagnose Patients with Cancer
The FOBT and CEA measurement are routine clinical examinations that have been available for years,28 resulting in a minor decrease in mortality.8,29,30 In this study, 37 patients could be diagnosed when the FOBT and CEA measurement were combined, and the diagnostic rate was increased to 74% (37/50) compared with the FOBT or CEA measurement alone. miRNAs have been reported to act as useful biomarkers with high sensitivity and specificity for CRC detection. Interestingly, we further investigated whether the diagnostic rate could be increased when the FOBT, CEA measurement, and miRNA panel were used together to screen CRC patients. As we had predicted, the diagnostic level was improved substantially from 74% (37/50) to 94% (47/50). Importantly, the diagnostic capability of the miRNA panel as a single screening tool was greater than that of the FOBT or CEA measurement, and the values for the miRNA panel, FOBT, and CEA measurement were 92% (46/50), 52% (26/50), and 34% (17/50), respectively. Additionally, the diagnostic rate of the miRNA panel was greater than the combined diagnostic rate of the FOBT and CEA measurement at 74% (37/50) (Figure 2).
Discussion
CRC is one of the most prevalent cancers with high mortality and morbidity and has attracted considerable attention. Various techniques are available to screen for CRC. Despite some progress, the current screening tools for CRC, including the FOBT and CEA measurement, remain limited and exhibit low sensitivity and specificity. The FOBT and CEA measurement represent the most commonly used methods for CRC detection and are also the predominant options in most population-based screening programs worldwide. Because of their noninvasive nature and relatively low cost, they are the most accepted techniques by doctors and patients. Due to unsatisfactory sensitivity and specificity, however, many CRC patients are screened for the presence of signs or symptoms, which typically appear in advanced phases or even as missed diagnoses.
In this study, each patient underwent the FOBT and CEA measurement before surgery. As expected, the FOBT test could screen only 26 of 50 CRC patients (26/50), with a probability of 52%. Regarding CEA measurement, the results were more disappointing; the positive rate of detecting CRC was only 34% (17/50). Even when the FOBT and CEA measurement were used together to distinguish CRC, no obvious improvement in the positive rate was found. This result is consistent with those of previous studies that reported a high false-negative rate when the FOBT and CEA measurement were used as CRC diagnostic biomarkers. Colonoscopy is considered the gold standard of excellence for the diagnosis of CRC, with high sensitivity and specificity31,32 and is effective in reducing CRC-related mortality. Although it plays a key role in CRC detection by providing a visual diagnosis, colonoscopy has some inevitable disadvantages, such as perforation or bleeding. Furthermore, lesion miss rates still exist for large polyps and cancers.33,34 A good colonic cleansing preparation is required before the procedure, and experienced endoscopists with an extensive history of examinations are needed.35 Other disadvantages of colonoscopy include its cost and unsatisfactory acceptance caused by fear of anesthesia and shame related to the exposure of private parts. In these cases, the search for better biomarkers is of paramount importance.
MiRNAs have been shown to directly impact tumor growth, tumor cell proliferation, and tumor invasion36 and have been demonstrated to be potential biomarkers of CRC. Many dysregulated miRNAs have been identified in CRC specimens. Several miRNAs with potential biological and clinical relevance have been identified and are under investigation as diagnostic, prognostic, and predictive biomarkers.37,38 In recent years, the medical community has investigated the potential of using miRNA as a novel biomarker for CRC detection. Because miRNAs have been identified to play an important role in the aberrant gene expression of cancer cells and appear to be cell-type and disease specific,13 they seem to be good candidates as diagnostic biomarkers.
We previously investigated the expression profile of 1549 miRNAs in CRC by qRT-PCR and identified more than 100 miRNAs that were significantly dysregulated (upregulated or downregulated).26,39 Numerous reports have focused on the potential of using miRNAs as novel biomarkers for CRC screening. However, few studies have investigated the probability of combining miRNA and other CRC detection tools, such as CEA measurement and the FOBT, which are applied clinically as a diagnostic composite. In the present study, miRNA was first combined with CEA measurement and the FOBT for CRC screening.
The miRNAs selected in this paper have been previously reported to be dysregulated in many types of cancer but have never been researched as a diagnostic panel. Various molecular mechanisms are generally known to be involved in the development of tumors and in tumorigenesis involving multiple gene functional changes. Certainly, whether these miRNAs will be confirmed as CRC diagnostic biomarkers in future clinical trials remains questionable, and further investigations are warranted. First, we compared the expression levels of 20 miRNAs in CRC tumor tissues to those in paired normal tissues; of the 20 miRNAs, 7 (miR-145, miR-23b, miR-204, miR-195, miR-23a, miR-497, and miR-429) exhibited good potential as biomarkers to distinguish CRC patients from normal individuals, with statistically significant dysregulation, and 6 of these 7 miRNAs were downregulated (only miR-429 was upregulated). Additionally, to verify this possibility, ROC curve analysis was performed to analyze their sensitivity and specificity to distinguish CRC patients from the normal population. The results revealed that miR-145, miR-23b, and miR-195 are suitable as diagnostic biomarkers. Their AUC, sensitivity, and specificity values were 0.924, 90%, and 88%; 0.806, 78%, and 70%; and 0.715, 72%, and 68%, respectively. Additionally, the AUC values were all greater than 0.7.40 For the other four miRNAs, the AUCs were less than 0.7. Next, we tried to evaluate the ability of the panel of miR-145, miR-23b, and miR-195 to diagnose CRC. The results showed that this panel can substantially increase the accuracy of CRC screening, with high sensitivity and specificity, especially compared with the FOBT, CEA measurement, or even the combination of the FOBT and CEA measurement. Interestingly, the most important aspect of this study was that we tried to combine the miRNAs, FOBT, and CEA measurement into a CRC diagnostic panel. When they were combined, the miRNAs markedly increased the accuracy of the FOBT and CEA measurement to diagnose CRC from 74% to 94%. Additionally, the FOBT and CEA measurement could also improve the positive rate of using miRNA as a diagnostic biomarker even in a limited range, with the positive rate increasing from 92% to 94%. Any degree of improvement may provide important benefits for patients.
To our knowledge, for the first time, this study aimed to compare the diagnostic accuracy of a potential biomarker and two current clinical diagnostic tools and analyzed the sensitivity and specificity of using these potential and current clinical markers in combination to screen for CRC.
Nevertheless, this study has some limitations. All the patients were recruited from the Third Affiliated Hospital of Guangzhou Medical University, and the small sample size may have yielded biased results and decreased the sensitivity and specificity of the test, although this study was balanced in sample composition. Prompted by these findings, larger-scale validation across multiple centers and different research teams will be conducted before the miRNAs or the panel can be applied as a routine clinical diagnostic tool. In conclusion, the present study demonstrated that miRNAs can be utilized as potential biomarkers; as a diagnostic panel, miRNAs, the FOBT, and CEA measurement increase each other’s ability to detect CRC. Further research is necessary to explore whether this panel of miRNAs is also effective for detection.
Acknowledgments
Genecopoeia Guangzhou, China. Key Laboratory of Reproduction and Genetics of Guangdong Higher Education Institutes, China. We thank Ms. Qingping Jiang in the Department of Pathology, Third Affiliated Hospital of Guangzhou Medical University for editing this manuscript. The miRNA profiling and qRT-PCR in this study were performed at Genecopoeia Guangzhou, China. Huaping Li and his colleagues provided substantial support during the experiments.
Author Contributions
All authors made substantial contributions to conception and design, acquisition of data, analysis and interpretation of data; took part in drafting the article or revising it critically for important intellectual content; gave final approval of the version to be published; and agree to be accountable for all aspects of the work.
Disclosure
The authors report no conflicts of interest in this work.
References
1. Arnold M, Sierra MS, Laversanne M, et al. Global patterns and trends in colorectal cancer incidence and mortality. Gut. 2017;66(4):683–691. doi:10.1136/gutjnl-2015-310912
2. Jemal A, Bray F, Center MM, et al. Global cancer statistics. CA Cancer J Clin. 2011;61(2):69–90. doi:10.3322/caac.v61:2
3. Sung JJ, Ng SC, Chan FKL, et al. An updated Asia Pacific consensus recommendations on colorectal cancer. Gut. 2015;64(1):121–132. doi:10.1136/gutjnl-2013-306503
4. Tamakoshi A, Nakamura K, Ukawa S, et al. Characteristics and prognosis of Japanese colorectal cancer patients: the biobank japan project. J Epidemiol. 2017;27(3):S36–S42. doi:10.1016/j.je.2016.12.004
5. Gupta A, Brenner D, Turgeon D. Early detection of colon cancer: new tests on the horizon. Mol Diagn Ther. 2008;12(2):77–85. doi:10.1007/BF03256273
6. Pawa N, Arulampalam T, Norton J. Screening for colorectal cancer: established and emerging modalities. Nat Rev Gastroenterol Hepatol. 2011;8(12):711–722. doi:10.1038/nrgastro.2011.205
7. Sung JJ, Lau JYW, Young GP, et al. Asia Pacific consensus recommendations for colorectal cancer screening. Gut. 2008;57(8):1166–1176. doi:10.1136/gut.2007.146316
8. Dominic OG, McGarrity T, Dignan M, Lengerich EJ. American college of gastroenterology guidelines for colorectal cancer screening 2008. Am J Gastroenterol. 2009;104(10):2626–2627. doi:10.1038/ajg.2009.419
9. Dong Y, Wu WKK, Wu CW, et al. MicroRNA dysregulation in colorectal cancer: a clinical perspective. Br J Cancer. 2011;104(6):893–898. doi:10.1038/bjc.2011.57
10. Kumaravel V, Hayden SP, Hall GS, Burke CA. New fecal occult blood tests may improve adherence and mortality rates. Cleve Clin J Med. 2011;78(8):515–520. doi:10.3949/ccjm.78a.11024
11. Ng S, Wong S. Colorectal cancer screening in Asia. Br Med Bull. 2013;105(1):29–42. doi:10.1093/bmb/lds040
12. Joshua T, Eric N. MicroRNAs in stress signaling and human disease. Cell. 2012;148(6):1172–1187. doi:10.1016/j.cell.2012.02.005
13. Hrašovec S, Glavač D. MicroRNAs as novel biomarkers in colorectal cancer. Front Genet. 2012;3:180. doi:10.3389/fgene.2012.00180
14. Michael MZ, O’Connor SM, van Holst Pellekaan NG, Young GP, James RJ. Reduced accumulation of specific microRNAs in colorectal neoplasia. Mol Cancer Res. 2003;1(12):882–891.
15. Ng EK, Tsang WP, Ng SSM, et al. MicroRNA-143 targets DNA methyltransferases 3A in colorectal cancer. Br J Cancer. 2009;101(4):699–706. doi:10.1038/sj.bjc.6605195
16. Schepeler T, Reinert JT, Ostenfeld MS, et al. Diagnostic and prognostic microRNAs in stage II colon cancer. Cancer Res. 2008;68(15):6416–6424. doi:10.1158/0008-5472.CAN-07-6110
17. Chen X, Guo X, Zhang H, et al. Role of miR-143 targeting KRAS in colorectal tumorigenesis. Oncogene. 2009;28(10):1385–1392. doi:10.1038/onc.2008.474
18. Schetter A, Leung SY, Sohn JJ, et al. MicroRNA expression profiles associated with prognosis and therapeutic outcome in colon adenocarcinoma. JAMA. 2008;299(4):425–436. doi:10.1001/jama.299.4.425
19. Meng F, Henson R, Wehbe–Janek H, et al. MicroRNA-21 regulates expression of the PTEN tumor suppressor gene in human hepatocellular cancer. Gastroenterology. 2007;133(2):647–658. doi:10.1053/j.gastro.2007.05.022
20. Talotta F, Cimmino A, Matarazzo MR, et al. An autoregulatory loop mediated by miR-21 and PDCD4 controls the AP-1 activity in RAS transformation. Oncogene. 2009;28(1):73–84. doi:10.1038/onc.2008.370
21. Diosdado B, van de Wiel MA, Terhaar Sive Droste JS, et al. MiR-17-92 cluster is associated with 13q gain and c-myc expression during colorectal adenoma to adenocarcinoma progression. Br J Cancer. 2009;101(4):707–714. doi:10.1038/sj.bjc.6605037
22. Tsuchida A, Ohno S, Wu W, et al. MiR-92 is a key oncogenic component of the miR-17-92 cluster in colon cancer. Cancer Sci. 2011;102(12):2264–2271. doi:10.1111/cas.2011.102.issue-12
23. Nagel R, le Sage C, Diosdado B, et al. Regulation of the adenomatous polyposis coli gene by the miR-135 family in colorectal cancer. Cancer Res. 2008;68(14):5795–5802. doi:10.1158/0008-5472.CAN-08-0951
24. Monzo M, Navarro A, Bandres E, et al. Overlapping expression of microRNAs in human embryonic colon and colorectal cancer. Cell Res. 2008;18(8):823–833. doi:10.1038/cr.2008.81
25. Wu X, Xu X, Li S, et al. Identification and validation of potential biomarkers for the detection of dysregulated microRNA by qPCR in patients with colorectal adenocarcinoma. PLoS One. 2015;10(3):e0120024. doi:10.1371/journal.pone.0120024
26. Wu X, Li S, Xu X, et al. The potential value of miR-1 and miR-374b as biomarkers for colorectal cancer. Int J Clin Exp Pathol. 2015;8(3):2840–2851.
27. Livak K, Schmittgen T. Analysis of relative gene expression data using real-time quantitative PCR and the 2-ΔΔCT method. Methods. 2001;25(4):402–408. doi:10.1006/meth.2001.1262
28. Weizman A, Nguyen G. Colon cancer screening in 2010: an up-date. Minerva Gastroenterol Dietol. 2010;56(2):181–188.
29. Levine J. Screening and surveillance for colorectal neoplasia: uncertainties of colonoscopic management. Pol Arch Med Wewn. 2008;118(5):302–306.
30. Whitlock E, Lin J, Liles E, Beil TL, Fu R. Screening for colorectal cancer: a targeted, updated systematic review for the U.S. Preventive services task force. Ann Intern Med. 2008;149(9):638–658. doi:10.7326/0003-4819-149-9-200811040-00245
31. Graser A, Stieber P, Nagel D, et al. Comparison of CT colonography, colonoscopy, sigmoidoscopy and faecal occult blood tests for the detection of advanced adenoma in an average risk population. Gut. 2009;58(2):241–248. doi:10.1136/gut.2008.156448
32. Sung JJY, Chan FKL, Leung WK, et al. Screening for colorectal cancer in Chinese: comparison of fecal occult blood test, flexible sigmoidoscopy, and colonoscopy. Gastroenterology. 2003;124(3):608–614. doi:10.1053/gast.2003.50090
33. Chen S, Rex D. Endoscopist can be more powerful than age and male gender in predicting adenoma detection at colonoscopy. Am J Gastroenterol. 2007;102(4):856–861. doi:10.1111/ajg.2007.102.issue-4
34. Corley D, Jensen C, Marks A. Can we improve adenoma detection rates? A systematic review of intervention studies. Gastrointest Endosc. 2011;74(3):656–665. doi:10.1016/j.gie.2011.04.017
35. Allison J. The best screening test for colorectal cancer is the one that gets done well. Gastrointest Endosc. 2010;71(2):342–345. doi:10.1016/j.gie.2009.10.032
36. Mayne G, Hussey D, Watson D. MicroRNAs and esophageal cancer—implications for pathogenesis and therapy. Curr Pharm Des. 2013;19(7):1211–1226. doi:10.2174/138161213804805702
37. Ahmed F, Jeffries CD, Vos PW, et al. Diagnostic microRNA markers for screening sporadic human colon cancer and active ulcerative colitis in stool and tissue. Cancer Genomics Proteomics. 2009;6(5):281–295.
38. Bandres E, Agirre X, Bitarte N, et al. Epigenetic regulation of microRNA expression in colorectal cancer. Int J Cancer. 2009;125(11):2737–2743. doi:10.1002/ijc.v125:11
39. Xu XH, Wu XB, Wu SB, Liu HB, Chen R, Li Y. Identification of miRNAs differentially expressed in clinical stages of human colorectal carcinoma—an investigation in Guangzhou, China. PLoS. 2014;9(4):e94060. doi:10.1371/journal.pone.0094060
40. Kunte D, Schepeler T, Reinert JT, et al. Dysregulation of microRNAs in colonic field carcinogenesis: implications for screening. PLoS One. 2012;7(9):e45591. doi:10.1371/journal.pone.0045591
 © 2020 The Author(s). This work is published and licensed by Dove Medical Press Limited. The full terms of this license are available at https://www.dovepress.com/terms.php and incorporate the Creative Commons Attribution - Non Commercial (unported, v3.0) License.
By accessing the work you hereby accept the Terms. Non-commercial uses of the work are permitted without any further permission from Dove Medical Press Limited, provided the work is properly attributed. For permission for commercial use of this work, please see paragraphs 4.2 and 5 of our Terms.
© 2020 The Author(s). This work is published and licensed by Dove Medical Press Limited. The full terms of this license are available at https://www.dovepress.com/terms.php and incorporate the Creative Commons Attribution - Non Commercial (unported, v3.0) License.
By accessing the work you hereby accept the Terms. Non-commercial uses of the work are permitted without any further permission from Dove Medical Press Limited, provided the work is properly attributed. For permission for commercial use of this work, please see paragraphs 4.2 and 5 of our Terms.