")
Back to Journals » Journal of Asthma and Allergy » Volume 15
Diagnostic Value of a Novel Eosinophil Cationic Protein-Myeloperoxidase Test Paper Before and After Treatment for Allergic Rhinitis
Authors Xi Y, Deng YQ, Li HD, Jiao WE, Chen J, Chen JJ, Tao ZZ
Received 25 May 2022
Accepted for publication 19 July 2022
Published 4 August 2022 Volume 2022:15 Pages 1005—1019
DOI https://doi.org/10.2147/JAA.S375069
Checked for plagiarism Yes
Review by Single anonymous peer review
Peer reviewer comments 2
Editor who approved publication: Dr Luis Garcia-Marcos
Yang Xi,1,* Yu-Qin Deng,1,2,* Han-Da Li,1 Wo-Er Jiao,1 Jin Chen,2 Jian-Jun Chen,3 Ze-Zhang Tao1,2
1Department of Otolaryngology, Head and Neck Surgery, Renmin Hospital of Wuhan University, Wuhan, People’s Republic of China; 2Institute of Otolaryngology, Head and Neck Surgery, Renmin Hospital of Wuhan University, Wuhan, People’s Republic of China; 3Department of Otorhinolaryngology, Union Hospital, Tongji Medical College, Huazhong University of Science and Technology, Wuhan, People’s Republic of China
*These authors contributed equally to this work
Correspondence: Ze-Zhang Tao, Department of Otolaryngology, Head and Neck Surgery Renmin Hospital of Wuhan University, 238 Jie-Fang Road, Wuhan, 430060, Hubei, People’s Republic of China, Tel +86 13907141892, Fax +86 27 88043958, Email [email protected] Jian-Jun Chen, Department of Otorhinolaryngology, Union Hospital, Tongji Medical College, Huazhong University of Science and Technology, 1277 Jiefang Avenue, Jianghan District, Wuhan, 430060, Hubei, People’s Republic of China, Tel +86 13659851719, Fax +86 27 85726300, Email [email protected]
Purpose: To develop and evaluate the effectiveness/clinical application of an eosinophil cationic protein-myeloperoxidase (ECP-MPO) test paper before and after treatment in patients with allergic rhinitis (AR).
Patients and Methods: We included 40 controls and 106 AR patients who were enrolled in the Allergy Clinic of Renmin Hospital of Wuhan University. Total IgE, specific IgE and skin prick test (SPT) were detected in all participants. AR patients were treated with oral cetirizine hydrochloride for 14 days. The ECP-MPO test paper results, nasal secretion smear and eosinophil counts, rhinoconjunctivitis total nasal symptom score (TNSS), quality of life questionnaire (RQLQ), visual analogue scale (VAS), serum Th1/Th2/Th17 cytokine, and chemokine data were collected pre- and post-treatment. ECP concentrations in nasal secretions were assessed by ELISA. Pearson correlation test and Kappa consistency test were used for statistical analysis.
Results: The post-treatment colour grade of the ECP-MPO test paper was lower in AR patients than the pre-treatment grade. The chromogenic grade correlated positively with the ECP concentration and the eosinophil count in nasal secretions both before and after treatment. Positive ECP-MPO test paper results were consistent with positive SPT, Der p-IgE and Der f-IgE result (Kappa values, 0.843, 0.810, 0.795, respectively). The pre- and post-treatment chromogenic grades correlated positively with the TNSS (r1=0· 691; r2=0· 539), RQLQ (r1=0· 783; r2=0· 625), and VAS (r1=0· 703; r2=0· 682) scores in AR patients.
Conclusion: The ECP-MPO test paper can effectively detect ECP in nasal secretions, and its results are consistent with those from the SPT, Der p-IgE and Der f-IgE result. Its chromogenic grade can reflect the symptom severity and specific cytokine and chemokine levels in AR patients.
Keywords: allergic rhinitis, eosinophil cationic protein, nasal secretion, cytokine, chemokine
Introduction
Allergic rhinitis (AR) is an IgE-mediated nasal mucosal allergic disease characterized by paroxysmal repetitive sneezing, runny nose, and nasal congestion. Pathologically, local nasal mucosal accumulation of eosinophils is the main feature of AR.1 Studies have shown that the nasal eosinophil count is related to the severity of clinical symptoms,2 and can be applied for diagnosing AR.3,4 Thus, it is widely accepted that eosinophils are closely related to the occurrence and development of AR.
Eosinophil cationic protein (ECP) is mainly stored in eosinophil secretory granules and secreted when stimulated by secretory substances such as immunoglobulins and complements. It has bactericidal and antiviral properties.5 ECP can be detected in most biological fluids as a marker of eosinophil inflammation.6,7 This makes it possible to diagnose AR by detecting ECP, which is a marker of eosinophils.
Commonly used AR diagnostic methods such as allergen testing usually do not yield immediate results. The development of instant detection methods can improve detection speed and efficiency. At present, ECP detection methods have many limitations. The test paper evaluated in this study is the first method devised to detect ECP in local nasal secretions, and yields results in 10 min. It is non-invasive, convenient, and rapid, and can be applied to large patient populations and at local hospitals with limited medical resources.
In addition to detecting local ECP, this test paper can also detect myeloperoxidase (MPO), thus the name ECP-MPO test paper. MPO is a heme enzyme and is an important index for distinguishing infective rhinitis; 8,9 therefore, this test paper can also be used to distinguish AR from infectious rhinitis. In this article, we tested the diagnostic effectiveness of the ECP-MPO test paper in AR and its ability to detect the degree of allergic inflammation before and after treatment.
Materials and Methods
Study Design
In this study, outpatients of Renmin Hospital of Wuhan University and controls were prospectively recruited from June to August 2021. All participants provided informed consent, and tested negative for coronavirus disease (COVID-19) nucleic acid within seven days of the first visit. The research program was approved by the Ethics Committee of Renmin Hospital of Wuhan University (WDRY2021-K052) and registered in Chinese Clinical Trial Registry (NO. ChiCTR2200057205). This study was conducted in accordance with the Declaration of Helsinki.
Study Participants
A total of 40 controls and 179 subjects were included in this study. In the experimental group, 143 participants had complete examination and questionnaire information; 37 participants who were lost to follow-up were excluded. Finally, 106 participants in the experimental group were statistically analysed (Figure 1A).
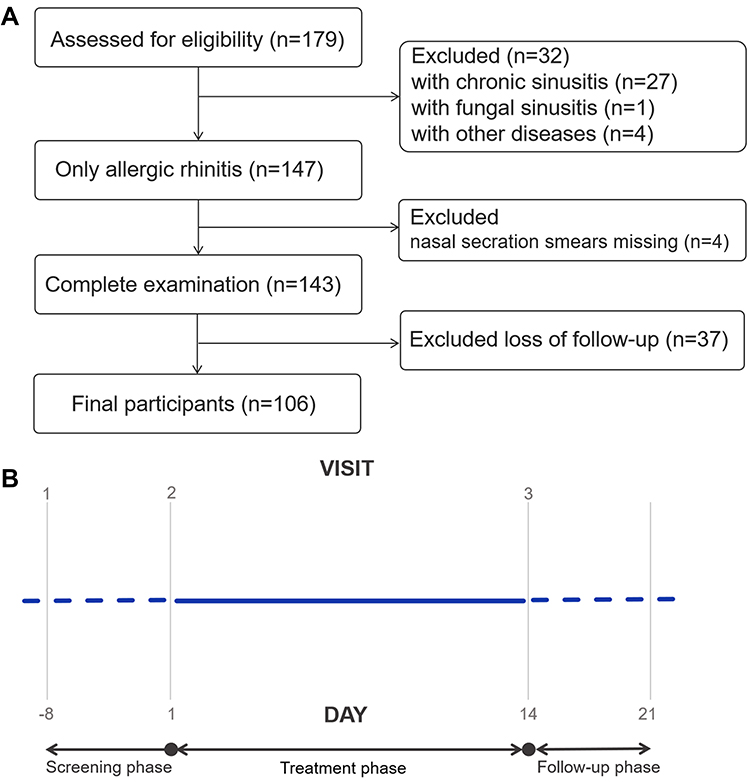 |
Figure 1 (A) Experimental group subject disposition. (B) Experimental group study design. |
The inclusion criteria for the experimental group were as follows: (1) Men or women aged 3–65 years; (2) meeting the AR clinical diagnostic criteria,10 as follows: (i) symptoms: sneezing, snot, nasal itching, and nasal congestion occur ≥2 times daily, with a duration ≥1 hour; (ii) signs: common nasal mucosa pallor, oedema, nasal clear water-like secretions. (iii) serum: specific IgE ≥ 0.35KU/L for at least one allergen within 12 months before the administration of the tested drug,11 or the diameter of the wheal in the skin prick test (SPT) was at least 3 mm larger than that in the negative control.12
The exclusion criteria for the experimental group were as follows: (1) nasal septum deviation (> 50%), obstructive inferior turbinate hypertrophy, and obstructive adenoid hypertrophy or evidence of nasal polyposis; (2) combined non-allergic rhinitis (vasomotor rhinitis, eosinophilia);13 (3) underwent nasal surgery within 90 days; (4) presence of any disease that necessitates the use of incompatible drugs (used oral or nasal glucocorticoids, oral or nasal antihistamines, anti anxiety drugs, sedatives, etc. within two weeks); (5) pregnancy or any serious underlying disease;14 (6) alcoholism or drug abuse/addiction; (7) not suitable for the trial as per researchers’ judgment; (8) Patients with MPO positive in ECP-MPO test paper.
Study Procedures
This was a nonrandomized trial. According to the inclusion criteria, the clinical trial population was divided into the control group and the experimental group. We defined the control group as patients without AR symptoms and signs and with negative IgE and SPT tests. Control participants were not given any drug treatment (blank control). AR patients visited the hospital three times, as follows: first visit (V1) confirmed the inclusion criteria. They were randomly recruited into the experimental group. During the screening period which lasted for 1 to 8 days, informed consent was obtained and basic information (ethnicity, height, weight, body mass index (BMI), history of chronic diseases, smoking and drinking history) was collected; second visit (V2): treatment day 1, treatment with cetirizine hydrochloride tablets (one tablet daily before bedtime), admission criteria were reconfirmed, electronic symptom questionnaires were applied, serum and nasal secretion smears were collected, and ECP-MPO test paper were applied; third visit (V3), re-examination day, occurred after day 14, electronic symptom questionnaires were applied and serum and nasal secretion smears were collected for ECP-MPO test paper analysis. Telephonic follow-up was carried out within seven days after the visit (Figure 1B).
Symptom Assessment Questionnaires
The clinical symptoms in the experimental group were evaluated at V2 and V3, and the following data were collected: total nasal symptom score (TNSS), which is the sum of four Rhinitis Symptom Scores (RTSS) including nasal itching, sneezing, runny nose, and nasal congestion, evaluated on a 4-point scale (0=asymptomatic, 1=mild symptoms, 2=moderate symptoms, 3=severe symptoms); Rhinoconjunctivitis Quality of Life Questionnaire (RQLQ); Visual Analog Scale (VAS; scale=0-100).15,16
Nasal Secretion Smear and Cell Count
The nasal secretions of the patients were evenly and thinly coated on slides and naturally air-dried for Swiss-Giemsa staining. After the staining was completed, the cells were counted and classified using a light microscope. The eosinophil count was determined at 400× magnification; the average value from five visual fields was taken.
Detection of Serum Cytokines and Chemokines
The serum (3 mL) of the patients was collected and analysed using an ECP estimation ELISA kit (Wuhan Zhongmin Taike Technology Co., Ltd., Wuhan, China). The levels of interleukin (IL)-2, IL-4, IL-6, interferon (IFN)- γ, tumour necrosis factor (TNF)-α, IL-17A, and IL-10 in the serum were detected using the Th1(IFN-γ, TNF-α and IL-2)/ Th2(IL-4, IL-6 and IL-10)/ Th17(IL-17A) CBA detection kit (BD Pharmingen, San Jose, CA, USA). The serum levels of C-C motif chemokine ligand (CCL)17, CCL22, CCL11, and CCL26 were obtained by Luminex detection (R&D Systems, Minneapolis, MN, USA).17,18
ECP-MPO Test Paper Development Process
Preparation of the gold standard pad: A labelled human ECP antibody solution and a MPO antibody solution were slowly dripped into a colloidal gold solution. The solution was stirred and the container was closed to obtain a colloidal solution with a particle diameter of 30–40 nm. Subsequently, the colloidal gold solution was centrifuged, the supernatant was discarded, and the precipitate was re-dissolved into a colloidal gold working solution at different proportions at 50% of the original volume. The labelled colloidal gold solution was added to a glass fibre film or a non-woven fabric, and after drying, the colloidal gold pad was made.
Nitrocellulose (NC) membrane coating: An NC film was coated with dilutions of human ECP and MPO antibodies and sheep anti-mouse IgG solutions at a density of 1.2 µL/cm using a film spray instrument. The coated NC film was then dried.
Test paper card assembly: In a dry room, the coated NC film was pasted in the middle of a plastic base plate, and 1/4 of the colloidal gold pad was then pasted on one side of the NC film Test(T) line; the sample pad was pasted on the other side of the colloidal gold pad. The suction pad was then set up on one side of the NC film Control(C) line. Finally, the plastic plate was cut into a 3–5 mm-wide test paper with a cutting machine, and then loaded onto the plastic card to construct a test paper card (Figure 2A). The test paper was prepared by Wuhan Dabai Xiaobai Technology Co., Ltd., Wuhan, China.
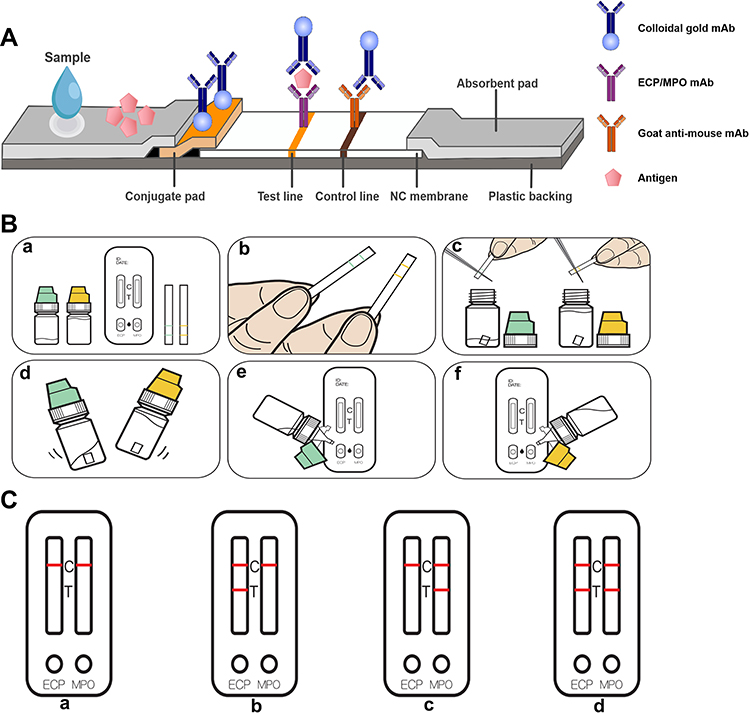 |
Figure 2 (A) Schematic diagram of the principle of the eosinophil cationic protein-myeloperoxidase (ECP-MPO) test paper. (B) Test paper operation steps: a. Take out the sample extract, test card, and sampling strip; b. allow the nasal secretions to infiltrate the scribe line of the sampling strip; c. cut the soaked sampling strip into the ECP extract (green) and MPO extract (yellow) strips along the scribe line; d. shake the bottles with the extracts for 15 seconds; e and f. Put two drops of the extracts from the green bottle and the yellow bottle on the ECP and MPO test holes respectively, and wait for 10 minutes; after the incubation time, read the results. (C) Test paper result display. a. normal; b. allergic inflammation; c. infectious inflammation; d. infectious inflammation or infectious inflammation combined with allergic inflammation. |
Testing of the ECP-MPO Test Paper Strips
A trained staff member gently put the sterile (autoclaved) 4 cm × 0.4 cm filter paper into the patient’s total nasal passage and retrieved to collect a small quantity of nasal secretions. After the filter paper fully absorbed the nasal secretions, the surface residue was wiped away gently, and a piece measuring 0.5×0.4 cm (at the first line) was cut and placed in 1 mL of sample extraction solution (1% bovine serum albumin solution). A second piece of the filter paper was cut (at the second line) and placed in 5 mL of 1% sample extraction solution. After shaking for 15s with a shaker, the sample extract was dropped into the sample hole of the test paper card, incubated for 10 minutes, and read by visual inspection (Figure 2B). The ECP-MPO test strip can detect ECP and MPO dissociated in nasal secretions. Figure 2C shows the four different test results of the ECP-MPO test strip.
By comparing the colour intensities of the detection and control lines, four grades were defined as follows: level 3, the detection and control line colour intensities are similar; level 2, the detection line is slightly lighter than the control line; level 1, the detection line is only slightly coloured; grade 0/negative, the detection line is not coloured (Figure 3A).
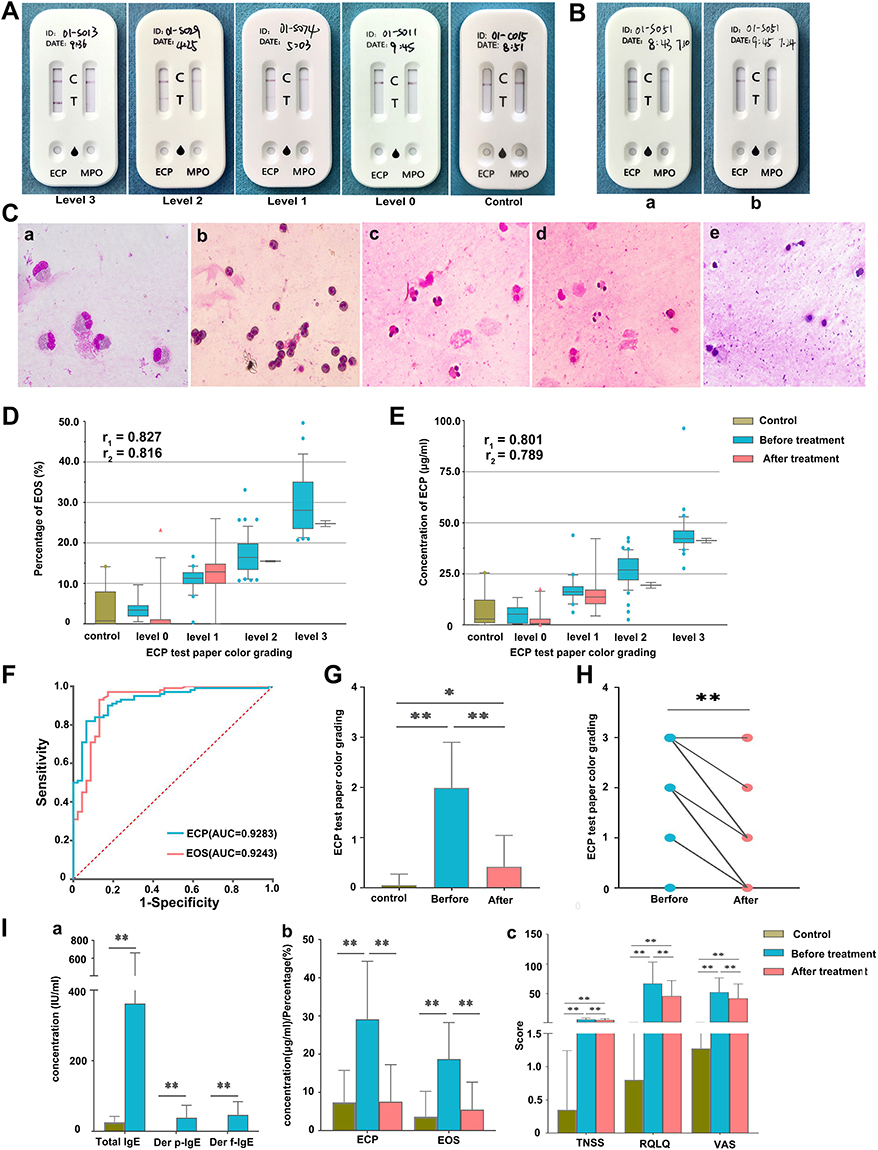 |
Figure 3 (A) Colour grading of the ECP-MPO test paper and test paper performance in samples from healthy control subjects. (B) Comparison of the eosinophil cationic protein-myeloperoxidase (ECP-MPO) test paper results before and after drug treatment. (C) Microscopic examination of nasal secretions. a. The morphology of eosinophils observed using oil-immersion microscopy; b. eosinophils from level 3 participants (400X); c. eosinophils from level 2 participants (400X); d. eosinophils from level 1 participants (400X); e. eosinophils from control participants (400X). (D) Correlation between the colour grade of the test paper and the percentage of eosinophils before and after treatment. (E) Correlation between the colour grade of the test paper and the ECP concentrations in nasal secretions before and after treatment. r1, correlation coefficient before treatment; r2, correlation coefficient after treatment. (F) Receiver operating curve (ROC) of ECP-MPO test paper. (G) The levels of color grading from all patients before and after treatment and control subjects. (H) Paired t-test of color grading level of ECP test paper before and after treatment in patient group. (I) a. Comparison of serum total IgE (IU/mL) and sIgE (IU/mL) in produced response to Der p and Der f between control participants and allergic rhinitis (AR) participants; b. comparison of serum eosinophil cationic protein (ECP) concentration (μg/mL) and the proportion of eosinophils under 400X magnification (light microscopy) between control participants and participants with AR before and after drug treatment; c. comparison of the total nasal symptom score (TNSS), quality of life questionnaire (RQLQ), and visual analogue scale (VAS) scores between the control group and the experimental group (with AR) before and after drug treatment. *, P<0.05; **, P<0.01. |
Sample Size Calculation and Statistical Analysis
The hypothesis of this study is that ECP-MPO test strip can effectively distinguish between AR patients and control patients. The study hypothesis is that the sensitivity and specificity of ECP-MPO test strip are greater than 0.7. In the previous experiment, the sensitivity and specificity of ECP-MPO test paper were 0.825 and 0.900, respectively. The ratio of test group to control group was 3:1, and the sample size was estimated by PASS11 (NCSS, Kaysville, Utah, USA). The results showed that at least 133 people needed to be included, including 100 in the experimental group and 33 in the control group. Considering the loss of follow-up rate of 20%, the study included 125 people in the experimental group and 41 in the control group. It can be seen that the sample size included in this study meets the minimum requirements.19,20
SPSS 19.0 (IBM, Armonk, NY, USA) and R 4.0.3 (R Foundation, Vienna, Austria) were used for statistical analysis using descriptive analysis, normal distribution, and analysis of variance. The results pertaining to normally distributed data are expressed as mean ± standard deviation (SD). The Shapiro–Wilk method was used to test for normality. Single factor analysis of variance (ANOVA) was used to compare groups, and the Tukey’s test was used for pairwise comparison. P<0.05 was regarded as statistically significant. Pearson’s correlation test was used to evaluate all correlations, and KAPPA test was used to evaluate the consistency of test paper diagnosis with total IgE, Der p-IgE, Der f-IgE and SPT diagnosis.
Results
Study Participants
A total of 106 AR patients (experimental group) and 40 control individuals (control group) were included in this study. There were 56 men and 50 women in the experimental group, with the following characteristics: men, women: average age, 21 years, 22 years; average height, 156.58 cm, 152.74 cm; average weight, 53.39 kg, 51.13 kg; history of smoking 5.7%, 2·8%; and history of drinking 6.6%, 7.5%. The baseline characteristics were not significantly different between men and women. Most of the patients were of Han ethnicity; Hui, Manchu, and Tujia ethnicities accounted for 1.9%, 1.9%, and 0.9% of the participants, respectively. The control group comprised 19 men and 21 women, with an average age of 21 years (Table 1).
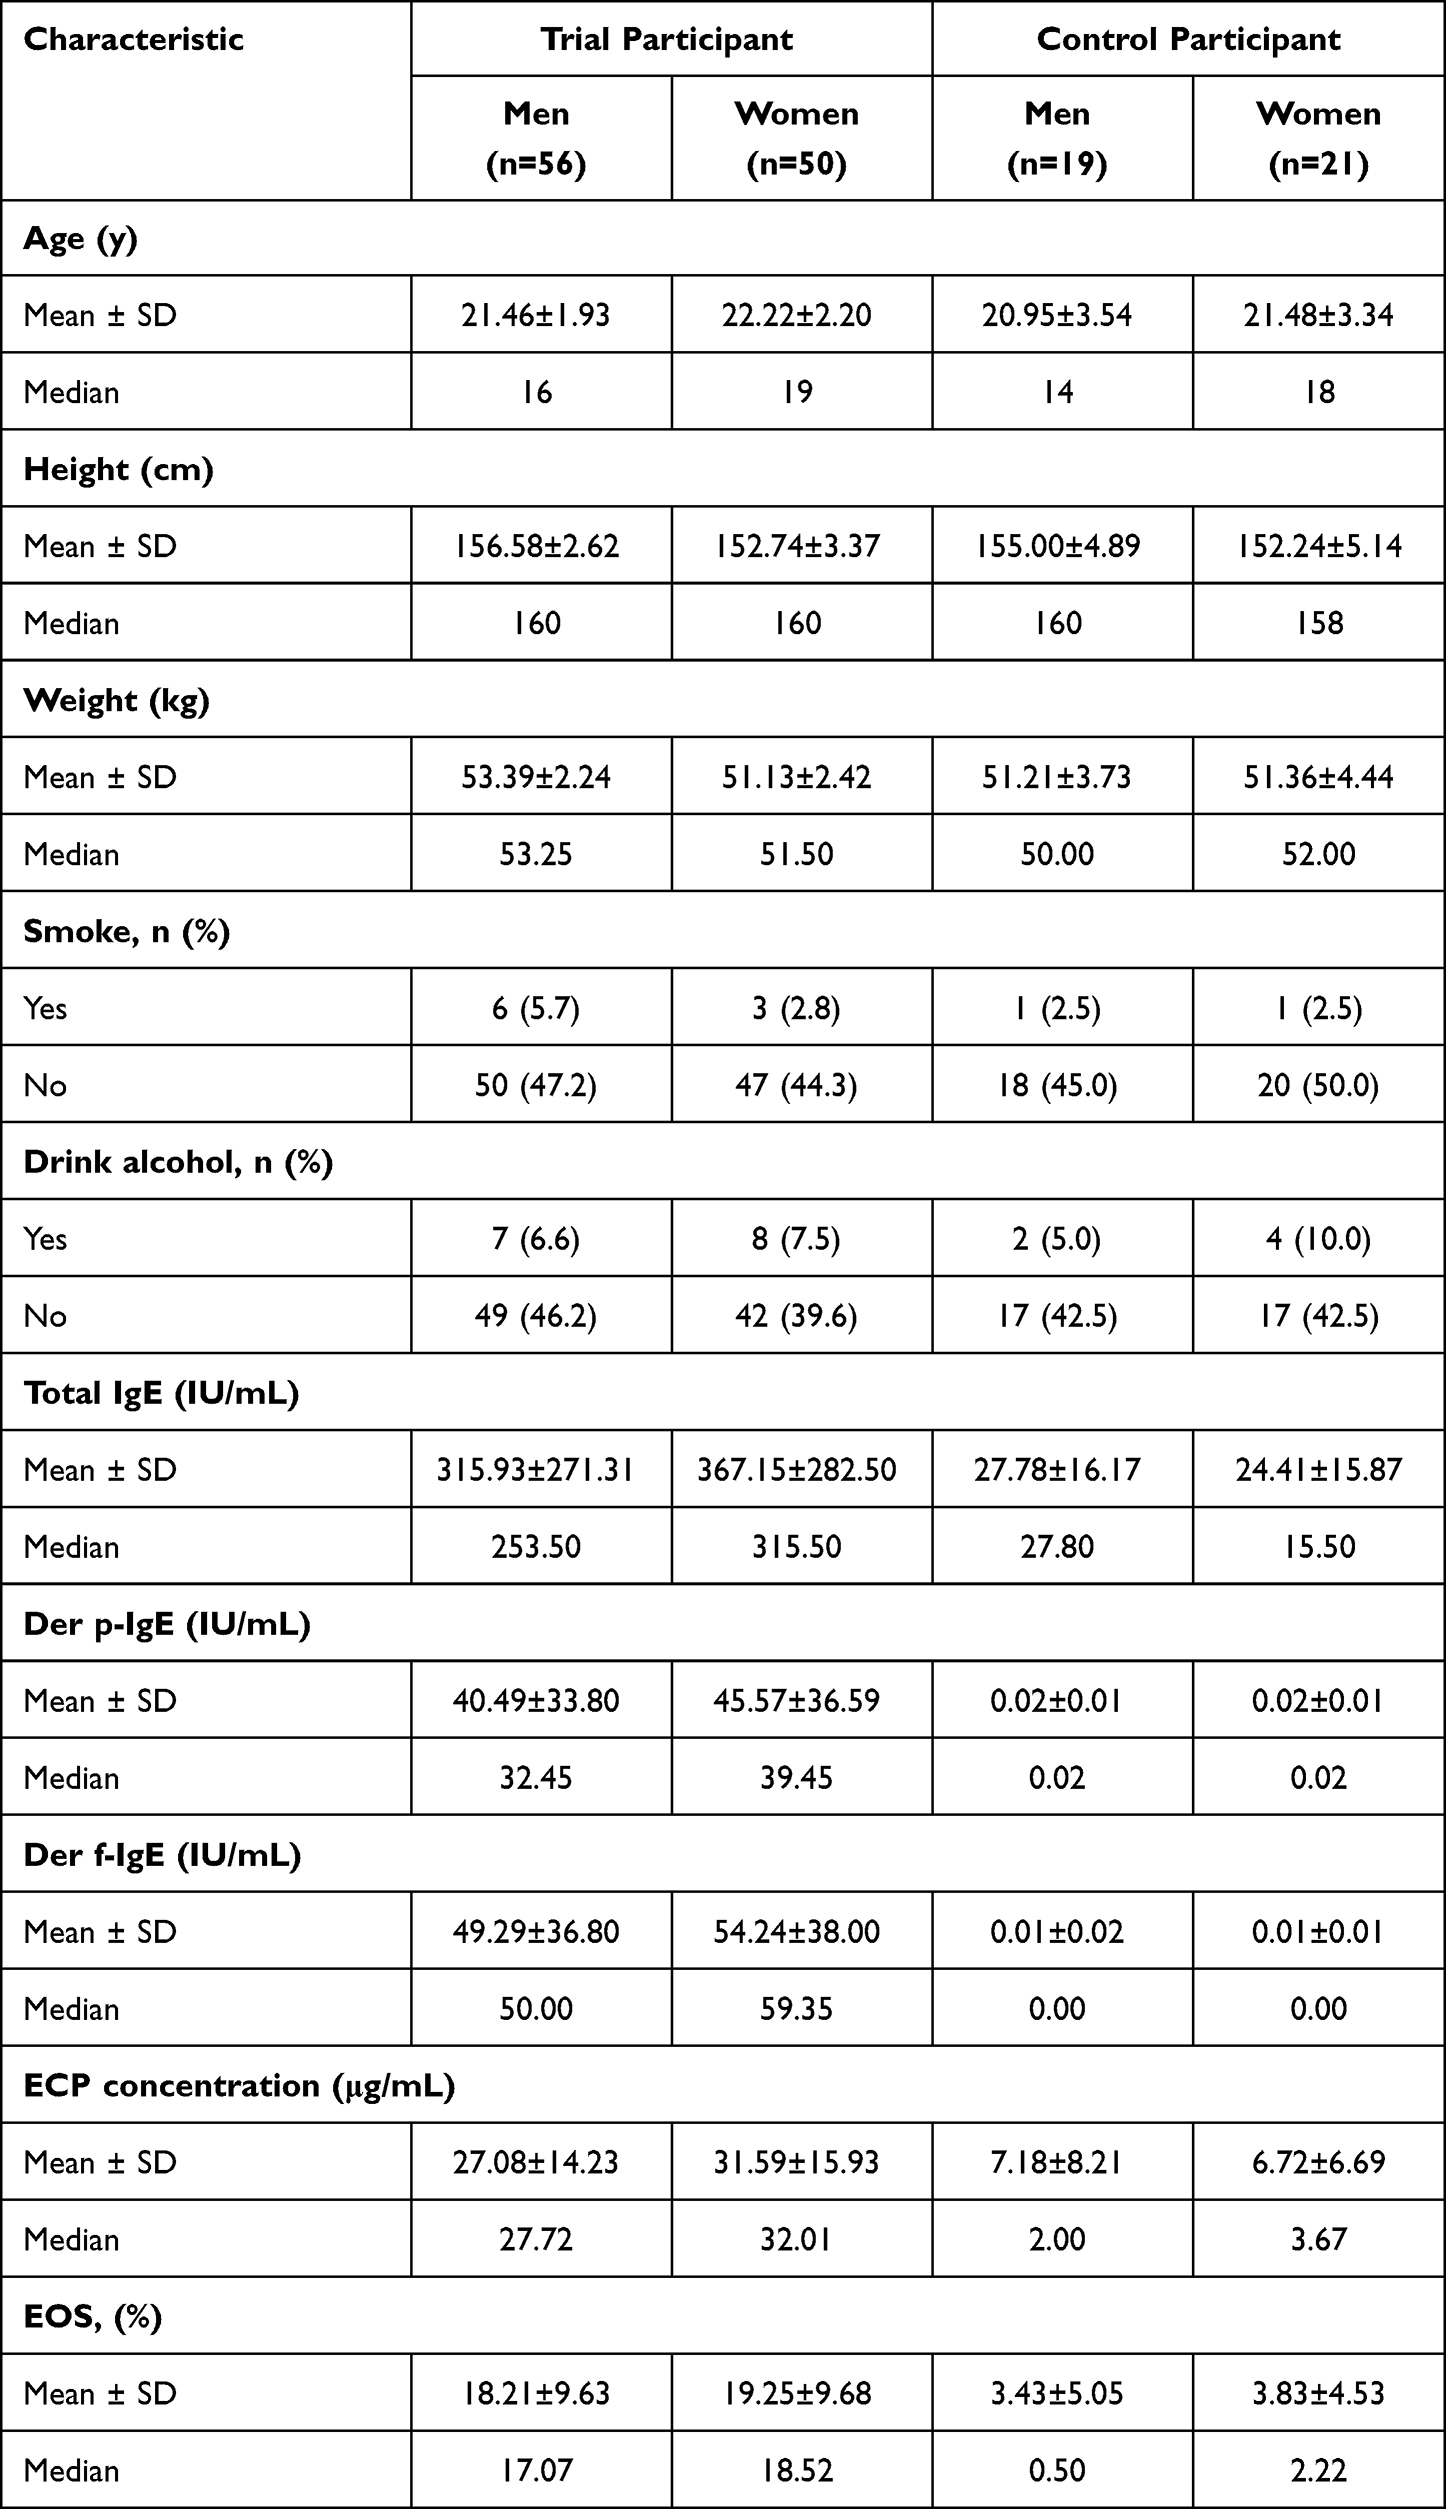 |
Table 1 Baseline Characteristics by Gender |
ECP-MPO Test Paper results Reflect ECP Content in Nasal Secretions Pre- and Post-Treatment
Figure 3B shows the comparison of the results of ECP-MPO test strip before and after drug treatment in the experimental group. The colour grade of the test paper decreased with a decrease in the eosinophil count (Figure 3C), with a high positive correlation between the two results (Figure 3D). The correlation coefficient between the test paper colour grades and the ECP content in the nasal secretion before treatment (r1) was 0.801, and that after treatment (r2) was 0.789, which indicated strong positive correlations (Figure 3E). The receiver operating curves (ROC) of ECP concentration and EOS% in nasal secretions were used to evaluate the diagnostic performance of positive test strips. The area under the curve (AUC) of the two were 0.9283 and 0.9243, respectively; when the test strips was positive, the cutoff values of the two were 18.13ug/mL, 10.08% (Figure 3F). Figure 3G shows that there are statistical differences in test paper colour grades between all patients before and after treatment and control subjects (*P<0.05; **P<0.01). Using paired t-test, it was found that the color grading level of ECP test paper in the patient group before treatment was significantly greater than that after treatment (P<0.01) (Figure 3H). In addition, the total IgE, Der p-IgE and Der f-IgE concentrations, ECP concentrations, EOS%, and the symptoms scores were significantly higher in the experimental group than in the control group (*P<0.05; **P<0.01) (Figure 3I).
Consistency Between the Test Paper Diagnosis and the Traditional Diagnosis
Figure 4A shows the diagnostic performance of the ECP-MPO test paper for AR. For Der p-IgE and Der f-IgE, the sensitivity of the test paper was 94% (95% CI 86.88–97.53%) and 93.94% (95% CI 86.76–97.51%), respectively. The specificity was 86.96% (95% CI 73.05–94.58%) and 85.11% (95% CI 71.08–93.31%), respectively. For SPT, the sensitivity and specificity of the test paper was 95.92% (95% CI 89.28–98.68%), and 87.50% (95% CI 74.06–94.81%), respectively. There was a positive correlation between a positive test paper result and a positive SPT result, a positive Der p-IgE and Der f-IgE result (Kappa values, 0.843, 0.810, 0.795, respectively). However, a positive total IgE result was not consistent with a positive test paper result (Kappa value, 0.534) (Figure 4B). For this reason, we further verified the effectiveness of the use of ECP concentration in nasal secretions for diagnosing AR. An analysis of the correlation between nasal secretion ECP concentration and total IgE, sIgE of Der p and Der f, and symptom scores (TNSS, RQLQ, and VAS) showed that the ECP concentration did not correlate strongly with total IgE (r=0.525), but correlated with Der p (r=0.607) and Der f (r=0.609) (Figure 4C). The post-treatment TNSS, RQLQ and VAS scores of subjects showed a downward trend compared with the pre-treatment values; however, there was a positive correlation between these scores and the concentration of nasal secretion ECP in both pre- and post-treatment conditions (Figure 4D).
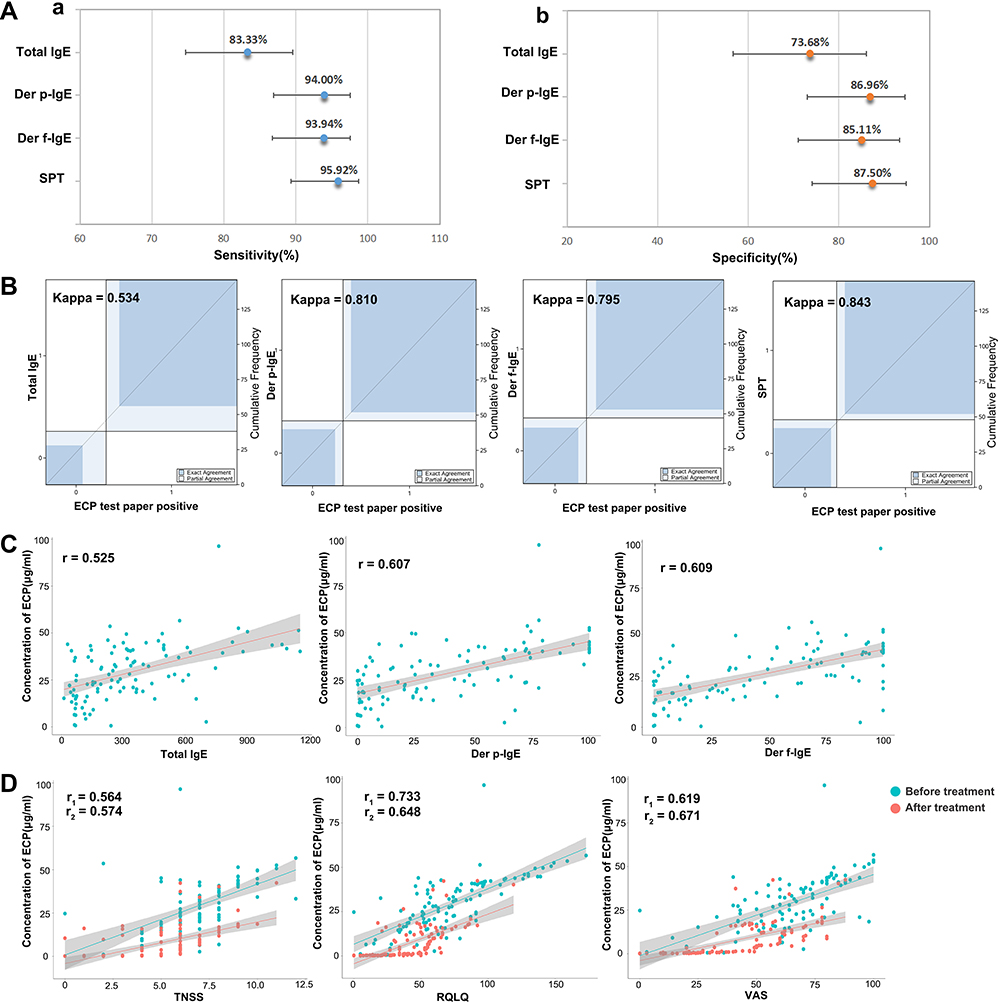 |
Figure 4 (A) a. Sensitivity of ECP-MPO test paper diagnosis; b. Specificity of ECP-MPO test paper diagnosis. (B) Kappa test of positive test paper results and total IgE, Der p-IgE, Der f-IgE and SPT. (C) correlation between the concentration of ECP in nasal secretions and the concentration of total IgE, and IgE pertaining to Der p and Der f. (D) Correlation between ECP concentrations in nasal secretions and TNSS, RQLQ, and VAS scores before and after treatment; r1, correlation coefficient before treatment, r2, correlation coefficient after treatment. |
The ECP-MPO Test Paper Colour Grade Reflects the Severity of AR Symptoms
Figure 5 shows that as the colour grade of the test paper increased, the total IgE level, Der p-IgE level, Der f-IgE level, TNSS, RQLQ, and VAS scores increased by different degrees. The colour grade of the test paper correlated positively with the Der p-IgE, Der f-IgE level. The colour grade of the test paper correlated positively with the TNSS, RQLQ, and VAS scores before drug treatment; the correlation coefficient decreased slightly after drug treatment, but the direction of correlation did not change. The colour grade of the test paper showed a weak correlation with the total IgE level.
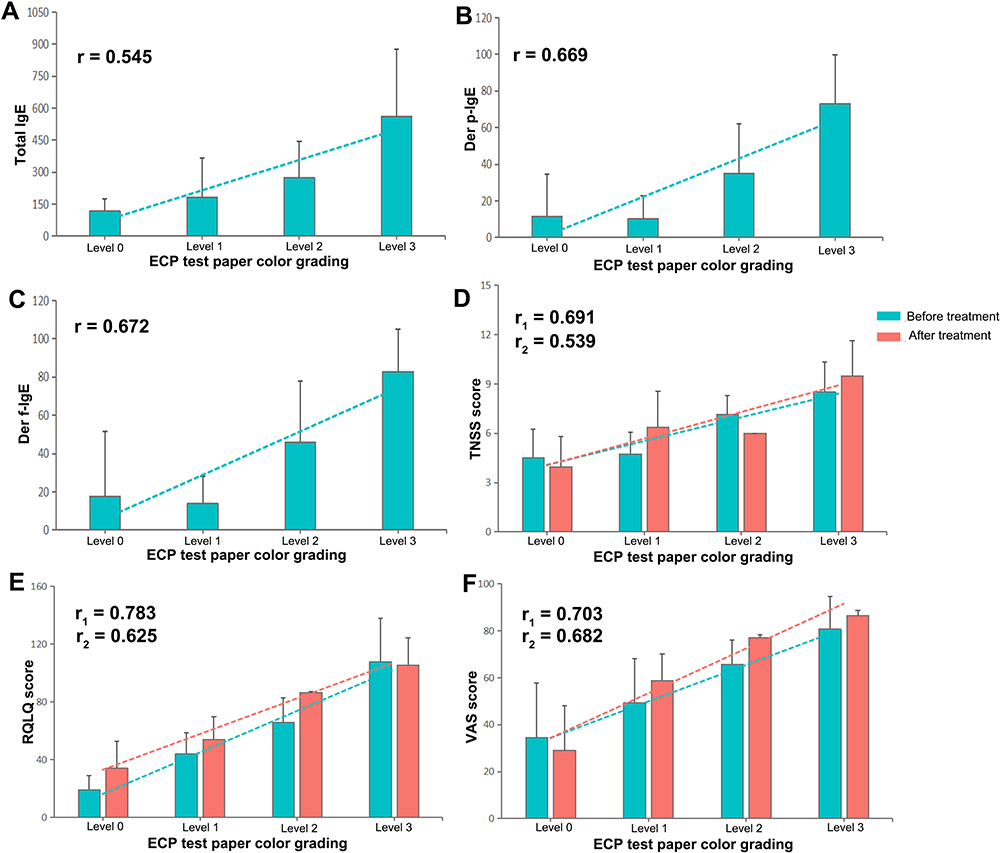 |
Figure 5 (A–C) Correlation between the colour grade of the eosinophil cationic protein-myeloperoxidase (ECP-MPO) test paper and total IgE, Der p-IgE and Der f-IgE levels. (D–F) Correlation between the colour grading of the ECP-MPO test paper before and after treatment and the total nasal symptom score (TNSS), quality of life questionnaire (RQLQ), and visual analogue scale (VAS) scores. r1, correlation coefficient before treatment; r2, correlation coefficient after treatment. |
Correlation Between the Test Paper Results and the Levels of Characteristic Inflammatory Factors
The experimental group showed higher pre-treatment IL-4, IL-6, IL-10, IL-17A, CCL11, CCL17, CCL22, and CCL26 levels than the control group, and lower pre-treatment IL-2, IFN-γ, and TNF-α levels. Compared with the level before drug treatment, the patients’ serum IL-4, IL-6, IL-10, IFN-γ and IL-17A levels decreased, and IL-2 and TNF-α levels increased after drug treatment (Figure 6A). Among the above, IL-4, IL-6, and IL-10 levels correlated positively and IFN-γ levels correlated negatively with the ECP-MPO test paper colour grade. There was no significant correlation between the levels of IL-2, TNF- α, and IL-17A and the colour grade (Figure 6B). After drug treatment, there was a downward trend in the levels of CCL17, CCL22, CCL11, and CCL26 (Figure 6C); all the chemokines showed different degrees of positive correlation with the colour grade of the test paper (CCL26 showed the best correlation) (Figure 6D).
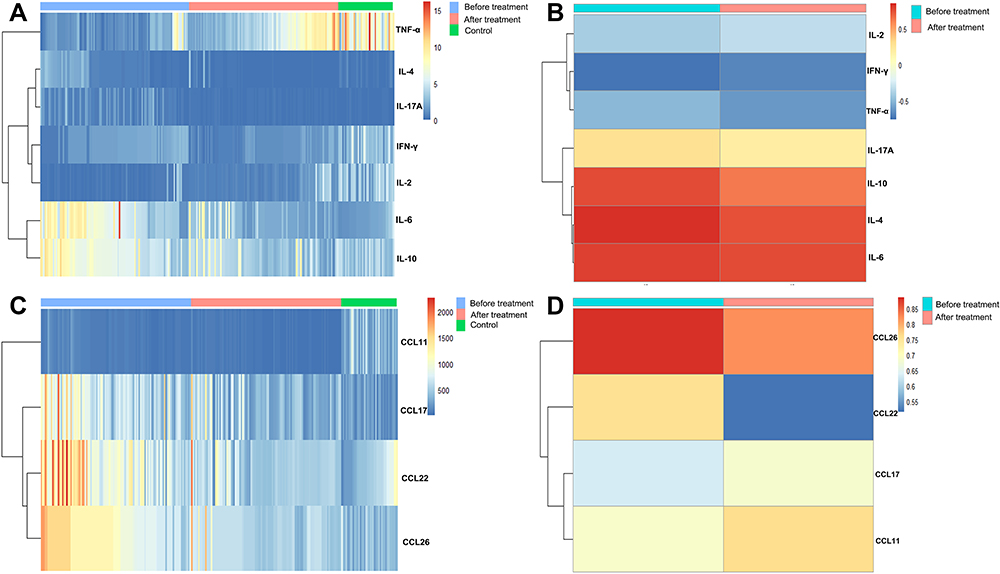 |
Figure 6 (A) Serum interleukin (IL)-6, IL-10, tumour necrosis factor (TNF)-α, IL-4, IL-17A, interferon (IFN)-γ and IL-2 concentrations (pg/mL) of control participants and participants with allergic rhinitis (AR) before and after treatment. (B) The correlation coefficient between the colour grading of the eosinophil cationic protein-myeloperoxidase (ECP-MPO) test paper and the concentration of serum IL-2, IFN-γ, TNF-α, IL-17A, IL-10, IL-4, and IL-6. (C) Serum C-C motif chemokine ligand (CCL) 11 (pg/mL), CCL17 (×10−1 pg/mL), CCL22 (pg/mL), and CCL26 (×10−2 pg/mL) levels of control participants and participants with AR before and after treatment. (D) The correlation between the colour grading of the ECP-MPO test paper and the serum concentrations of CCL26, CCL22, CCL17, and CCL11. |
Discussion
Secreted ECP reflects the degree of eosinophil activation.5 ECP in the nasal mucosa helps monitor acute allergic inflammation21 and the efficacy of sublingual immunotherapy.6 However, at present, the methods used for the detection of nasal ECP are very limited. To the best of our knowledge, the ECP-MPO real-time test paper developed and evaluated in this study is the first and only method that can be used for the rapid detection of nasal ECP in the clinic. In this study, the effectiveness of the test paper in the diagnosis and assessment of symptoms and inflammation in 106 AR patients before and after treatment with cetirizine hydrochloride were evaluated. We found that the pre- and post-treatment results obtained by analysing nasal secretions with the ECP-MPO real-time test paper was consistent with those obtained by SPT, Der p-IgE and Der f-IgE result. The colour degree of the test paper closely reflected the severity of AR symptoms and correlated with several AR-related inflammatory factors and chemokines.
First, we verified the validity of the ECP-MPO test paper results. Previous studies found that the levels of activated and pathogenic eosinophils in the blood and nasal secretions were positively associated with ECP levels.2,22 In agreement with the above, we observed a strong positive correlation between the ECP concentration in nasal secretions and the test paper colour grade in this study; the strong correlation was maintained even after drug treatment. Similarly, the eosinophil count in the nasal secretion smears strongly correlated with the colour grade of the test paper before and after treatment. The AUC of the ECP concentration and eosinophil count were 0.9283 and 0.9243, respectively; When the test strip is positive, the cutoff values were 18.13ug/mL, 10.08%. These strong positive correlations indicate that the ECP-MPO test paper can reliably detect ECP in nasal secretions, and the colour grade of the test paper deepens with an increase in the local ECP concentration. In addition, We found that the total IgE, Der p-IgE, Der f-IgE, ECP concentration, EOS%, and nasal secretions symptom scores were higher in the experimental group than in the control group, which confirmed the effectiveness of AR diagnosis in the experimental group.
Further analysis showed that the sensitivity of test paper positive for serum Derp-IgE and Derf-IgE was 94% and 93.94%, respectively. The specificity of test paper positive for serum Derp-IgE and Derf-IgE was 86.96% and 85.11%, respectively. For SPT, the sensitivity and specificity of positive test paper were 95.92% and 87.50%, respectively. In the Kappa consistency test, we also found that the positive test paper results were consistent with the positive results of Derp-IgE, Derf-IgE and SPT. The results show that when the test strip is positive, it has a good diagnostic performance for patients with AR. Airway allergen exposure induces the production of some cytokines (GM-CSF, IL-3, IL-5) in allergic diseases. These cytokines can locally and systematically affect the maturation, activation and recruitment of eosinophils, and release ECP.23 In previous reports, the concentration of ECP in serum and nasal lavage fluid increased significantly in some patients with allergic rhinitis.24 Serum ECP levels are also used as a useful clinical indicator for evaluating the effectiveness of specific immunotherapy.25 These findings provide a good theoretical basis for the research and development of the test paper, as well as strong evidence for the accuracy of the test paper. In addition, Our SPT mainly detected the response of patients to Der p and Der f, and our results were consistent with previous studies that reported an increase in ECP concentration in rhinitis patients with dust mite allergy.2,26 Dust mite faecal particles are presented as antigens, which leads to the differentiation of Th0 cells into the Th2 phenotype. This in turn induces AR and promotes the production and aggregation of eosinophils.27 Our results show that the ECP-MPO test paper can be used for diagnosing dust mite AR. We found that the positive test paper results were not consistent with total IgE positivity. Indeed, it has been reported that the correlation between total IgE and eosinophils is weak.28,29 The possible reason is related to the diversity of clinical samples. Epidemiological studies have shown that the total IgE level decreases with age, and correlates significantly with occupation type, obesity, smoking status, and other factors.30 The total IgE level is also affected by the ecological imbalance of the microflora in the inferior turbinate mucosa, especially Staphylococcus aureus and Propionibacterium acne.31
The TNSS, RQLQ, and VAS are the most commonly used indicators to evaluate symptoms in clinical trials and clinical practice.32 Previous studies have shown that the eosinophil count is related to symptoms such as nasal hyperresponsiveness and nasal congestion in AR.33,34 Moreover, another study has shown that the TNSS score was significantly associated with eosinophil count in the blood and nose of patients with AR.2 In a multiple regression analysis, eosinophils were independent predictors of AR and correlated with clinical severity.35 The RQLQ score is usually used in conjunction with the eosinophil count to evaluate the treatment effect and prognosis in AR patients.32,36 After antihistamine treatment, it has been reported that the RQLQ scores and eosinophil counts decreased significantly.36 Additionally, the RQLQ score was positively associated with the speed and degree of symptom development.37 In agreement with these studies, we found that the colour grade of the ECP-MPO test paper was significantly associated with and increased with the increase of TNSS, RQLQ, and VAS scores. This indicates that the test paper results reflect the severity of clinical symptoms of AR before and after treatment.
In this study, AR patients showed higher Th2 immune responses than the control group. After treatment with cetirizine hydrochloride, the imbalance in Th1/Th2 responses was reversed; the downregulation of IFN-γ may be related to the specific inhibition of H1R receptor in Th1 cells by cetirizine.39 Further, the pre- and post-treatment ECP-MPO test paper results correlated positively with Th2 cytokines and negatively with IFN-γ, indicating that these results were able to reflect the unbalanced T cell response in AR patients (Figure 7). It has been reported that during the pathogenesis of AR, ECP, eosinophil chemokines, and Th2-related cytokines increased synchronously in the late reaction phase and peaked at 8 hours.40 CCL11 and CCL26 are the main chemokines responsible for the local recruitment of eosinophils, and the effect of CCL26 is the most obvious.41 CCL17 and CCL22 play a role in the recruitment of Th2 cells.38 Th2 cells can further promote the local recruitment of eosinophils by secreting cytokines.42 Similarly, we found that the ECP-MPO test paper colour grade correlated positively with the Th2 cell chemokines CCL17 and CCL22, and with the eosinophil chemokines CCL11 and CCL26. These correlations imply that the test paper results can effectively indicate the relative levels of some characteristic inflammatory factors and chemokines in patients with AR by reflecting the concentration of local ECP in nasal secretions. The test paper can thus be used for guiding the diagnosis and treatment of AR as well as for evaluating patient prognosis.
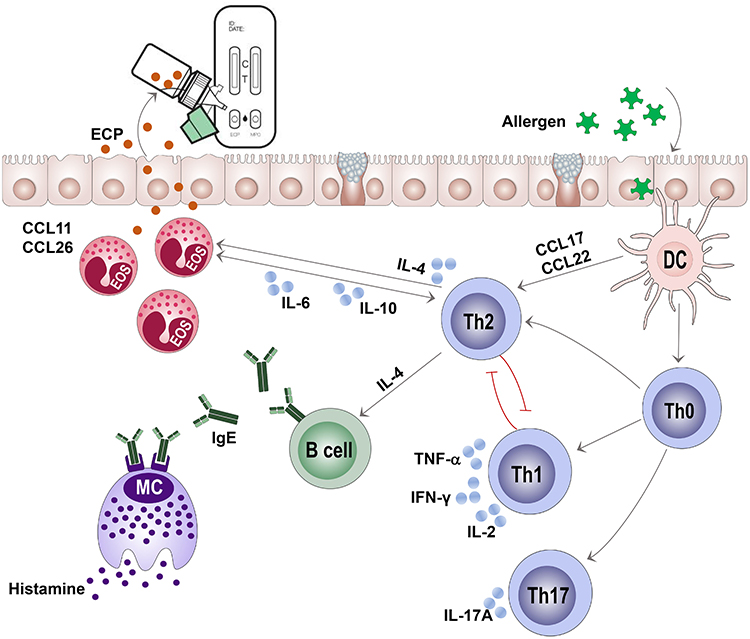 |
Figure 7 Schematic diagram of the association between eosinophil cationic protein (ECP) and cytokines and chemokine. |
There are some limitations to this study: first, the sample size was small, and the subjects were recruited from a single region. Therefore, the results may reflect regional characteristics, reducing the generalizability of our findings. A multicenter study is under way to expand the sample size. Second, Dermatophagoides pteronyssiodes and Dermatophagoides farinae were the primary sources of allergens in this study. Thus, the patient population was not representative of all AR patients. AR caused by other allergens should also be included in future studies. Third, MPO-positive patients (co-infection) were excluded from this study, and in later studies, we will fully discuss other types of rhinitis and MPO-positive patients with AR.
Conclusion
This study developed and evaluated the ECP-MPO instant detection test paper for nasal secretions, and demonstrated the effectiveness of this method for the diagnosis of AR. The colour grade results from the test paper effectively indicated the severity of clinical symptoms and the serum levels of several inflammatory factors and chemokines before and after drug treatment in patients with AR. The test paper is user-friendly, non-invasive and allows for rapid diagnosis. The development and subsequent clinical application of the ECP-MPO test paper will provide a new method for the diagnosis of AR and to assess its severity.
Data Sharing Statement
Any scientist can get access to deidentified database via an e-mail to corresponding author (Ze-Zhang Tao; E-mail: [email protected]) upon a reasonable request.
Ethics and Consent Statement
The research program was approved by the Ethics Committee of Renmin Hospital of Wuhan University (WDRY2021-K052) and registered in Chinese Clinical Trial Registry (NO. ChiCTR2200057205).
Author Contributions
All authors contributed to data analysis or interpretation, drafting or revising the article, have agreed on the journal to which the article will be submitted, gave final approval of the version to be published, and agree to be accountable for all aspects of the work.
Funding
This work was funded by the National Natural Science Foundation of China (Reference Numbers 81870705 and 81970860) and Wuhan Dabai Xiaobai Technology Co., Ltd., China (2021HX0027).
Disclosure
The authors report no conflicts of interest in this work.
References
1. Rondon C, Canto G, Blanca M. Local allergic rhinitis: a new entity, characterization and further studies. Curr Opin Allergy Clin Immunol. 2010;10(1):1–7. doi:10.1097/ACI.0b013e328334f5fb
2. Chen Y, Yang M, Deng J, Wang K, Shi J, Sun Y. Elevated levels of activated and pathogenic eosinophils characterize moderate-severe house dust mite allergic rhinitis. J Immunol Res. 2020;2020:8085615. doi:10.1155/2020/8085615
3. Pal I, Sinha BA, Halder I, Kumar S. Nasal smear eosinophils and allergic rhinitis. Ear Nose Throat J. 2017;96(10–11):E17–E22. doi:10.1177/0145561317096010-1105
4. Di Lorenzo G, Mansueto P, Pacor ML, et al. Clinical importance of eosinophil count in nasal fluid in patients with allergic and non-allergic rhinitis. Int J Immunopathol Pharmacol. 2009;22(4):1077–1087. doi:10.1177/039463200902200424
5. Munthe-Kaas MC, Gerritsen J, Carlsen KH, et al. Eosinophil cationic protein (ECP) polymorphisms and association with asthma, s-ECP levels and related phenotypes. Allergy. 2007;62(4):429–436. doi:10.1111/j.1398-9995.2007.01327.x
6. Bystrom J, Patel SY, Amin K, Bishop-Bailey D. Dissecting the role of eosinophil cationic protein in upper airway disease. Curr Opin Allergy Clin Immunol. 2012;12(1):18–23. doi:10.1097/ACI.0b013e32834eccaf
7. Linder A, Venge P, Deuschl H. Eosinophil cationic protein and myeloperoxidase in nasal secretion as markers of inflammation in allergic rhinitis. Allergy. 1987;42(8):583–590. doi:10.1111/j.1398-9995.1987.tb00388.x
8. Aratani Y. Myeloperoxidase: its role for host defense, inflammation, and neutrophil function. Arch Biochem Biophys. 2018;640:47–52. doi:10.1016/j.abb.2018.01.004
9. Kinhult J, Egesten A, Benson M, Uddman R, Cardell LO. Increased expression of surface activation markers on neutrophils following migration into the nasal lumen. Clin Exp Allergy. 2003;33(8):1141–1146. doi:10.1046/j.1365-2222.2003.01682.x
10. Subspecialty Group of Rhinology, Editorial Board of Chinese Journal of Otorhinolaryngology Head and Neck Surgery; Subspecialty Group of Rhinology, Society of Otorhinolaryngology Head and Neck Surgery, Chinese Medical Association. 中国变应性鼻炎诊断和治疗指南 (2022年, 修订版). [Chinese guideline for diagnosis and treatment of allergic rhinitis (2022, revision)]. Zhonghua Er Bi Yan Hou Tou Jing Wai Ke Za Zhi. 2022;57(2):106–129. Chinese. doi:10.3760/cma.j.cn115330-20211228-00828
11. Weinstein SF, Katial R, Jayawardena S, et al. Efficacy and safety of dupilumab in perennial allergic rhinitis and comorbid asthma. J Allergy Clin Immunol. 2018;142(1):171–177. doi:10.1016/j.jaci.2017.11.051
12. Suojalehto H, Vehmas T, Lindstrom I, et al. Nasal nitric oxide is dependent on sinus obstruction in allergic rhinitis. Laryngoscope. 2014;124(6):E213–E218. doi:10.1002/lary.24590
13. Manoharan A, Morrison AE, Lipworth BJ. Effects of the inverse alpha-agonist doxazosin in allergic rhinitis. Clin Exp Allergy. 2016;46(5):696–704. doi:10.1111/cea.12700
14. Colas C, Galera H, Anibarro B, et al. Disease severity impairs sleep quality in allergic rhinitis (The SOMNIAAR study). Clin Exp Allergy. 2012;42(7):1080–1087. doi:10.1111/j.1365-2222.2011.03935.x
15. Okamoto Y, Fujieda S, Okano M, Yoshida Y, Kakudo S, Masuyama K. House dust mite sublingual tablet is effective and safe in patients with allergic rhinitis. Allergy. 2017;72(3):435–443. doi:10.1111/all.12996
16. Holmberg K, Tonnel AB, Dreyfus I, et al. Desloratadine relieves nasal congestion and improves quality-of-life in persistent allergic rhinitis. Allergy. 2009;64(11):1663–1670. doi:10.1111/j.1398-9995.2009.02096.x
17. Hulshof L, Overbeek SA, Wyllie AL, et al. Exploring immune development in infants with moderate to severe atopic dermatitis. Front Immunol. 2018;9:630. doi:10.3389/fimmu.2018.00630
18. Weng J, Lai P, Qin L, et al. A novel generation 1928zT2 CAR T cells induce remission in extramedullary relapse of acute lymphoblastic leukemia. J Hematol Oncol. 2018;11(1):25. doi:10.1186/s13045-018-0572-x
19. Obuchowski NA, Zhou XH. Prospective studies of diagnostic test accuracy when disease prevalence is low. Biostatistics. 2002;3(4):477–492. doi:10.1093/biostatistics/3.4.477
20. Li J, Fine J. On sample size for sensitivity and specificity in prospective diagnostic accuracy studies. Stat Med. 2004;23(16):2537–2550. doi:10.1002/sim.1836
21. Marcucci F, Sensi LG, Migali E, Coniglio G. Eosinophil cationic protein and specific IgE in serum and nasal mucosa of patients with grass-pollen-allergic rhinitis and asthma. Allergy. 2001;56(3):231–236. doi:10.1034/j.1398-9995.2001.056003231.x
22. Li Y, Wu R, Tian Y, Bao T, Tian Z. The correlation of serum eosinophil cationic protein level with eosinophil count, and total IgE level in Korean adult allergic rhinitis patients. Asian Pac J Allergy Immunol. 2016;34(1):33–37. doi:10.12932/AP0746
23. Venge P. Serum measurements of eosinophil cationic protein (ECP) in bronchial asthma. Clin Exp Allergy. 1993;23(Suppl 2):15–22. doi:10.1111/j.1365-2222.1993.tb00372.x
24. Rasp G, Thomas PA, Bujia J. Eosinophil inflammation of the nasal mucosa in allergic and non-allergic rhinitis measured by eosinophil cationic protein levels in native nasal fluid and serum. Clin Exp Allergy. 1994;24(12):1151–1156. doi:10.1111/j.1365-2222.1994.tb03321.x
25. D’Amato G, Liccardi G, Russo M, Saggese M, D’Amato M. Measurement of serum levels of eosinophil cationic protein to monitor patients with seasonal respiratory allergy induced by Parietaria pollen (treated and untreated with specific immunotherapy). Allergy. 1996;51(4):245–250. doi:10.1111/j.1398-9995.1996.tb04600.x
26. Damps-Konstanska I, Gruchala-Niedoszytko M, Wilkowska A, et al. Eozynofilowe bialko kationowe(ECP) w surowicy chorych na caloroczne alergiczne zapalenie blony sluzowej nosa i atopowe zapalenie skory, uczulonych na roztocza kurzu domowego. [Serum eosinophil cationic protein (ECP) in patients with perennial rhinitis and atopic dermatitis, allergic to house dust mites]. Pol Merkur Lekarski. 2005;19(114):765–768. Polish.
27. Baraniuk JN. Pathogenesis of allergic rhinitis. J Allergy Clin Immunol. 1997;99(2):S763–S772. doi:10.1016/S0091-6749(97)70125-8
28. Altrichter S, Fok JS, Jiao Q, et al. Total IgE as a marker for chronic spontaneous urticaria. Allergy Asthma Immunol Res. 2021;13(2):206–218. doi:10.4168/aair.2021.13.2.206
29. Kolkhir P, Church MK, Altrichter S, et al. Eosinopenia, in chronic spontaneous urticaria, is associated with high disease activity, autoimmunity, and poor response to treatment. J Allergy Clin Immunol Pract. 2020;8(1):318–325. doi:10.1016/j.jaip.2019.08.025
30. Park HJ, Kim EJ, Yoon D, et al. Prevalence of self-reported allergic diseases and IgE levels: a 2010 KNHANES analysis. Allergy Asthma Immunol Res. 2017;9(4):329–339. doi:10.4168/aair.2017.9.4.329
31. Hyun DW, Min HJ, Kim MS, et al. Dysbiosis of inferior turbinate microbiota is associated with high total Ige levels in patients with allergic rhinitis. Infect Immun. 2018;86(4). doi:10.1128/IAI.00934-17
32. Huang R, Qin R, Hu Q, et al. Effect of dermatophagoides pteronyssinus immunotherapy on upper and lower airway eosinophilic inflammatory response to nasal allergen challenge. Allergy Asthma Immunol Res. 2020;12(5):844–858. doi:10.4168/aair.2020.12.5.844
33. de Graaf-in TVC, Garrelds IM, Koenders S, Gerth Van Wijk R. Relationship between nasal hyperreactivity, mediators and eosinophils in patients with perennial allergic rhinitis and controls. Clin Exp Allergy. 1996;26(8):903–908. doi:10.1111/j.1365-2222.1996.tb00625.x
34. Ciprandi G, Vizzaccaro A, Cirillo I, Tosca M, Massolo A, Passalacqua G. Nasal eosinophils display the best correlation with symptoms, pulmonary function and inflammation in allergic rhinitis. Int Arch Allergy Immunol. 2005;136(3):266–272. doi:10.1159/000083953
35. Chen ST, Sun HL, Lu KH, Lue KH, Chou MC. Correlation of immunoglobulin E, eosinophil cationic protein, and eosinophil count with the severity of childhood perennial allergic rhinitis. J Microbiol Immunol Infect. 2006;39(3):212–218.
36. Bautista AP, Eisenlohr CP, Lanz MJ. Nasal nitric oxide and nasal eosinophils decrease with levocetirizine in subjects with perennial allergic rhinitis. Am J Rhinol Allergy. 2011;25(6):383–387. doi:10.2500/ajra.2011.25.3668
37. Ellis AK, Ratz JD, Day AG, Day JH. Factors that affect the allergic rhinitis response to ragweed allergen exposure. Ann Allergy Asthma Immunol. 2010;104(4):293–298. doi:10.1016/j.anai.2010.01.012
38. Okamoto T, Iwata S, Ohnuma K, Dang NH, Morimoto C. Histamine H1-receptor antagonists with immunomodulating activities: potential use for modulating T helper type 1 (Th1)/Th2 cytokine imbalance and inflammatory responses in allergic diseases. Clin Exp Immunol. 2009;157(1):27–34. doi:10.1111/j.1365-2249.2009.03958.x
39. Jutel M, Blaser K, Akdis CA. Histamine in allergic inflammation and immune modulation. Int Arch Allergy Immunol. 2005;137(1):82–92. doi:10.1159/000085108
40. Drazdauskaite G, Layhadi JA, Shamji MH. Mechanisms of allergen immunotherapy in allergic rhinitis. Curr Allergy Asthma Rep. 2020;21(1):2. doi:10.1007/s11882-020-00977-7
41. Provost V, Larose MC, Langlois A, Rola-Pleszczynski M, Flamand N, Laviolette M. CCL26/eotaxin-3 is more effective to induce the migration of eosinophils of asthmatics than CCL11/eotaxin-1 and CCL24/eotaxin-2. J Leukoc Biol. 2013;94(2):213–222. doi:10.1189/jlb.0212074
42. Spencer LA, Weller PF. Eosinophils and Th2 immunity: contemporary insights. Immunol Cell Biol. 2010;88(3):250–256. doi:10.1038/icb.2009.115
 © 2022 The Author(s). This work is published and licensed by Dove Medical Press Limited. The full terms of this license are available at https://www.dovepress.com/terms.php and incorporate the Creative Commons Attribution - Non Commercial (unported, v3.0) License.
By accessing the work you hereby accept the Terms. Non-commercial uses of the work are permitted without any further permission from Dove Medical Press Limited, provided the work is properly attributed. For permission for commercial use of this work, please see paragraphs 4.2 and 5 of our Terms.
© 2022 The Author(s). This work is published and licensed by Dove Medical Press Limited. The full terms of this license are available at https://www.dovepress.com/terms.php and incorporate the Creative Commons Attribution - Non Commercial (unported, v3.0) License.
By accessing the work you hereby accept the Terms. Non-commercial uses of the work are permitted without any further permission from Dove Medical Press Limited, provided the work is properly attributed. For permission for commercial use of this work, please see paragraphs 4.2 and 5 of our Terms.