")
Back to Journals » OncoTargets and Therapy » Volume 12
Diagnostic significance of miR-210 as a potential tumor biomarker of human cancer detection: an updated pooled analysis of 30 articles
Authors Feng S, He A, Wang D, Kang B
Received 20 August 2018
Accepted for publication 26 November 2018
Published 9 January 2019 Volume 2019:12 Pages 479—493
DOI https://doi.org/10.2147/OTT.S184564
Checked for plagiarism Yes
Review by Single anonymous peer review
Peer reviewer comments 2
Editor who approved publication: Dr XuYu Yang
Song Feng,1,* Anbang He,2,* Deli Wang,1 Bin Kang1
1Department of Bone and Joint Surgery, Peking University Shenzhen Hospital, Peking University Shenzhen, Shenzhen 518038, Guangdong, China; 2Department of Urology, Peking University First Hospital, The Institute of Urology, Peking University National Urological Cancer Centre, Beijing 100034, China
*These authors contributed equally to this work
Abstract: A large number of studies have explored the diagnostic value of miR-210 as a potential diagnostic cancer biomarker to detect various cancers in patients. However, the results of its diagnostic accuracy and reliability in individual studies are still inconsistent. Therefore, we conducted this updated pooled analysis to derive a more reliable conclusion of the overall accuracy of miR-210 in cancer detection and diagnosis. A comprehensive literature search was performed using the PubMed, Cochrane Library, Web of Science, China National Knowledge Infrastructure, and Wanfang databases. The quality of all eligible studies was scored according to Quality Assessment of Diagnostic Accuracy Studies-2 guidelines. The bivariate mixed model was applied to pooled sensitivity, specificity, likelihood ratios, and diagnostic ORs. The summary receiver operator characteristic (SROC) curve and the hierarchical SROC models were used to check overall diagnostic performance. Thirty articles with 2,304 patients and 1,673 controls were included in this study. The pooled parameters calculated from all studies are as follows: sensitivity -0.74 (95% CI: 0.68–0.79), specificity -0.79 (95% CI: 0.74–0.83), positive likelihood ratio -3.57 (95% CI: 2.85–4.47), negative likelihood ratio -0.32 (95% CI: 0.26–0.40), diagnostic OR -10.98 (95% CI: 7.55–15.98), SROC -0.84 (95% CI: 0.80–0.87). All of these results revealed that miR-210 had relatively moderate accuracy in distinguishing patients with various cancers from all other individuals. However, well-designed prospective studies with large sample sizes using different groups of the population are urgently warranted to confirm our findings.
Keywords: microRNA-210, cancer, biomarker, diagnosis, meta-analysis, ROC
Introduction
Cancer is a major public health problem all over the world because of its increasing incidence and mortality in recent years.1 According to Cancer Statistics, it was estimated that in 2017, 1,688,780 new cases of cancer and 600,920 cancer deaths were projected to occur in the US.1 In China, an estimated 4,292,000 new cases of cancer and 2,814,000 cancer deaths occurred in 2015.2 Lung, stomach, liver, and esophageal cancers were the most commonly diagnosed and were recognized as the foremost reasons of cancer death.3 Up to now, the gold standard for detecting and diagnosing cancers has been pathological biopsy, which has several limitations, including its invasive and unpleasant nature and the risk of cancer metastasis.3 Several blood-based clinical biomarkers are useful in the early detection and diagnosis of cancer, including prostate specific antigen, carcinoembryonic antigen, carbohydrate antigen 15-3, and alpha-fetoprotein.4–7 However, their low specificity and sensitivity limit their clinical usage. Therefore, finding an effective tumor-specific biomarker for early detection and diagnosis of cancer is becoming urgent and vital.
miRNAs, a class of small, non-coding, endogenous, single-stranded RNAs of a length of 22 nucleotides, function as potential oncogenes or tumor suppressor genes and play vital regulatory roles in tumorigenesis and tumor progression.8,9 Accumulating evidence has demonstrated that blood-based miRNAs could serve as novel and noninvasive biomarkers for detecting and diagnosing patients with various cancers.10,11 miR-210, located on chromosome 11p15.5, contributes to the development of several cancers, including bladder cancer (BLCA), renal cell carcinoma (RCC), lung cancer (LC), and pancreatic cancer (PAAD).12 A number of studies have explored the possible clinical usage of miR-210 in detecting and diagnosing cancers. Due to limited sample sizes and variation in study design, the overall result is inconsistent and inconclusive. Although two previous meta-analyses about the diagnostic significance of miR-210 in cancer detection have already been published several years ago, there are some defects in these studies.13,14 First, the results of both meta-analyses may lack statistical power due to the limited number of eligible studies enrolled. Recently, a large number of new studies have been conducted to explore the accuracy of miR-210 in the detection and diagnosis of cancer. Second, one of the two meta-analyses explored the accuracy of miRNA-210 only in LC detection.14 To avoid the previously mentioned limitations, we conducted this pooled analysis to derive a more reliable conclusion of the overall accuracy of miR-210 in the detection and diagnosis of cancer.
Materials and methods
Identification of miR-210 associated with various cancers
For identification of miR-210 expression in various cancers, we used SPSS-23 and GraphPad Prism 6 based on transcriptome profiling of TCGA with information of clinicopathological characteristics downloaded from UCSC Xena (http://xena.ucsc.edu/). All data from UCSC Xena were analyzed using the Student’s t-test and the non-parametric test. The results are expressed as mean ± SD and P-values of less than 0.05 are considered as statistically significant.
Search strategy
The electronic databases PubMed, Cochrane Library, Web of Science, China National Knowledge Infrastructure (CNKI), and Wanfang were searched to identify relevant papers about miR-210 and cancer published by October 20, 2017. The search terms were as follows: (“diagnosis” OR “sensitivity” OR “specificity” OR “ROC”) and (“microRNA-210” OR “miRNA-210” OR “miR-210” OR “miR-210” OR “hsa-mir-210”) and (“cancers” OR “carcinomas” OR “neoplasms”). Two reviewers (Anbang He and Song Feng) independently checked the abstract after the articles were found and read the full text if necessary to evaluate the quality of the articles. Conflicts of opinion between the two reviewers regarding the articles were resolved by other reviewers.
Inclusion and exclusion criteria
The inclusion criteria included: 1) the diagnostic value of miR-210 in detecting cancer; 2) a case control group designed with benign tumors; and 3) sufficient data that could be extracted or calculated from the article to obtain diagnostic parameters. The exclusion criteria were as follows: 1) letters, reviews or meta-analyses; 2) not related to either miR-210 or cancer or diagnostic value; 3) insufficient data that could not be extracted or calculated from the article to obtain diagnostic parameters.
Data extraction and quality assessment
The necessary information from the eligible studies was extracted by two investigators independently. The data extracted from eligible studies were listed as follows: 1) first author, 2) year of publication, 3) country, 4) ethnicity, 5) cancer type, 6) normalizer, 7) sample type, 8) test method, 9) the value of the cutoff, 10) number of cases and controls, 11) the diagnostic parameters including true positive, false positive, false negative, and true negative. Moreover, information missing from the original articles was obtained by contacting the relevant corresponding author. Study quality was assessed according to Quality Assessment of Diagnostic Accuracy Studies-2 (QUADAS-2) guidelines.15 The QUADAS-2 list was used on each article, with each answer being either “yes(Y),” “no(N)” or “unclear(U).”
Statistical analysis
All the statistical analyses were performed by using Stata (StataCorp LP, College Station, TX, USA, version 13.0). The bivariate meta-analysis model was applied to our analysis to calculate pooled sensitivity, specificity, positive likelihood ratio (PLR), negative likelihood ratio (NLR), and diagnostic OR (DOR).16 We also established a summary receiver operator characteristic (SROC) curve and calculated the AUCs and 95% CI. These data were confirmed by a hierarchical SROC (HSROC) model.17 Spearman correlation coefficients and ROC plane analyses were conducted to evaluate the heterogeneity of the threshold effect.18 Heterogeneity of non-threshold effects was assessed using Cochran-Q and Inconsistency index (I2) tests. A P-value less than 0.10 for the Q test or an I2 value higher than 50% indicated obvious heterogeneity between the studies. Meta-regression and subgroup analyses were applied to find out potential sources of heterogeneity. Fagan’s nomogram was used to certify relationships between prior-test probability, likelihood ratio, and post-test probability. Deeks’ funnel plot asymmetry test was used to assess potential publication bias.19
Result
miR-210 expression and clinicopathological characteristics
The clinicopathological characteristics of various cancers, including the expression of miR-210 (3 p and 5 p), overall survival, and relapse-free survival (RFS) were analyzed by using data from the UCSC Xena website. All results are shown in Table 1. As shown in Figure 1, the expression of both miR-210-3p and miR-210-5p were up-regulated in BLCA, breast cancer (BRCA), kidney clear cell carcinoma (KIRC), kidney papillary cell carcinoma (KIRP), stomach cancer (STAD), and lung squamous cell carcinoma (LUSC) (Figure 1). Up-regulated miR-210-3p expression in KIRC was positively correlated with shorter RFS (Table 1).
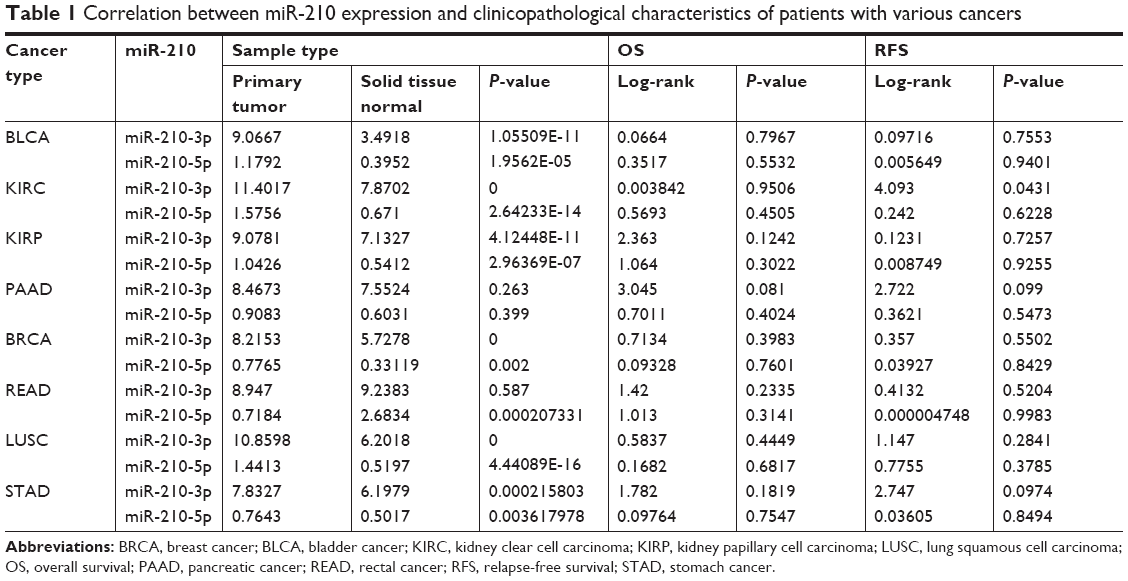 | Table 1 Correlation between miR-210 expression and clinicopathological characteristics of patients with various cancers |
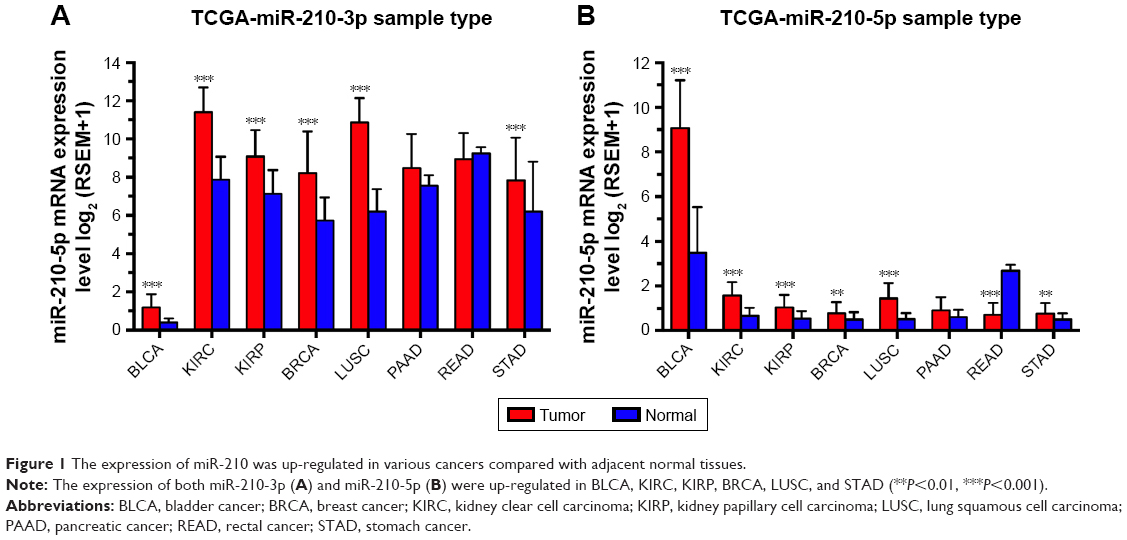 | Figure 1 The expression of miR-210 was up-regulated in various cancers compared with adjacent normal tissues. |
Literature search
Three hundred and thirty-three potentially relevant articles were found using the PubMed, Cochrane Library, Web of Science, CNKI, and Wanfang databases. The abstracts of all of these studies and the full-text, if necessary, were checked by two reviewers; after duplicates, irrelevant articles, reviews or meta-analyses were excluded, 30 articles remained and were included in our meta-analysis as shown in Figure 2.
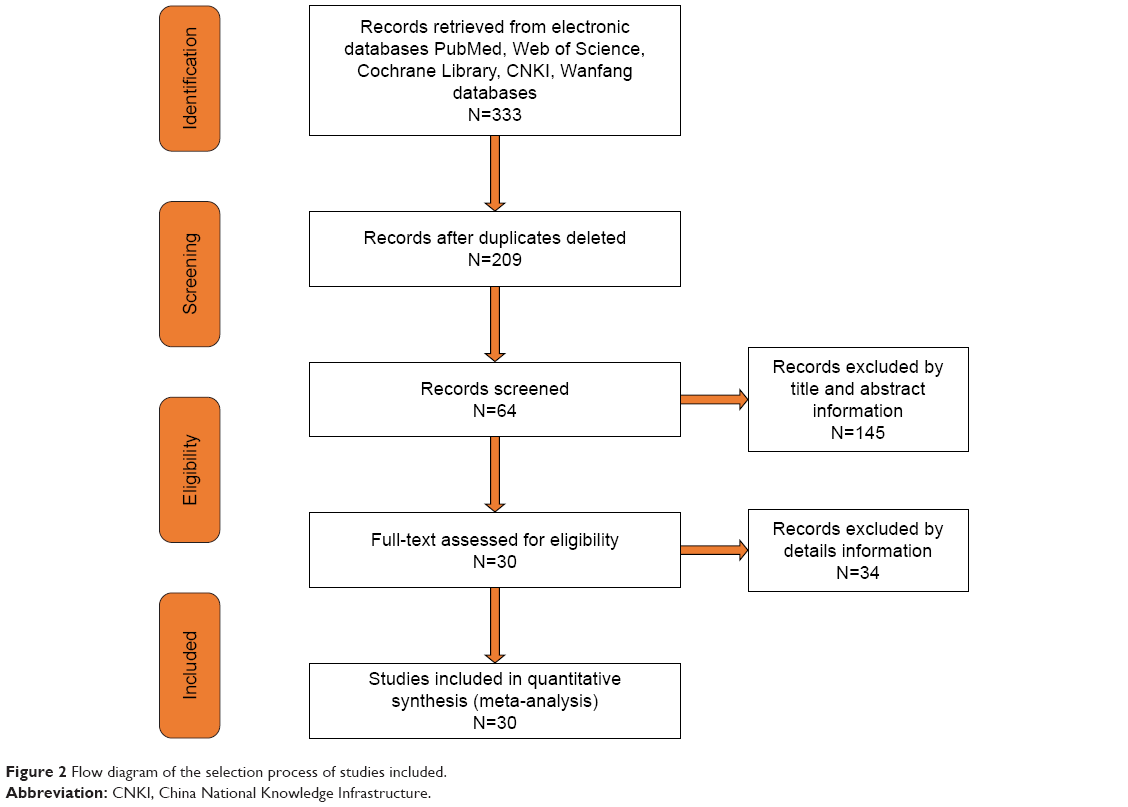 | Figure 2 Flow diagram of the selection process of studies included. |
Data characteristics and quality assessment
The necessary information from the 30 articles that were included, as shown in Table 2, was extracted and included the following: 1) first author; 2) year of publication: ranged from 2009–2017; 3) country: one from Egypt, one from France, one from Germany, two from Japan, the rest of the studies from China; 4) ethnicity: 17 studies were Asian, eight studies were Caucasian/African, three studies were Caucasian, one study was African; 5) cancer type: included non-small-cell lung cancer: six studies, LC: four studies, BLCA: two studies, RCC: five studies, PAAD: six studies, colorectal carcinoma (CRC): two studies, BRCA: one study, gastric cancer (GC): one study, glioma: one study, leukemia: one study; 6) sample type: serum: 20 studies, sputum: five studies, urine: two studies, pancreatic juice: one study, fecal matter: one study; 7) test method: qRT-PCR: 28 studies, microarray: one study. We evaluated all of the included studies according to the QUADAS-2 tool. The results are summarized in Table 3. We found that the overall quality of the studies included was relatively moderate.
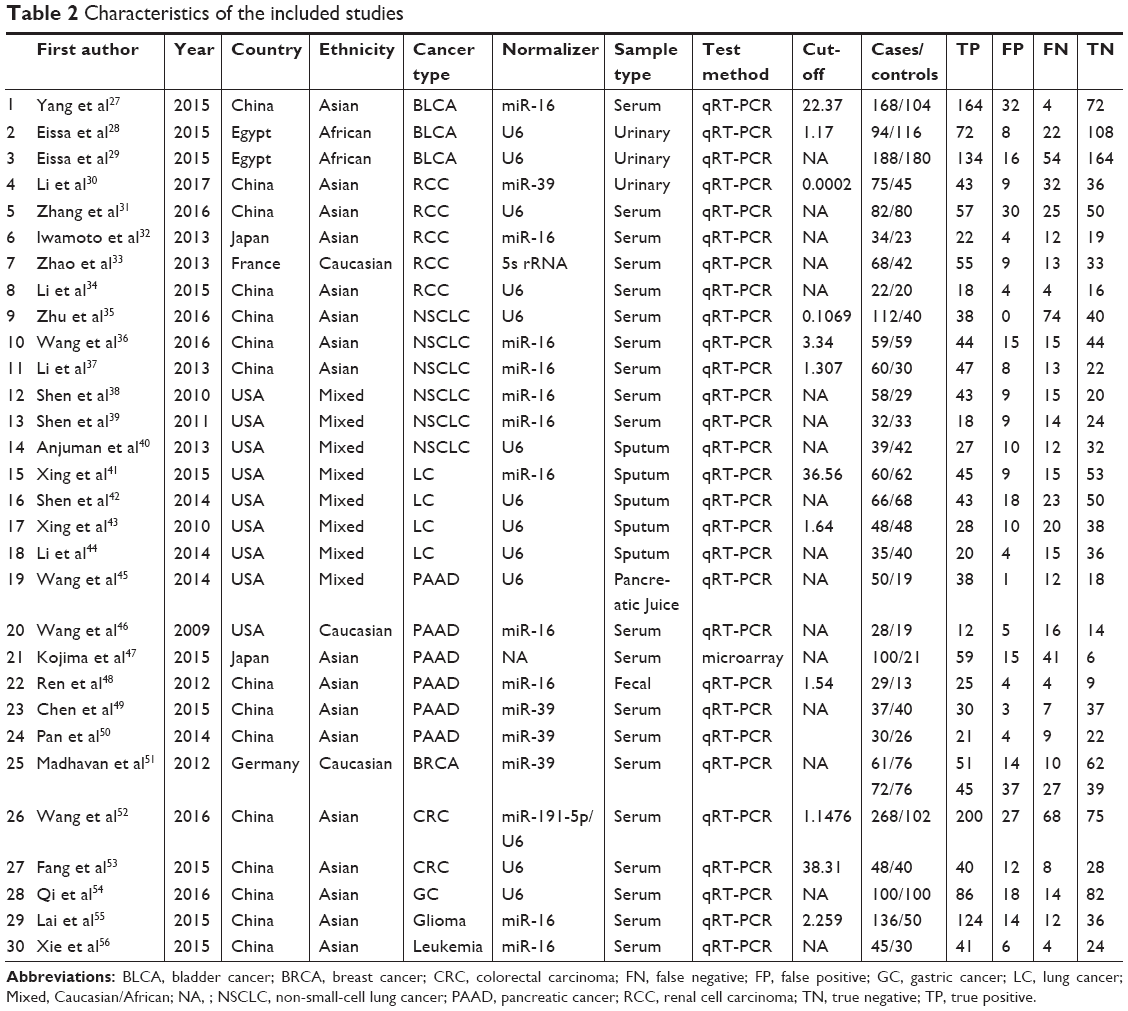 | Table 2 Characteristics of the included studies |
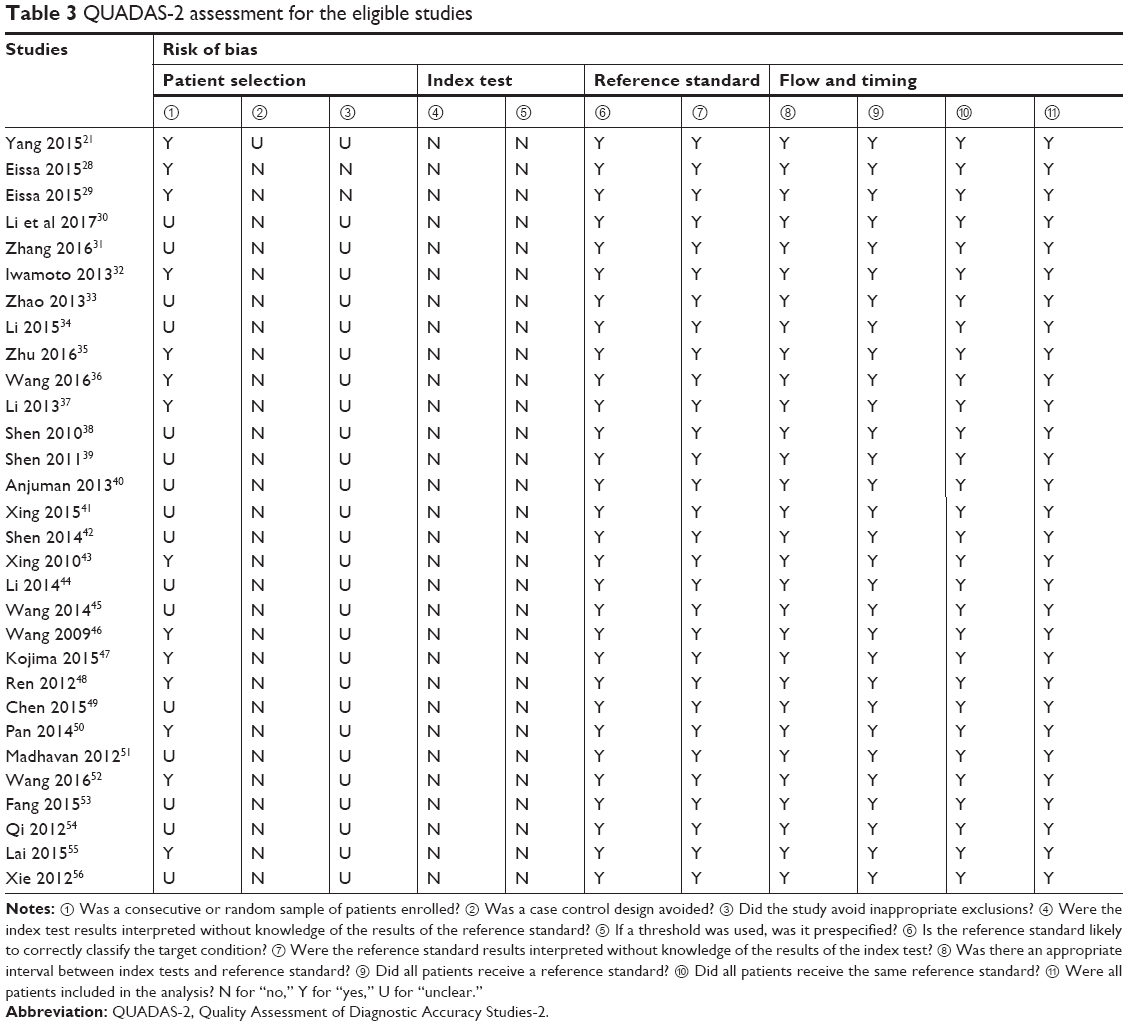 | Table 3 QUADAS-2 assessment for the eligible studies |
Diagnostic accuracy of miR-210 for cancers
The pooled sensitivity and specificity of the studies overall were 0.74 (95% CI: 0.68–0.79) and 0.79 (95% CI: 0.74–0.83), respectively (Figure 3). Considering that the I2 values for sensitivity and specificity were 88.07% (95% CI: 84.69–91.44) and 79.44% (95% CI: 72.67–86.22), respectively, this suggests significant heterogeneity in sensitivity and specificity. The pooled PLR and NLR were 3.57 (95% CI: 2.85–4.47) and 0.32 (95% CI: 0.26–0.40), respectively (Figure 4). The DOR was 10.98 (95% CI: 7.55–15.98) (Figure 5). The area under the SROC curve was 0.84 (95% CI: 0.80–0.87) (Figure 6). Figure 7 shows Fagan’s nomogram of likelihood ratios, which was used to determine the post-test probabilities that resulted from different pre-test probabilities. As shown in Figure 7, when miR-210 assays were tested for all individuals with a 50% pre-test probability of having cancer, a positive result would increase the post-test probability of having cancer to 78%, while a negative result would decrease the post-test probability to 25%. Thus, miR-210 can be applied as a noninvasive biomarker to supplement existing diagnostic methods. As shown in Figure 8, an HSROC curve was constructed. The hierarchical summary operating point estimate of sensitivity and specificity was 0.74 (95% CI: 0.68–0.79) and 0.79 (95% CI: 0.74–0.83), respectively. The estimated value of β was −0.087 (95% CI: −0.55–0.38), the value of z was −0.37, and the P-value was 0.75, implying that the SROC curve was not symmetrical. The value of Lambda was 2.41 (95% CI: 2.03–2.79). All of these results revealed that miR-210 had relatively moderate accuracy in distinguishing cancer patients from all other individuals.
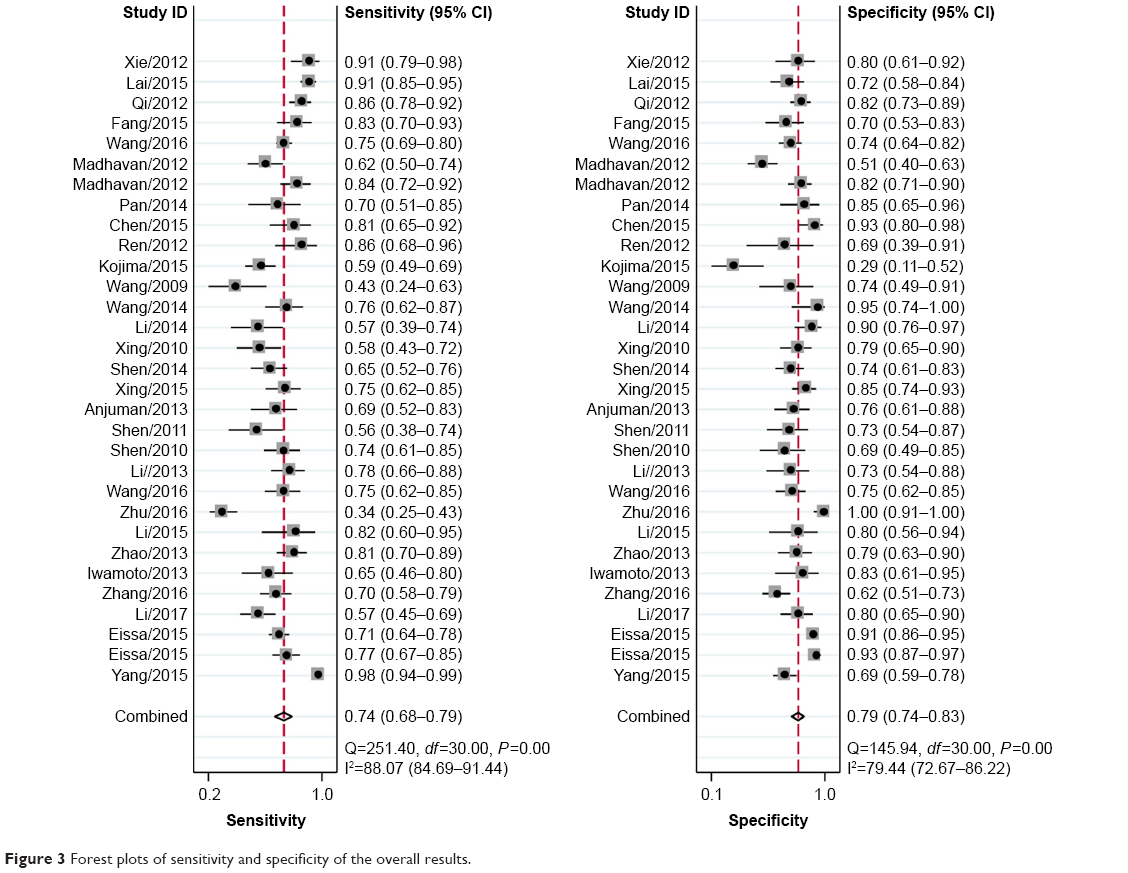 | Figure 3 Forest plots of sensitivity and specificity of the overall results. |
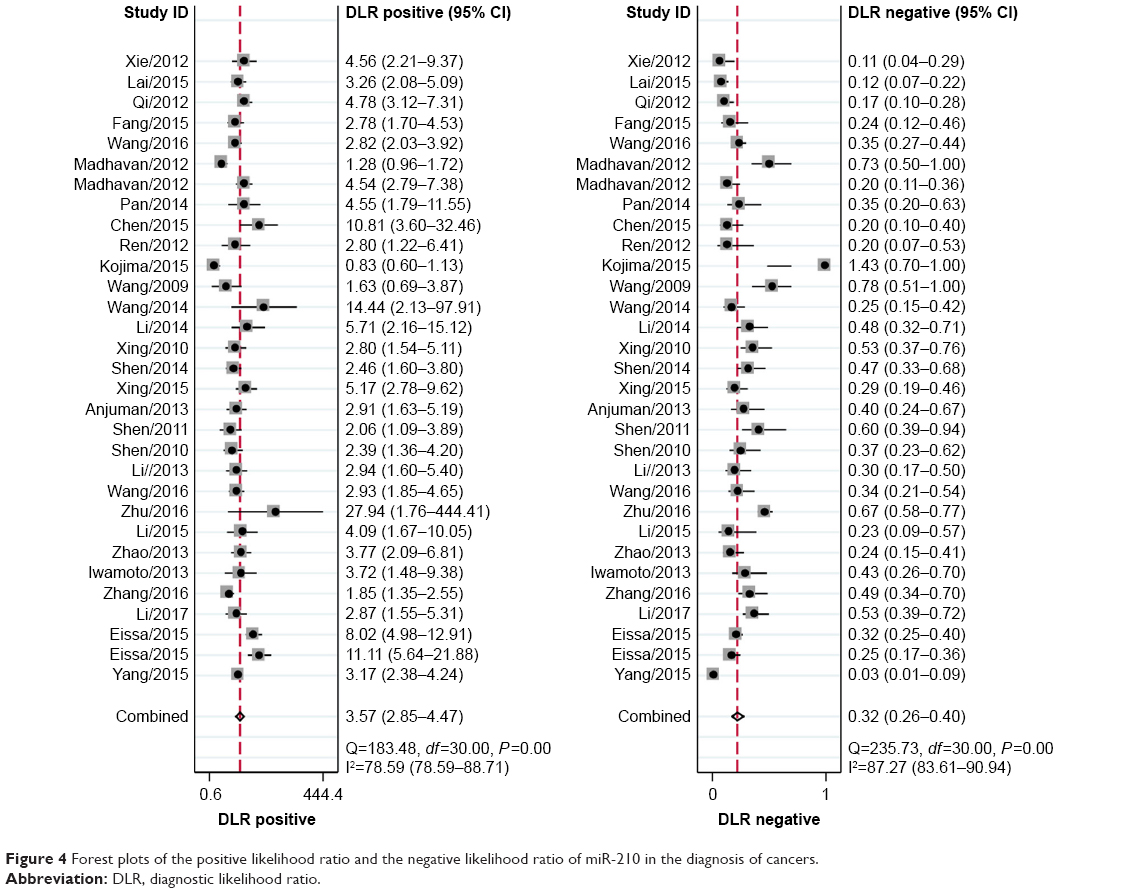 | Figure 4 Forest plots of the positive likelihood ratio and the negative likelihood ratio of miR-210 in the diagnosis of cancers. |
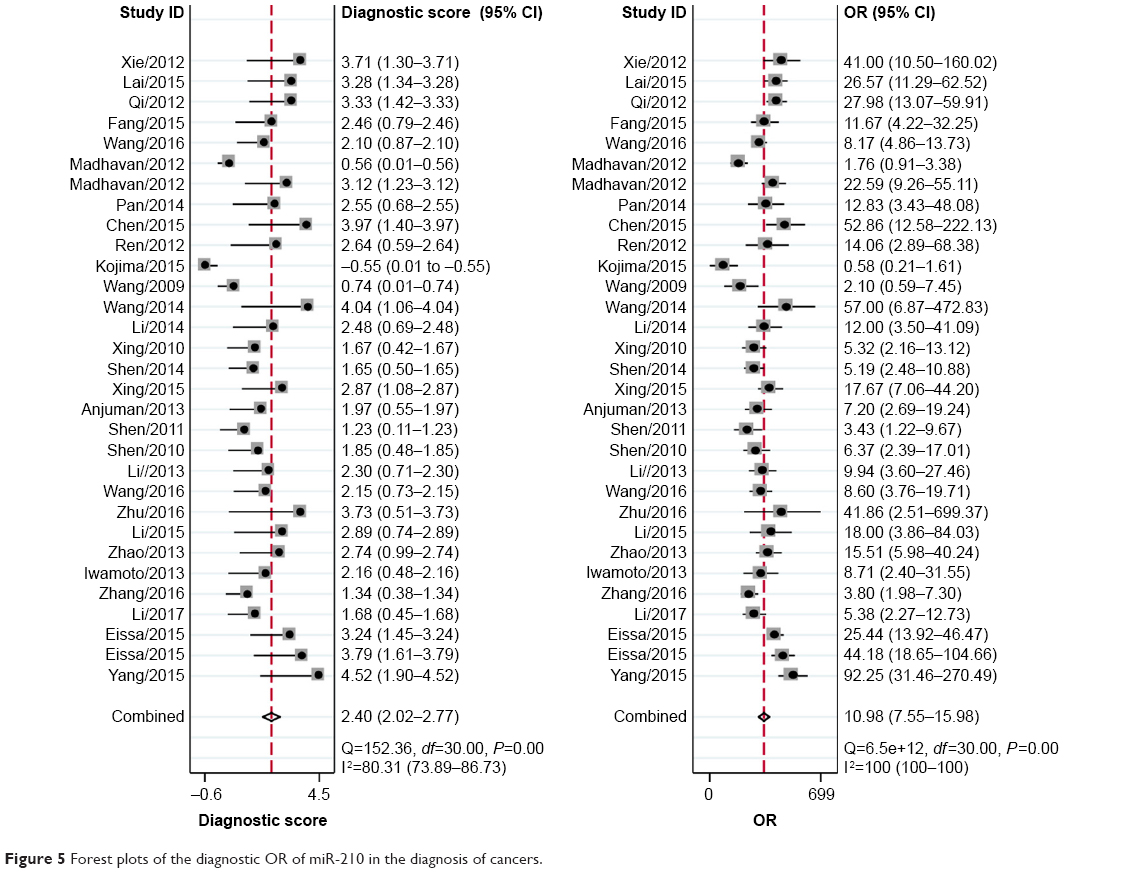 | Figure 5 Forest plots of the diagnostic OR of miR-210 in the diagnosis of cancers. |
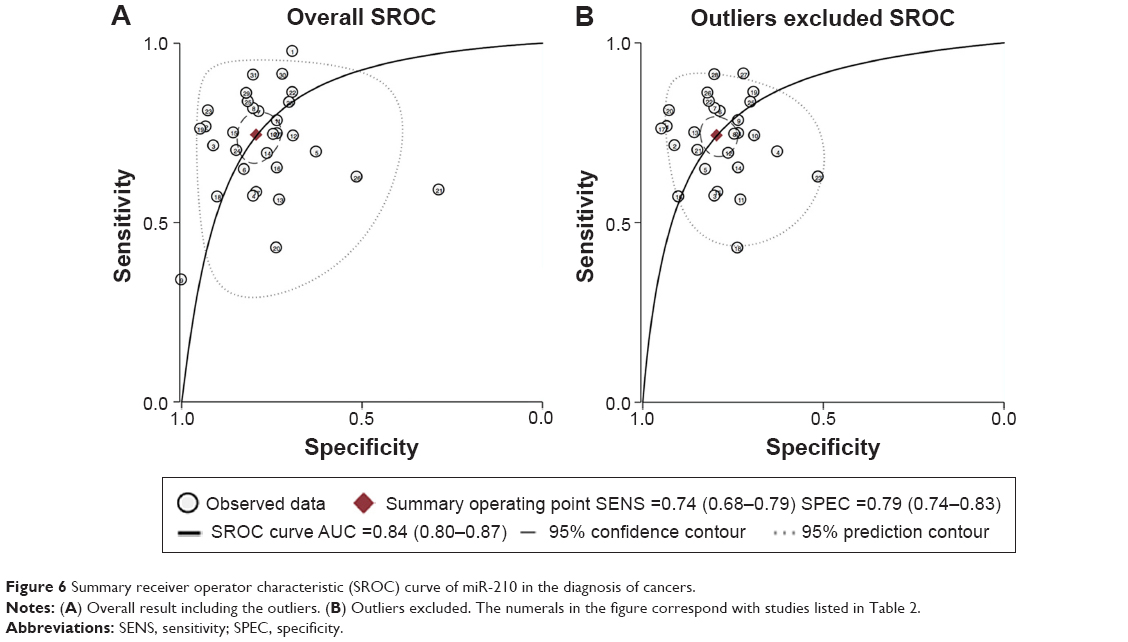 | Figure 6 Summary receiver operator characteristic (SROC) curve of miR-210 in the diagnosis of cancers. |
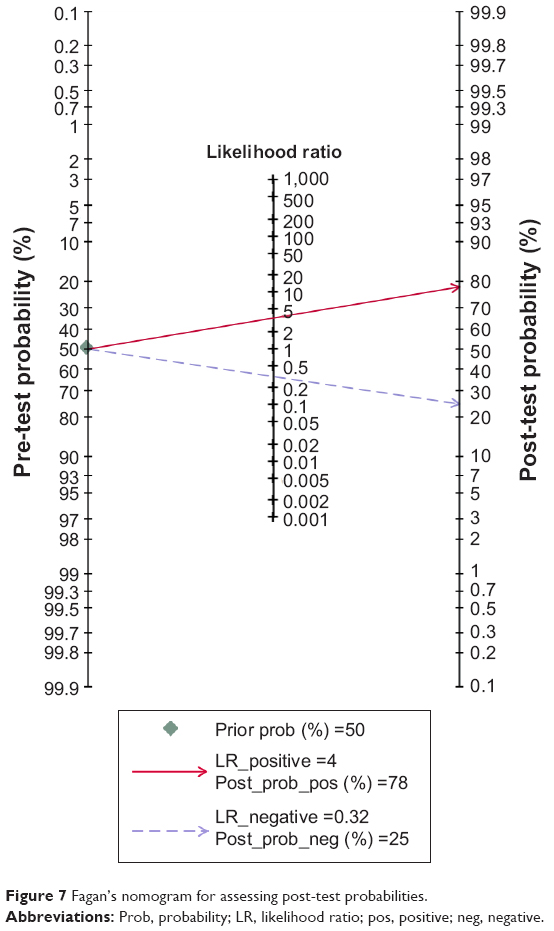 | Figure 7 Fagan’s nomogram for assessing post-test probabilities. |
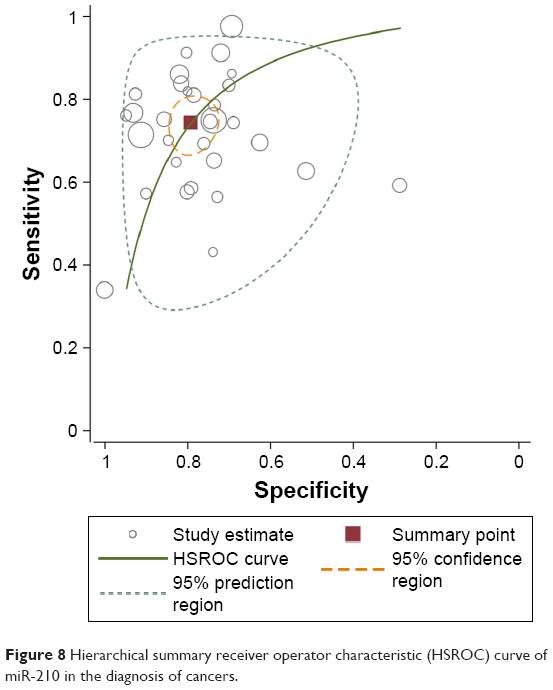 | Figure 8 Hierarchical summary receiver operator characteristic (HSROC) curve of miR-210 in the diagnosis of cancers. |
Meta-regression and robustness tests
In order to find potential sources of heterogeneity, we performed a meta-regression analysis based on variables including the number of cases (yes ≥60, no <60) and controls (yes ≥60, no <60), cancer type, sample type (blood-based: serum, non-blood-based: sputum, urine, pancreatic juice, fecal matter), normalizer, and ethnicity. As shown in Figure 9, several variables including normalizer (U6), ethnicity (mixed: Caucasian/African), the number of cases (yes ≥60, no <60), and cancer type (RCC, LC, PAAD) had a large effect on sensitivity. However, all variables had a great impact on specificity. Therefore, we then conducted subgroup analyses based on these factors. All results are presented in Table 4. Goodness-of-fit and bivariate normality analyses (Figure 10A and B) showed that the bivariate model was moderately robust. Influence analysis identified four outliers, while three outliers were found through outlier detection (Figure 10C and D). After comprehensive consideration, we decided to exclude these three outliers (①⑨ ) and retain the fourth outlier (). After exclusion, there was no significant change between these results and the overall results (Table 2).
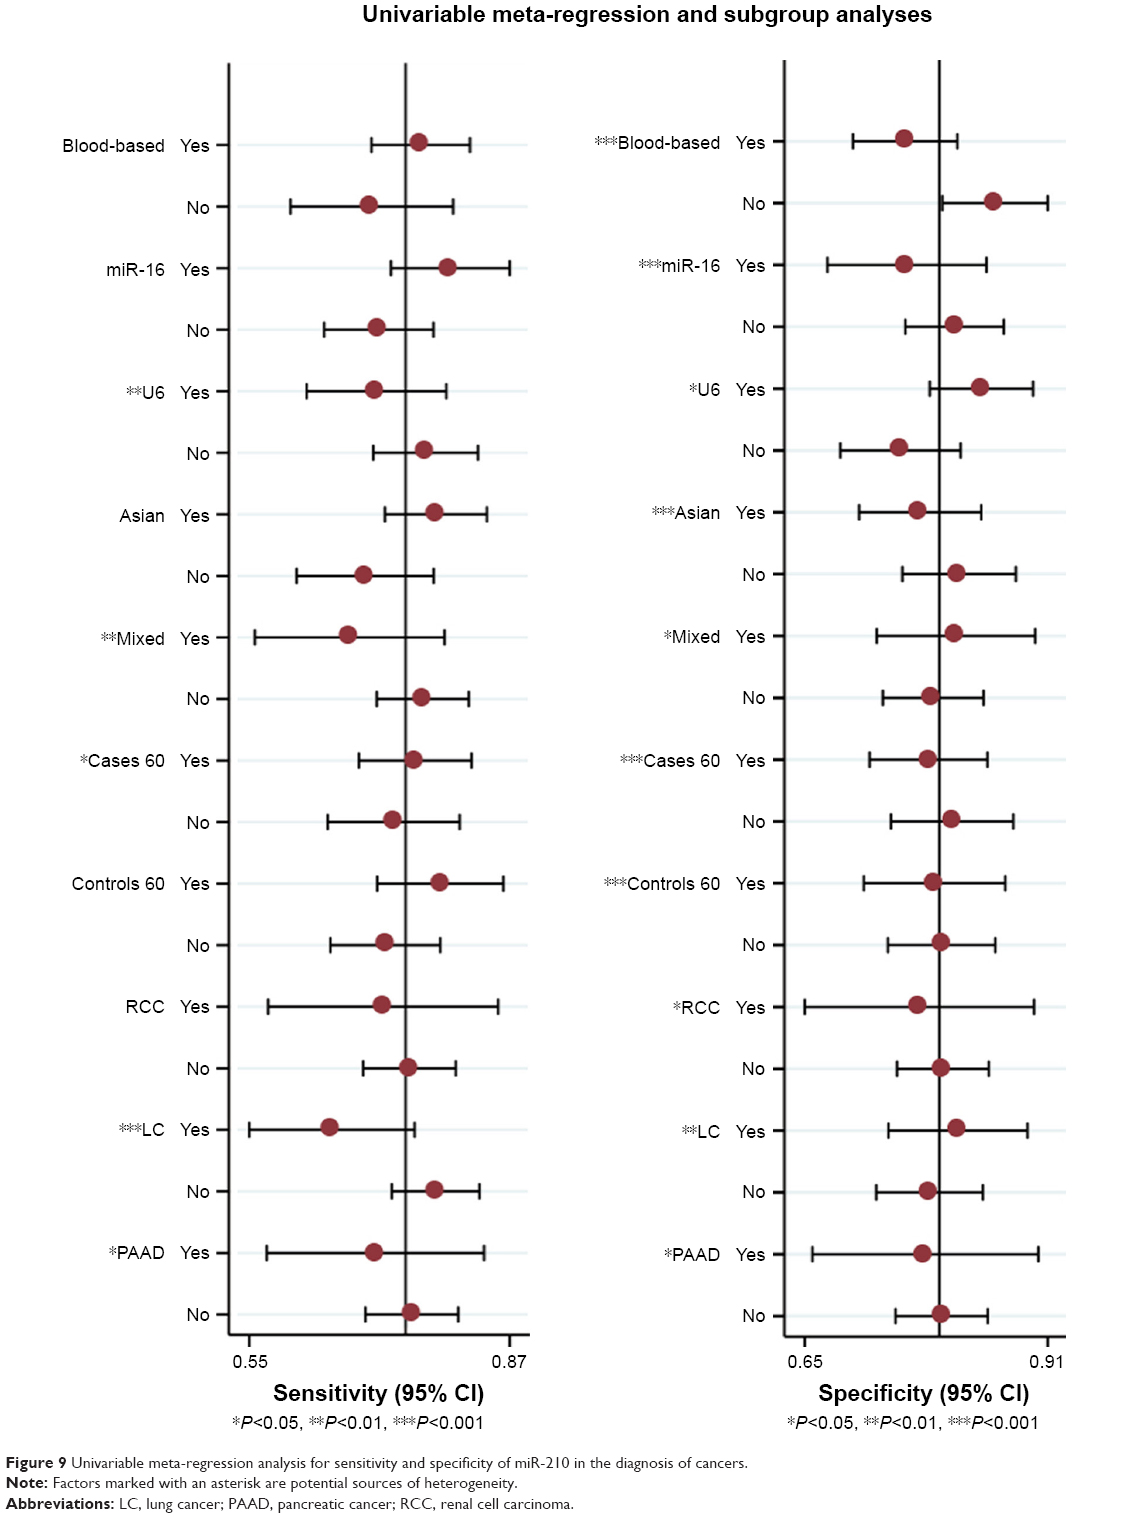 | Figure 9 Univariable meta-regression analysis for sensitivity and specificity of miR-210 in the diagnosis of cancers. |
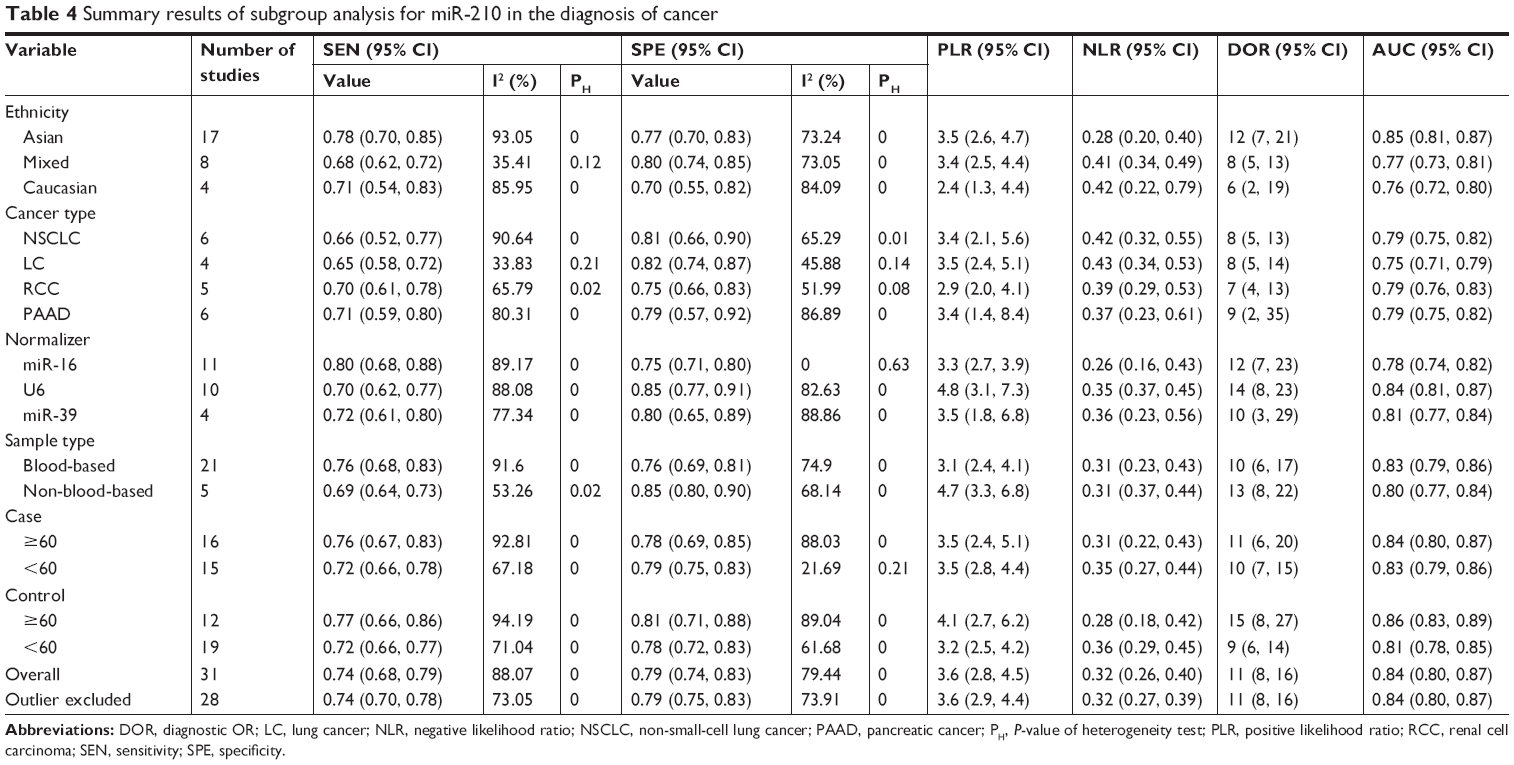 | Table 4 Summary results of subgroup analysis for miR-210 in the diagnosis of cancer |
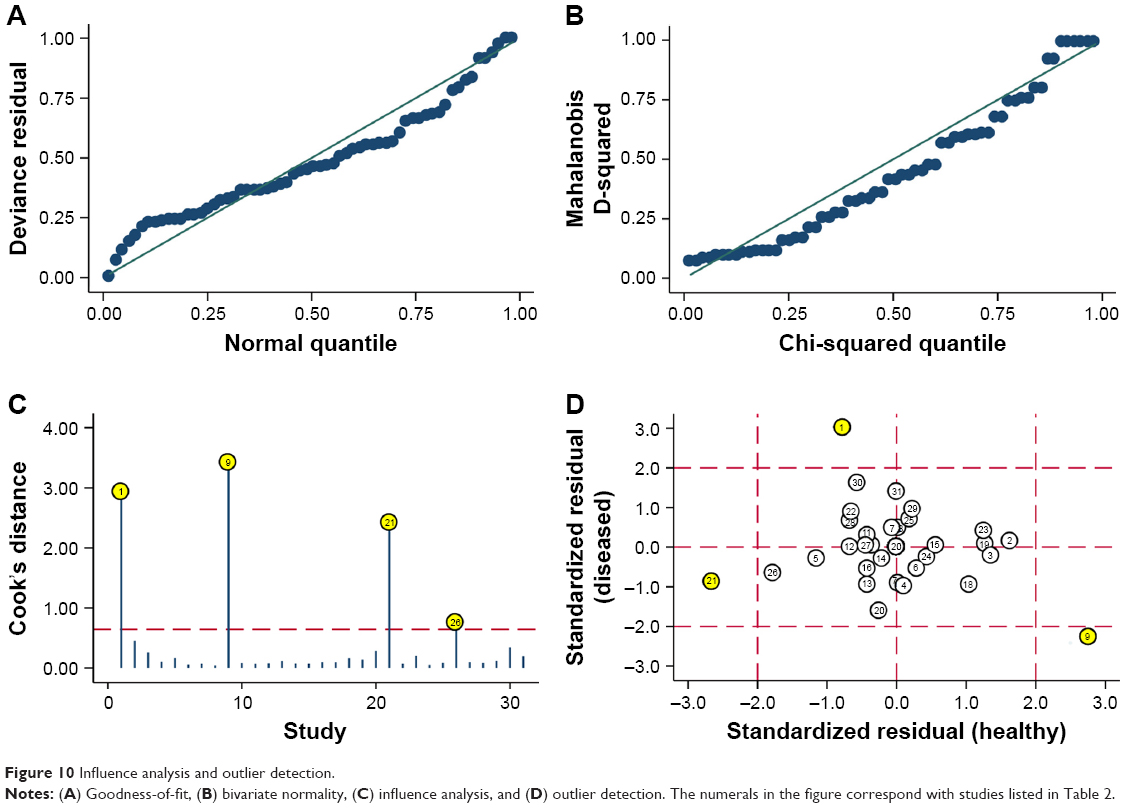 | Figure 10 Influence analysis and outlier detection. |
Threshold effect and heterogeneity
Both the ROC plane and Spearman rank correlation coefficient were conducted to evaluate the threshold effect because of differences among cut-off values. The ROC plane was generated using Stata 13.0, and displayed a non-typical shoulder arm appearance, indicating that there was no threshold effect (Figure 11A). The Spearman correlation coefficient was −0.15 (P=0.02), suggesting that there was no threshold effect. The I2 of the heterogeneity tests of sensitivity and specificity were 96.95% and 96.95%, respectively, indicating significant heterogeneity. Therefore, meta-regression analysis and subgroup analyses were used to explore potential sources of heterogeneity in sensitivity and specificity.
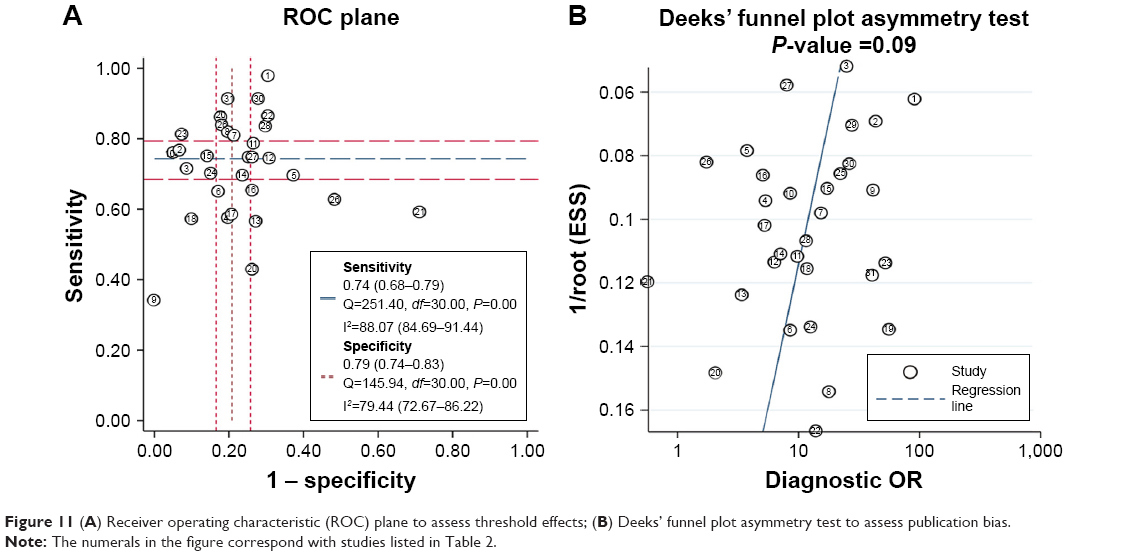 | Figure 11 (A) Receiver operating characteristic (ROC) plane to assess threshold effects; (B) Deeks’ funnel plot asymmetry test to assess publication bias. |
Publication bias
Deeks’ funnel plot asymmetry test was used to explore potential publication bias. The P-value of the linear regression was 0.09, suggesting that there was no publication bias (Figure 11B).
Discussion
With the rapid development of next-generation sequencing technology, a large number of genes have been identified to be dysregulated during expression and involved in the occurrence and development of tumors. In recent years, miRNAs have been identified to function as regulators of gene expression that contribute to tumorigenesis and tumor progression.20 Since miRNAs can be easily collected from body fluids such as plasma, serum, urine, and secretions using noninvasive procedures, accumulating evidence suggests that body fluid-based miRNAs could function as potential novel and noninvasive biomarkers for the detection and diagnosis of cancer.21,22 miR-210 is an miRNA that has been found to be up-regulated in various cancers compared with adjacent normal tissues.12,23,24 A large number of studies have revealed that miR-210 acts as an oncogene to promote tumor development and progression via different signaling pathways, including the NF-κB signaling pathway.25,26 Many studies have explored the possible clinical usage of miR-210 in detecting and diagnosing cancers. However, the overall diagnostic accuracy of miR-210 is inconsistent in the literature due to the inescapable limitations of each study. Although two previous meta-analyses about the diagnostic significance of miR-210 in the detection of cancer have already been published several years ago, there are some defects in these studies. To avoid the limitations mentioned previously, we conducted this meta-analysis to derive a more reliable conclusion of the overall accuracy of miR-210 in the detection and diagnosis of cancer.
The pooled overall sensitivity and specificity of the studies were 0.74 (95% CI: 0.68–0.79) and 0.79 (95% CI: 0.74–0.83), respectively (Figure 3). The I2 values for sensitivity and specificity were 88.07% (95% CI: 84.69–91.44) and 79.44% (95% CI: 72.67–86.22) respectively, suggesting significant heterogeneity in sensitivity and specificity. Therefore, meta-regression analysis and subgroup analysis were used to explore potential sources of heterogeneity in sensitivity and specificity. We found that ethnicity, cancer type, normalizer, sample type, and the number of cases and controls had great influence on inter-study heterogeneity, which can be seen in Figure 9. Therefore, we then conducted subgroup analyses of these factors. All results are presented in Table 4. The pooled PLR and NLR were 3.57 (95% CI: 2.85–4.47) and 0.32 (95% CI: 0.26–0.40), respectively. The DOR was 10.98 (95% CI: 7.55–15.98). The area under the SROC curve was 0.84 (95% CI: 0.80–0.87). The hierarchical summary operating point estimate of sensitivity and specificity were 0.74 (95% CI: 0.68–0.79) and 0.79 (95% CI: 0.74–0.83), respectively. The estimated value of β was −0.087 (95% CI: −0.55–0.38), the value of z was −0.37, and the P-value was 0.75, implying that the SROC curve was not symmetric. The value of lambda was 2.41 (95% CI: 2.03–2.79). Furthermore, Fagan’s nomogram was used to determine post-test probabilities resulting from different pre-test probabilities to explore the clinical value of miR-210. As shown in Figure 7, when miR-210 assays were tested for all individuals with a pre-test probability of 50% to get cancer, a positive result would increase the post-test probability of having cancer to 78%, while a negative result would decrease the post-test probability to 25%. All of these results revealed that miR-210 had relatively moderate accuracy in distinguishing cancer patients from all other individuals.
Several limitations of this study should still be highlighted for a comprehensive and synthetic interpretation. First, a majority of eligible studies did not mention the stage of cancer. Therefore, the present study did not evaluate differences in the diagnostic accuracy of miR-210 in various cancers at different stages. Second, not all of the studies reported a cutoff value for miR-210, which largely contributed to potential sources of heterogeneity. Third, the sample types were inconsistent and included serum (19 studies), sputum (five studies), urine (three studies), pancreatic juice (one study), and fecal matter (one study). Due to the limited study size of each individual study, subgroup analysis by sample type could not be explored. Fourth, the studies included were not randomly compared tests, implying that subjective judgement may exist, possibly leading to a low study quality QUADAS-2 score. Despite these limitations, our study is the most comprehensive meta-analysis to evaluate the diagnostic value of miR-210 for patients with various cancers.
Conclusion
To summarize, the results of this meta-analysis revealed that miR-210 had relatively moderate accuracy in distinguishing patients with various cancers from all other individuals, and provided comprehensive and synthetic evidence of miR-210 as a potential noninvasive biomarker in the detection and diagnosis of cancer. However, well-designed prospective studies with large sample sizes of different groups of the population are urgently needed to confirm our findings.
Acknowledgment
This research was supported by Health Care 3F Project of Shenzhen (Shanghai Jiao Tong University-Peking University Shenzhen Hospital, Academician Wenjiang Ding’s Team).
Disclosure
The authors report no conflicts of interest in this work.
References
Siegel RL, Miller KD, Jemal A. Cancer Statistics, 2017. CA Cancer J Clin. 2017;67(1):7–30. | ||
Chen W, Zheng R, Baade PD. Cancer statistics in China, 2015. CA Cancer J Clin Mar. 2016;66(2):115–132. | ||
Miller KD, Siegel RL, Lin CC, et al. Cancer treatment and survivorship statistics, 2016. CA Cancer J Clin. 2016;66(4):271–289. | ||
Dbouk HA, Tawil A, Nasr F, Kandakarjian L, Abou-Merhi R. Significance of CEA and VEGF as Diagnostic Markers of Colorectal Cancer in Lebanese Patients. Open Clin Cancer J. 2007;1:1–5. | ||
Lumachi F, Brandes AA, Ermani M, Bruno G, Boccagni P. Sensitivity of serum tumor markers CEA and CA 15-3 in breast cancer recurrences and correlation with different prognostic factors. Anticancer Res. 2000;20(6C):4751–4755. | ||
Ohi M, Ito K, Suzuki K, Yamamoto T, Yamanaka H. Diagnostic significance of PSA density adjusted by transition zone volume in males with PSA levels between 2 and 4ng/ml. Eur Urol. 2004;45(1):92–97. | ||
Zeana C, Macarie C. On the diagnostic value of alpha-1-fetoprotein (AFP) in hepatocellular carcinoma. Acta Med Pol. 1976;17(2):159–163. | ||
Di Leva G, Garofalo M, Croce CM. MicroRNAs in cancer. Annu Rev Pathol. 2014;9:287–314. | ||
Ebert MS, Sharp PA. Roles for microRNAs in conferring robustness to biological processes. Cell. 2012;149(3):515–524. | ||
Hou Y, Wang X, Chen Y, Mu S. MicroRNA-145 as ideal biomarker for the diagnosis of various carcinomas. Tumour Biol. 2015;36(4):2641–2649. | ||
Zhou Q, Huang SX, Zhang F, et al. MicroRNAs: A novel potential biomarker for diagnosis and therapy in patients with non-small cell lung cancer. Cell Prolif. 2017;50(6):e12394. | ||
Hong L, Han Y, Zhang H, Zhao Q, Qiao Y. miR-210: a therapeutic target in cancer. Expert Opin Ther Targets. 2013;17(1):21–28. | ||
Lu J, Xie F, Geng L, Shen W, Sui C, Yang J. Potential Role of MicroRNA-210 as Biomarker in Human Cancers Detection: A Meta-Analysis. Biomed Res Int. 2015;2015:1–9. | ||
Yang H, Wang H, Zhang C, Tong Z. The accuracy of microRNA-210 in diagnosing lung cancer: a systematic review and meta-analysis. Oncotarget. 2016;7(39):63283–63293. | ||
Whiting PF, Rutjes AW, Westwood ME, et al. QUADAS-2: a revised tool for the quality assessment of diagnostic accuracy studies. Ann Intern Med. 2011;155(8):529–536. | ||
Vamvakas EC. Meta-analyses of studies of the diagnostic accuracy of laboratory tests: a review of the concepts and methods. Arch Pathol Lab Med. 1998;122(8):675–686. | ||
Rutter CM, Gatsonis CA. A hierarchical regression approach to meta-analysis of diagnostic test accuracy evaluations. Stat Med. 2001;20(19):2865–2884. | ||
Dinnes J, Deeks J, Kirby J, Roderick P. A methodological review of how heterogeneity has been examined in systematic reviews of diagnostic test accuracy. Health Technol Assess. 2005;9(12):1–113, iii. | ||
Deeks JJ, Macaskill P, Irwig L. The performance of tests of publication bias and other sample size effects in systematic reviews of diagnostic test accuracy was assessed. J Clin Epidemiol. 2005;58(9):882–893. | ||
Wang QX, Zhu YQ, Zhang H, Xiao J. Altered MiRNA expression in gastric cancer: a systematic review and meta-analysis. Cell Physiol Biochem. 2015;35(3):933–944. | ||
Yang Y, Qu A, Liu J, et al. Serum miR-210 Contributes to Tumor Detection, Stage Prediction and Dynamic Surveillance in Patients with Bladder Cancer. PLoS One. 2015;10(8):e0135168. | ||
Petrozza V, Pastore AL, Palleschi G, et al. Secreted miR-210-3p as non-invasive biomarker in clear cell renal cell carcinoma. Oncotarget. 2017;8(41):69551–69558. | ||
Liu D, Xia H, Wang F, Chen C, Long J. MicroRNA-210 interacts with FBXO31 to regulate cancer proliferation cell cycle and migration in human breast cancer. Onco Targets Ther. 2016;9:5245–5255. | ||
Liu TY, Zhang H, Du SM, Li J, Wen XH. Expression of microRNA-210 in tissue and serum of renal carcinoma patients and its effect on renal carcinoma cell proliferation, apoptosis, and invasion. Genet Mol Res. 2016;15(1):15017746. | ||
Zhang C, Tian W, Meng L, Qu L, Shou C. PRL-3 promotes gastric cancer migration and invasion through a NF-κB-HIF-1α-miR-210 axis. J Mol Med. 2016;94(4):401–415. | ||
Ren D, Yang Q, Dai Y, et al. Oncogenic miR-210-3p promotes prostate cancer cell EMT and bone metastasis via NF-κB signaling pathway. Mol Cancer. 2017;16(1):117. | ||
Yang Y, Qu A, Liu J, et al. Serum miR-210 Contributes to Tumor Detection, Stage Prediction and Dynamic Surveillance in Patients with Bladder Cancer. PLoS One. 2015;10(8):e0135168. | ||
Eissa S, Matboli M, Essawy NO, Kotb YM. Integrative functional genetic-epigenetic approach for selecting genes as urine biomarkers for bladder can et alcer diagnosis. Tumour Biol. 2015;36(12):9545–9552. | ||
Eissa S, Matboli M, Hegazy MG, Kotb YM, Essawy NO. Evaluation of urinary microRNA panel in bladder cancer diagnosis: relation to bilharziasis. Transl Res. 2015;165(6):731–739. | ||
Li G, Zhao A, Peoch M, Cottier M, Mottet N. Detection of urinary cell-free miR-210 as a potential tool of liquid biopsy for clear cell renal cell carcinoma. Urol Oncol. 2017;35(5):294–299. | ||
Zhang W, Ni M, Su Y, et al. MicroRNAs in Serum Exosomes as Potential Biomarkers in Clear-cell Renal Cell Carcinoma. Eur Urol Focus. 2018;4(3):412–419. | ||
Iwamoto H, Kanda Y, Sejima T, Osaki M, Okada F, Takenaka A. Serum miR-210 as a potential biomarker of early clear cell renal cell carcinoma. Int J Oncol. 2014;44(1):53–58. | ||
Zhao A, Li G, Peoc’h M, Genin C, Gigante M. Serum miR-210 as a novel biomarker for molecular diagnosis of clear cell renal cell carcinoma. Exp Mol Pathol. 2013;94(1):115–120. | ||
Li D, Shu B, Tang S, Bi X, Chen P. Expresion of plasma miR-210 miR-378 and theirs clinical significance in renal clear cel carcinoma. Clin Urology (China). 2015;30(10):897–901. | ||
Zhu W, Zhou K, Zha Y, et al. Diagnostic Value of Serum miR-182, miR-183, miR-210, and miR-126 Levels in Patients with Early-Stage Non-Small Cell Lung Cancer. PLoS One. 2016;11(4):e0153046. | ||
Wang X, Zhi X, Zhang Y, An G, Feng G. Role of plasma MicroRNAs in the early diagnosis of non-small-cell lung cancers: a case-control study. J Thorac Dis. 2016;8(7):1645–1652. | ||
Li ZH, Zhang H, Yang ZG, Wen GQ, Cui YB, Shao GG. Prognostic significance of serum microRNA-210 levels in nonsmall-cell lung cancer. J Int Med Res. 2013;41(5):1437–1444. | ||
Shen J, Todd NW, Zhang H, et al. Plasma microRNAs as potential biomarkers for non-small-cell lung cancer. Lab Invest. 2010;91(4):579–587. | ||
Shen J, Liu Z, Todd NW, et al. Diagnosis of lung cancer in individuals with solitary pulmonary nodules by plasma microRNA biomarkers. BMC Cancer. 2011;11:374. | ||
Anjuman N, Li N, Guarnera M, Stass SA, Jiang F. Evaluation of lung flute in sputum samples for molecular analysis of lung cancer. Clin Transl Med. 2013;2(1):15. | ||
Xing L, Su J, Guarnera MA, et al. Sputum microRNA biomarkers for identifying lung cancer in indeterminate solitary pulmonary nodules. Clin Cancer Res. 2015;21(2):484–489. | ||
Shen J, Liao J, Guarnera MA, et al. Analysis of MicroRNAs in sputum to improve computed tomography for lung cancer diagnosis. J Thorac Oncol. 2014;9(1):33–40. | ||
Xing L, Todd NW, Yu L, Fang H, Jiang F. Early detection of squamous cell lung cancer in sputum by a panel of microRNA markers. Mod Pathol. 2010;23(8):1157–1164. | ||
Li N, Ma J, Guarnera MA, Fang H, Cai L, Jiang F. Digital PCR quantification of miRNAs in sputum for diagnosis of lung cancer. J Cancer Res Clin Oncol. 2014;140(1):145–150. | ||
Wang J, Raimondo M, Guha S, et al. Circulating microRNAs in Pancreatic Juice as Candidate Biomarkers of Pancreatic Cancer. J Cancer. 2014;5(8):696–705. | ||
Wang J, Chen J, Chang P, et al. MicroRNAs in plasma of pancreatic ductal adenocarcinoma patients as novel blood-based biomarkers of disease. Cancer Prev Res (Phila). 2009;2(9):807–813. | ||
Kojima M, Sudo H, Kawauchi J, et al. MicroRNA markers for the diagnosis of pancreatic and biliary-tract cancers. PLoS One. 2015;10(2):e0118220. | ||
Ren Y, Gao J, Liu JQ, et al. Differential signature of fecal microRNAs in patients with pancreatic cancer. Mol Med Rep. 2012;6(1):201–209. | ||
Chen WJ, Chen MF, Wang P, et al. Application of combined detection of serum miR-210 and CA199 in the diagnosis of pancreatic carcinoma. Chin J Health Lab Technol. 2015;25(20):3481–3483. | ||
Pan W, Tang W, Yuan W, et al. Expression and clinical significance of plasma small RNA in patients with pancreatic cancer. Zhonghua Zhong Liu Za Zhi. 2014;36(5):351–354. | ||
Madhavan D, Zucknick M, Wallwiener M, et al. Circulating miRNAs as surrogate markers for circulating tumor cells and prognostic markers in metastatic breast cancer. Clin Cancer Res. 2012;18(21):5972–5982. | ||
Wang W, Qu A, Liu W, et al. Circulating miR-210 as a diagnostic and prognostic biomarker for colorectal cancer. Eur J Cancer Care (Engl). 2017;26(4). | ||
Fang Q, Qu A, Zhang X, et al. Expression and clinical significance of miR-210 in the serum of patients with colorectal cancer. J Shandong Univ(Heal Sci). 2015;53(6):77–81. | ||
Qi JP, Shi AP, Feng F et al. The diagnostic value of serum microRNA-210 in gastric cancer. J Mod Oncol. 2016;24(4):597–599. | ||
Lai NS, Wu DG, Fang XG, et al. Serum microRNA-210 as a potential noninvasive biomarker for the diagnosis and prognosis of glioma. Br J Cancer. 2015;112(7):1241–1246. | ||
Xie HT, Chu ZX, Wang H. Serum microRNA expression profile as a biomarker in diagnosis and prognosis of acute myeloid leukemia. J Clin Pediatr. 2015;30(5):421–424. |
 © 2019 The Author(s). This work is published and licensed by Dove Medical Press Limited. The full terms of this license are available at https://www.dovepress.com/terms.php and incorporate the Creative Commons Attribution - Non Commercial (unported, v3.0) License.
By accessing the work you hereby accept the Terms. Non-commercial uses of the work are permitted without any further permission from Dove Medical Press Limited, provided the work is properly attributed. For permission for commercial use of this work, please see paragraphs 4.2 and 5 of our Terms.
© 2019 The Author(s). This work is published and licensed by Dove Medical Press Limited. The full terms of this license are available at https://www.dovepress.com/terms.php and incorporate the Creative Commons Attribution - Non Commercial (unported, v3.0) License.
By accessing the work you hereby accept the Terms. Non-commercial uses of the work are permitted without any further permission from Dove Medical Press Limited, provided the work is properly attributed. For permission for commercial use of this work, please see paragraphs 4.2 and 5 of our Terms.