")
Back to Journals » Infection and Drug Resistance » Volume 14
Diagnostic Performance of GeneChip for the Rapid Detection of Drug-Resistant Tuberculosis in Different Subgroups of Patients
Authors Shi J, Tao B , Li Z , Song H, Wu J, Qiu B , Wang J
Received 16 December 2020
Accepted for publication 27 January 2021
Published 17 February 2021 Volume 2021:14 Pages 597—608
DOI https://doi.org/10.2147/IDR.S297725
Checked for plagiarism Yes
Review by Single anonymous peer review
Peer reviewer comments 2
Editor who approved publication: Prof. Dr. Héctor Mora-Montes
Jinyan Shi,1,* Bilin Tao,2,* Zhongqi Li,2 Huan Song,2 Jizhou Wu,2 Beibei Qiu,2 Jianming Wang2
1Department of Clinical Laboratory, The Fourth People’s Hospital of Lianyungang, Lianyungang, Jiangsu, People’s Republic of China; 2Department of Epidemiology, Center for Global Health, School of Public Health, Nanjing Medical University, Nanjing, People’s Republic of China
*These authors contributed equally to this work
Correspondence: Jianming Wang
Department of Epidemiology, Center for Global Health, School of Public Health, Nanjing Medical University, 101 Longmian Ave, Nanjing, 211166, People’s Republic of China
Tel +86-25-86868438
Email [email protected]
Objective: Drug-resistant tuberculosis (DR-TB) is a growing problem worldwide. The rapid drug susceptibility test (DST) of DR-TB enables the timely administration of a chemotherapy regimen that effectively treats DR-TB. GeneChip has been reported as a novel molecular diagnostic tool for rapid diagnosis but has limited data on the performance of subgroup patients with DR-TB. This study aims to assess the diagnostic value of GeneChip in patients with different sexes, ages, treatment histories, treatment outcomes, and places of residence.
Methods: We recruited newly registered sputum smear-positive pulmonary TB patients from January 2011 to September 2020 in Lianyungang City, Jiangsu Province, China. We applied both GeneChip and DST to measure drug resistance to rifampin (RIF) and isoniazid (INH). The kappa value, sensitivity, specificity, and agreement rate (AR) were calculated. We also applied a Classification and Regression Tree to explore factors related to the performance of GeneChip.
Results: We observed that sex, age, treatment history, treatment outcomes, and drug resistance type were significantly associated with the performance of GeneChip. For RIF resistance, there was significant accordance in young patients (kappa: 0.79) and cases with the treatment failure outcome (kappa: 0.92). For multidrug resistance (MDR), there was significant accordance in young cases (kappa: 0.77). Compared with previously treated patients, the newly treated patients had a significantly higher AR in detecting RIF resistance (0.97 vs 0.92), INH resistance (0.95 vs 0.89), and MDR (0.98 vs 0.92). The overall sensitivity, specificity, AR and kappa value for the diagnosis of MDR-TB were 0.70 (95% CI: 0.63– 0.70), 0.99 (95% CI: 0.98– 0.99), 0.98 (95% CI: 0.97– 0.98), and 0.72 (95% CI: 0.67– 0.78), respectively.
Conclusion: We observed a high concordance between GeneChip and DST among TB patients with different characteristics, indicating that GeneChip can be a potential alternative tool for rapid MDR-TB detection.
Keywords: tuberculosis, drug resistance, GeneChip, diagnosis, drug susceptibility test
Introduction
Tuberculosis (TB) is a chronic communicable disease that remains a significant public health concern worldwide. Globally, an estimated 10.0 million (range: 8.9–11.0 million) people fell ill with TB in 2019, and an estimated 1.4 million TB deaths occurred.1 Treatment of drug-susceptible TB is based on the principle of combined chemotherapy for several months by using the first-line drugs isoniazid (INH), rifampin (RIF), pyrazinamide (PZA), ethambutol (EMB), and/or streptomycin (SM).2 Multidrug resistance (MDR) is defined as Mycobacterium tuberculosis (M.tb), which is resistant to at least RIF and INH, the two most potent anti-TB drugs.3 MDR-TB results from either infection with already drug-resistant organisms or may develop during the treatment course, which poses the greatest obstacle to success in the “end TB” strategy.1 The wide application of anti-TB drugs, especially when these drugs are misused or mismanaged, exacerbates the occurrence of drug-resistance.4 Although historically MDR-TB was predominantly caused by mismanagement of treatment, the direct transmission of the MDR-TB pathogen has been identified as a severe problem worldwide.5,6
The culture-based drug-susceptibility test (DST) is the gold-standard assay for testing drug resistance, but it takes several weeks to obtain results,7 and access to the necessary laboratory facilities in countries with a heavy disease burden is often scarce.8 A traditional phenotypic DST for M.tb does not meet the goals of the early diagnosis and targeted regime of TB treatment. Therefore, highly sensitive, specific, easy-to-apply, time-saving, and cost-effective methods are urgently required to promote the diagnosis of MDR-TB and improve treatment outcomes.9–11
Several molecular techniques have been applied to identify M.tb isolates and drug resistance, including real-time polymerase chain reaction (RT-PCR), line probe assays (LPAs), DNA sequencing, and oligonucleotide or DNA microarrays.12,13 The GeneChip MDR kit (CapitalBio, Beijing, China) was designed to identify common mutations related to RIF and INH resistance in the rpoB, katG, and inhA genes based on molecular analyses from multiple PCRs and reverse hybridization. By uncovering mutations in these genes, GeneChip can detect M.tb and its MDR form from sputum samples. Most importantly, the entire procedure of the GeneChip assay only takes 6 hours.14,15 A systematic review consisting of 159 studies revealed that the pooled sensitivity of GeneChip microarrays was 0.89 (95% CI: 0.86–0.91) for detecting drug resistance to RIF, 0.79 (95% CI: 0.75–0.82) for detecting drug resistance to INH, and 0.79 (95% CI: 0.73–0.84) for detecting MDR-TB. The specificity of identifying the above three types of drug resistance was >97%.16 GeneChip has been regarded as a more cost-effective method of diagnosing MDR-TB over the conventional DST.17 However, there is a lack of data to assess its value in different subgroups of DR-TB patients.
Thus, we performed a molecular epidemiological study to evaluate the diagnostic performance of GeneChip in detecting drug resistance to RIF and INH, the two most effective drugs against M.tb, in overall and subgroup TB patients in a Chinese population.
Materials and Methods
Study Sites and Data Collection
We recruited newly registered sputum smear-positive pulmonary TB patients from January 2011 to September 2020 in Lianyungang City, Jiangsu Province, China. We used a questionnaire to collect the patient’s characteristics, including age, sex, treatment history, treatment outcomes, and place of residence. Two sputum samples were collected from each patient and transported to corresponding prefectural or municipal laboratories within three days after collection. Each sample was divided into two aliquots for drug resistance detection, where one was used for a culture-based traditional DST and another was used for GeneChip.
Sputum Culture and Traditional DST
Sputum samples were cultured on Löwenstein-Jensen (L-J) medium at 37°C. We identified the M.tb isolates by p-nitrobenzoic acid and thiophene carboxylic acid hydrazine resistance tests. Species other than M.tb were excluded from the current analysis. We then detected the drug susceptibility of M.tb with L-J medium supplemented with RIF and INH. The DST was performed according to the proportion method recommended by the World Health organization (WHO) and International Union against Tuberculosis and Lung Disease (IUATLD). For internal quality assurance, a standard H37Rv strain was included with each new batch of L-J medium, and a DST was also performed when readings were performed after 4 and 6 weeks. External quality control for culture and the DST was conducted by the provincial TB reference laboratory, which participates in the annual proficiency review of the DST organized by the Hong Kong Supranational Tuberculosis Reference Laboratory and has passed each audit since 2010. The anti-TB drug concentration was 0.2 μg/mL for INH and 40 μg/mL for RIF. An isolate was confirmed to be a drug-resistant strain if there was more than 1% colony growth on the drug-containing medium compared with the control. Otherwise, it was declared sensitive to the specific drug.
GeneChip Assay
The GeneChip assay (CapitalBio) was performed according to the manufacturer’s instructions.14,18 In brief, sputum specimens were centrifuged to pellet the bacteria and then liquefied with 10% NaOH. The pellet obtained after discarding the supernatant was resuspended in 0.9% saline and centrifuged again. The pellet was resuspended in Tris-EDTA buffer and transferred to an extraction tube. The materials and reagents of DNA extraction were supplied in the CapitalBio Universal Kit (CapitalBio). Total DNA was isolated and the extraction tube was incubated at 95°C for 5 min, centrifuged briefly, and then stored at −20°C until use. Oligonucleotide probes were printed onto OPAldehyde SlideTM aldehyde-activated slides at a concentration of 10 μM in DNA Spotting Solution using a SmartArrayer-48 microarrayer (CapitalBio) and were covalently immobilized on slides via an amino group at their 5ʹ ends to create the gene chips.
Uracil DNA glycosylase and dUTP were used to prevent carry-over contamination during amplification. Multiplex asymmetric PCR was performed in two amplification rounds. After the initial activation step at 37°C for 10 min, DNA was denatured at 94°C for 10 min, followed by the first round of exponential amplification with 35 cycles at 94°C for 30 s, 60°C for 30 s and 72°C for 40 s; the second round of linear amplification with 10 cycles at 94°C for 30 s and 72°C for 60 s; and a final extension step at 72°C for 5 min. GeneChip hybridization was performed in a BioMixer II hybridization oven (CapitalBio). After hybridization, slides were washed and dried by spinning. A confocal LuxScan-10K laser scanner (CapitalBio) was applied to analyze microarrays on the slides. Fluorescent intensities were quantified by using the M.tb Drug Resistance Detection Array Test System (CapitalBio). The drug resistance pattern for RIF and INH can be found in the manufacturer’s instructions.14 All technicians were trained by the National TB Reference Laboratory and confirmed by proficiency testing.
Statistical Analysis
Normally distributed data are described as the mean ± standard deviation. One-way analysis of variance (ANOVA) was used to compare continuous variables between groups. Categorized variables are expressed as percentages; these variables were analyzed by the chi-square test. We used the R package “confusionMatrix” to calculate the kappa value, sensitivity, specificity, positive predictive value (PPV), negative predictive value (NPV), and agreement rate (AR) of GeneChip testing. We also applied the Classification and Regression Tree (CART)19 to explore factors related to the performance of GeneChip by the R package “party”. Differences of independent kappa between groups were analyzed by the Fleiss method using an R package of “multiagree”.20 Differences in sensitivity, specificity, PPV, and NPV between subgroups were compared by the chi-square test. The significance level was set at 0.05. All analyses were performed using R software for Windows version 4.0.3 (https://www.r-project.org/).
Ethics Statement
This study was approved by the Ethics Committee of Nanjing Medical University. After informed consent was obtained from all participants, questionnaires were used to collect demographic data. All procedures performed involving human participants were in accordance with the ethical standards of the institutional and national research committee and with the Declaration of Helsinki.
Results
General Characteristics
We collected 5946 sputum smear-positive TB samples in the study area. After excluding 700 sputum culture-negative samples, 49 culture medium-contaminated samples, 516 nontuberculous mycobacteria (NTM) infection samples, and 540 samples without drug-resistant results by both DST and GeneChip, 4141 samples remained for analysis (Figure 1). The age of the study subjects ranged from 12 years to 94 years (50.7 ±20.3 years). There were 3219 (77.7%) males, 3648 (88.1%) newly treated cases, 110 (2.7%) cases with treatment failure outcomes, and 2929 (70.3%) cases with patients living in rural areas.
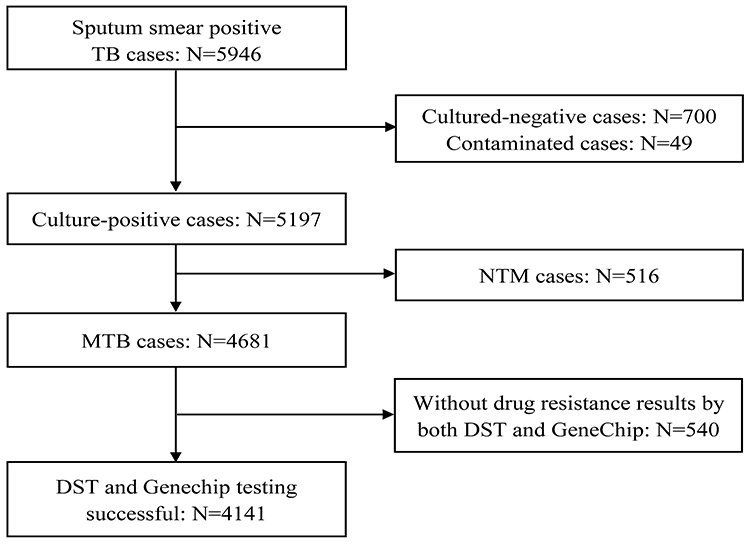 |
Figure 1 Flow chart of TB cases included in this study. Abbreviations: TB, tuberculosis; M.tb, Mycobacterium tuberculosis; NTM, nontuberculous mycobacterium; MDR, multidrug resistance. |
There was a significantly higher prevalence of RIF resistance in females (9.10% vs 6.09%), young cases (8.43% vs 5.06%), previously treated cases (19.88% vs 4.98%), treatment failure cases (20.91% vs 6.37%) and urban cases (9.90% vs 5.46%) (P <0.05). Similar results were found in INH resistance and MDR. Females (12.58% vs 9.91%), previously treated cases (25.76% vs 8.44%), treatment failure cases (21.82% vs 10.20%) and urban cases (13.28% vs 9.35%) had a higher INH resistance (P <0.05). Females (6.62% vs 4.41%), young cases (6.09% vs 3.70%), previously treated cases (15.21% vs 3.51%), treatment failure cases (13.64% vs 4.67%) and urban cases (7.67% vs 3.76%) had a higher MDR prevalence (P <0.05) (Table 1). The characteristics (sex, age, treatment history, treatment failure, and place of residence) of TB patients were significantly associated with the diagnostic performance of GeneChip (P <0.05), except for drug resistance to INH within sex-specific or age-specific groups (Table 1).
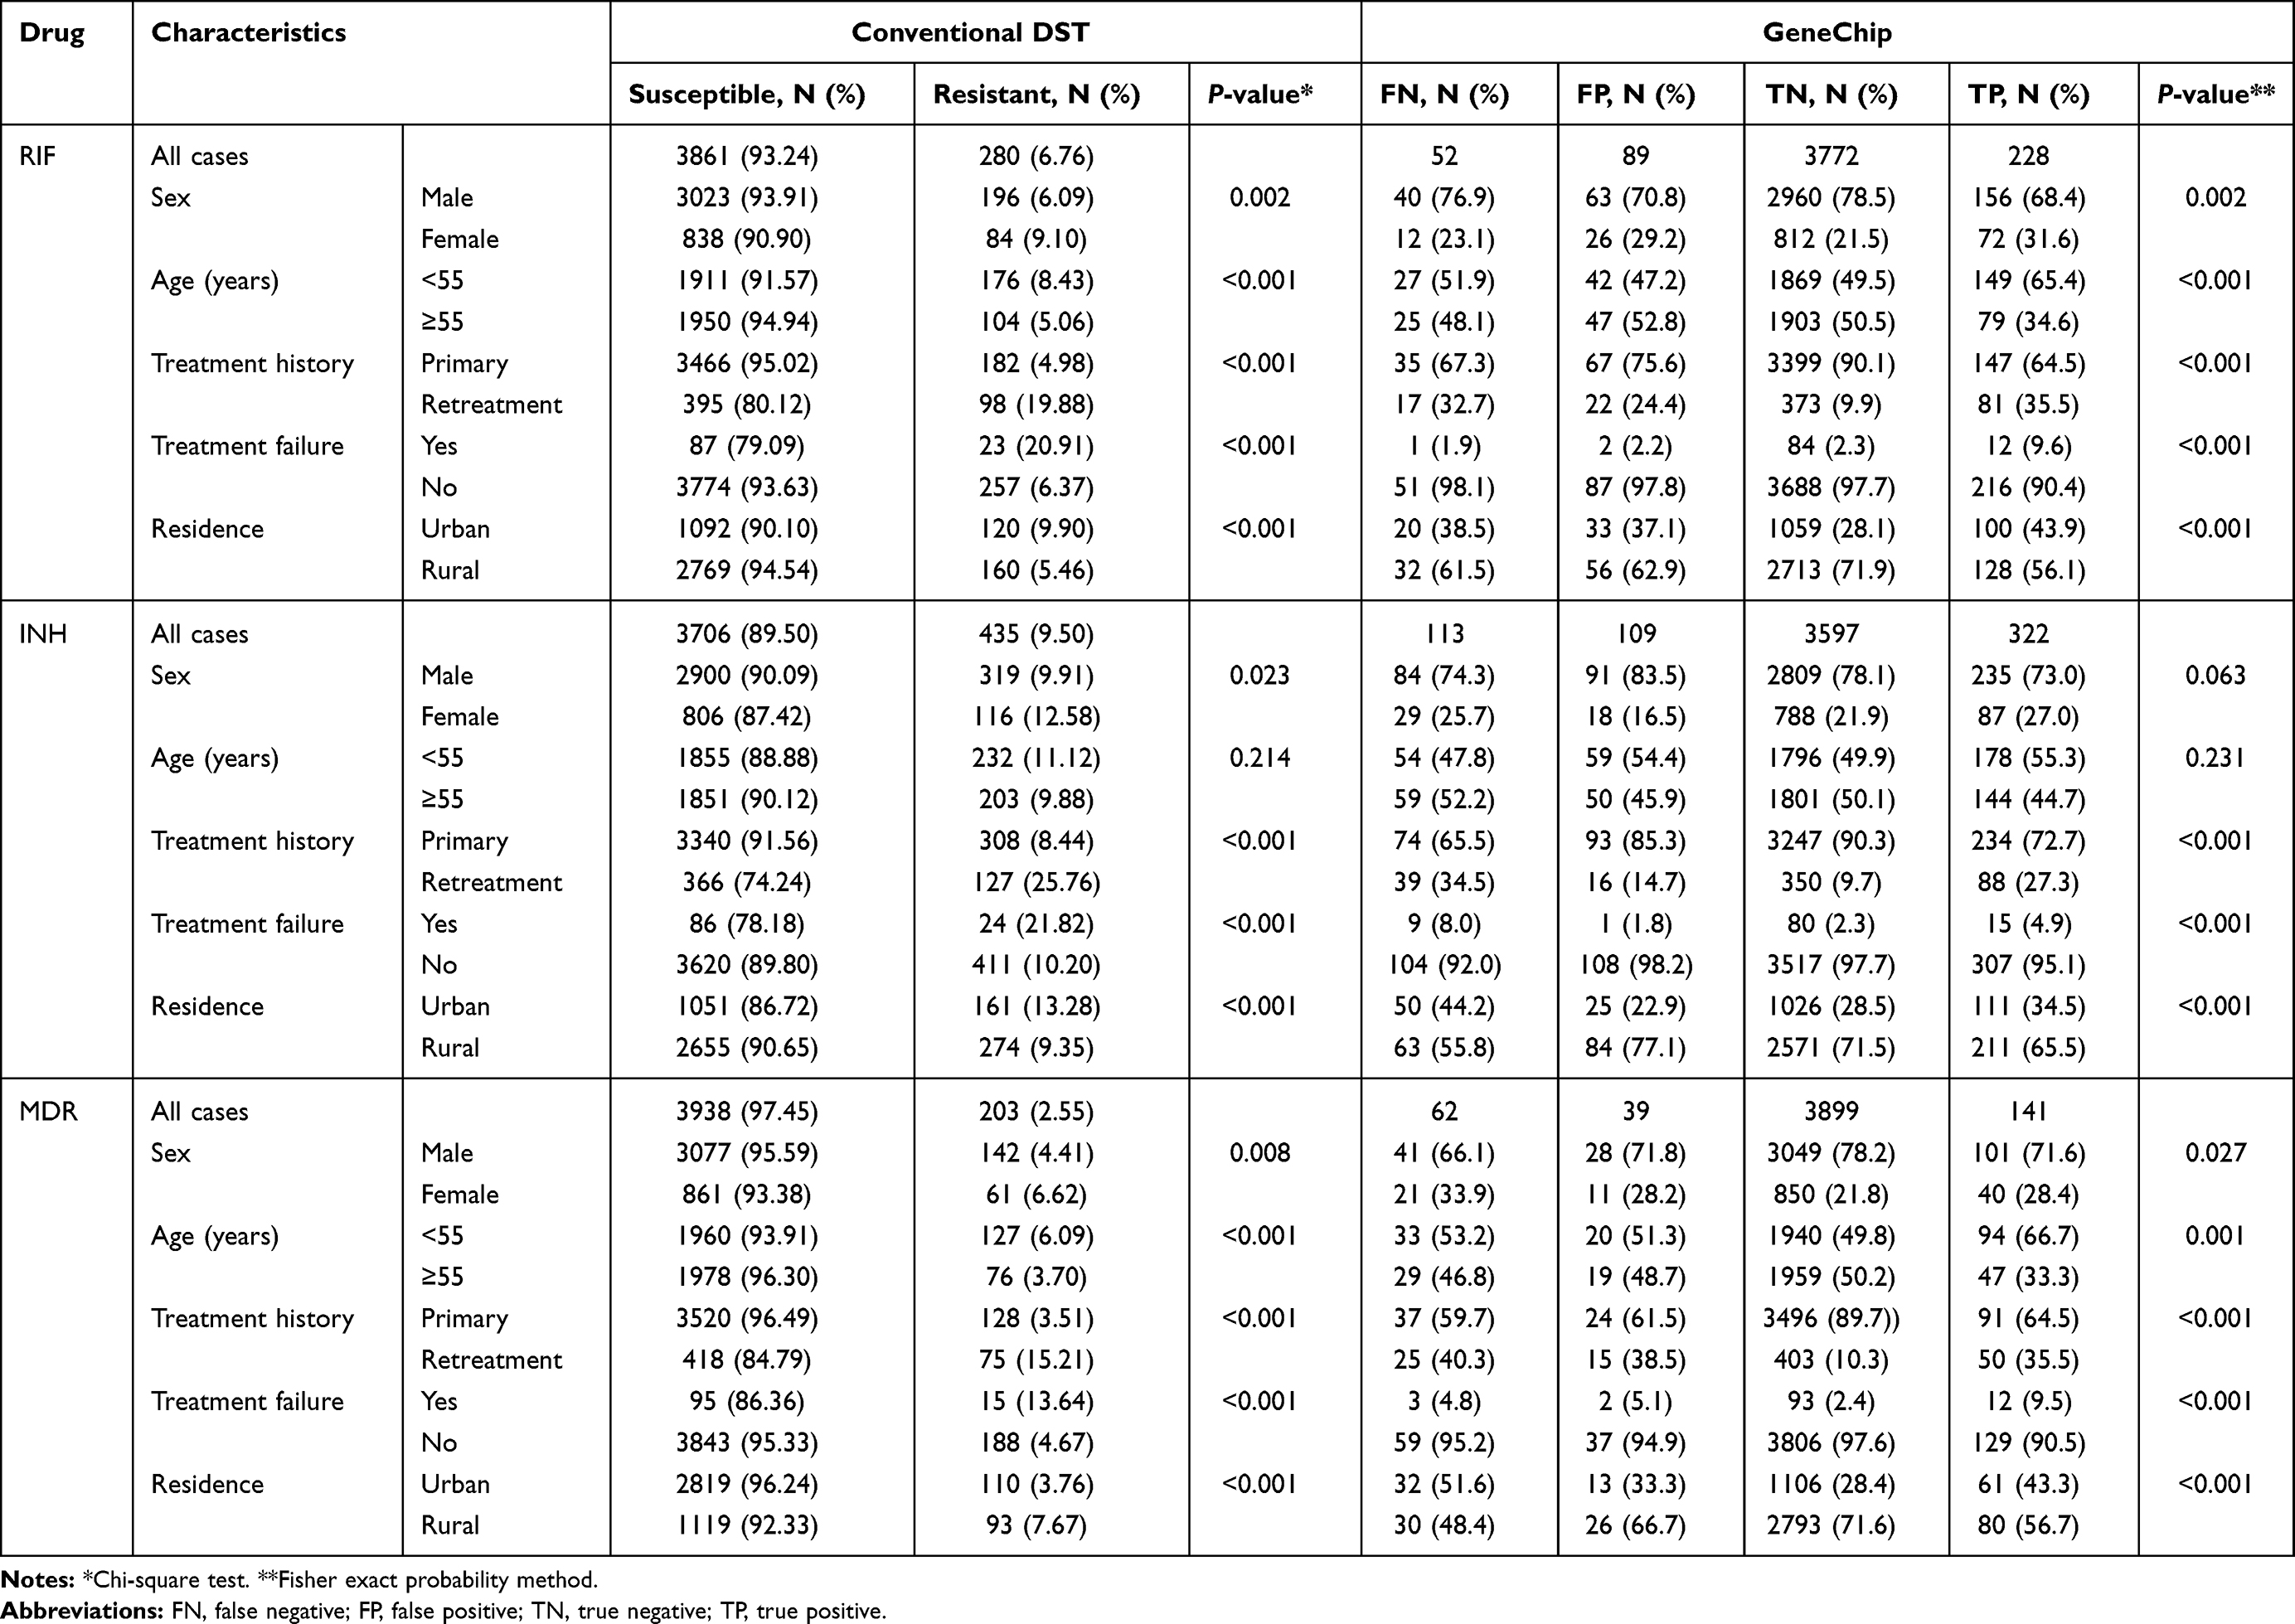 |
Table 1 Findings from the GeneChip and Traditional DST Stratified by Subgroup Patients |
CART Analysis for the Performance of GeneChip
We used the CART to determine the most “important” variables affecting the diagnostic value of GeneChip. CART is a powerful and popular predictive machine learning technique that is used for both classification and regression. A response class is predicted in each terminal node of the tree (or each rectangular section in the partition) from all observations in this node, either the average response value in regression or the most frequent response class in classification trees.19 In the terminal nodes of the tree, the scale of the bar chart represents the relative probability of “false negative (FN)”, “false positive (FP)”, “true negative (TN)” and “true positive (TP)” responses to the performance of GeneChip in differing combinations of characteristics in TB cases.
Five variables that were significant in the diagnosis of RIF resistance were evaluated in the CART analysis (Figure 2). Among previously treated cases, the age group was selected as the variable of second splitting discrimination. For cases aged <55 years, the next best predictor of the performance of GeneChip was the place of residence. For cases aged ≥55 years and living in urban areas, the next best predictor of the performance of GeneChip was sex. Among newly treated cases, the place of residence was assigned as second splitting discrimination. When the residence was rural, the next best predictor of the performance of GeneChip was treatment failure. For the node with new, rural, and successfully treated cases, the age group was selected as an additional significant variable. Therefore, a total of nine subgroups of cases were produced by five predictive variables selected in this CART analysis of GeneChip for the diagnosis of RIF resistance.
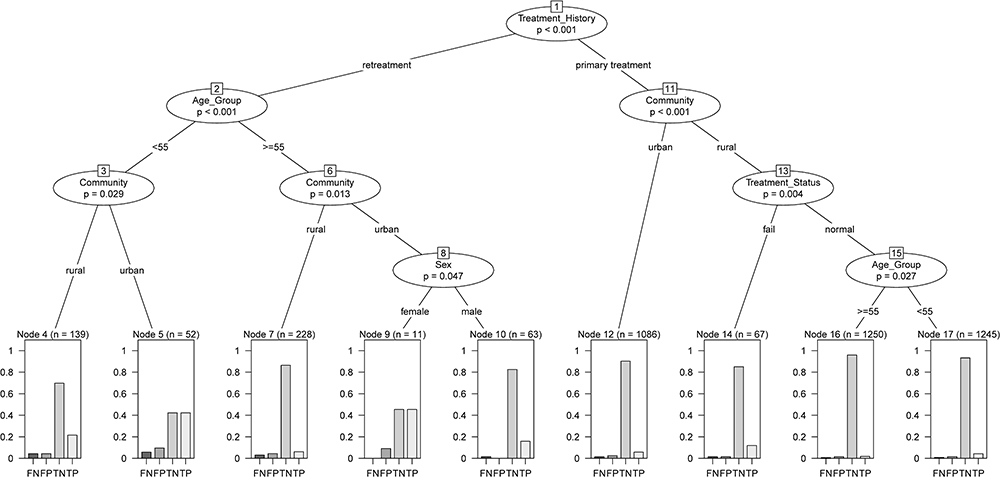 |
Figure 2 CART analysis of GeneChip performance in the diagnosis of rifampin resistance. Abbreviations: CART, Classification and Regression Trees; FN, false negative; FP, false positive; TN, true negative; TP, true positive. |
Three variables that were significant in INH resistance were evaluated in the CART analysis (Figure 3). Among previously treated cases, residence was selected as the variable of the second split for discrimination. Additionally, among newly treated cases, the place of residence was assigned as the variable of second splitting discrimination. Four subgroups of cases were produced by two predictive variables selected in this CART analysis of GeneChip for the diagnosis of INH resistance.
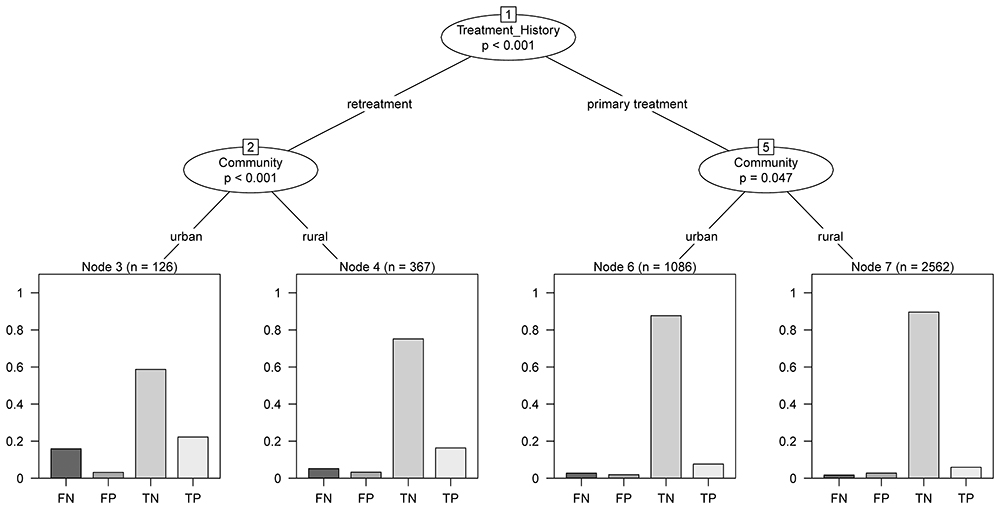 |
Figure 3 CART analysis of GeneChip performance in the diagnosis of isoniazid resistance. Abbreviations: CART, Classification and Regression Trees; FN, false negative; FP, false positive; TN, true negative; TP, true positive. |
Five variables that were significant in the MDR diagnosis were evaluated in the CART analysis (Figure 4). Among previously treated cases, age group and sex were selected as the variables of second and third splitting discrimination, respectively. For newly treated cases, the place of residence was selected as the variable of second splitting discrimination. Finally, six subgroups of cases were produced by four predictive variables selected in this CART analysis of GeneChip for the diagnosis of MDR.
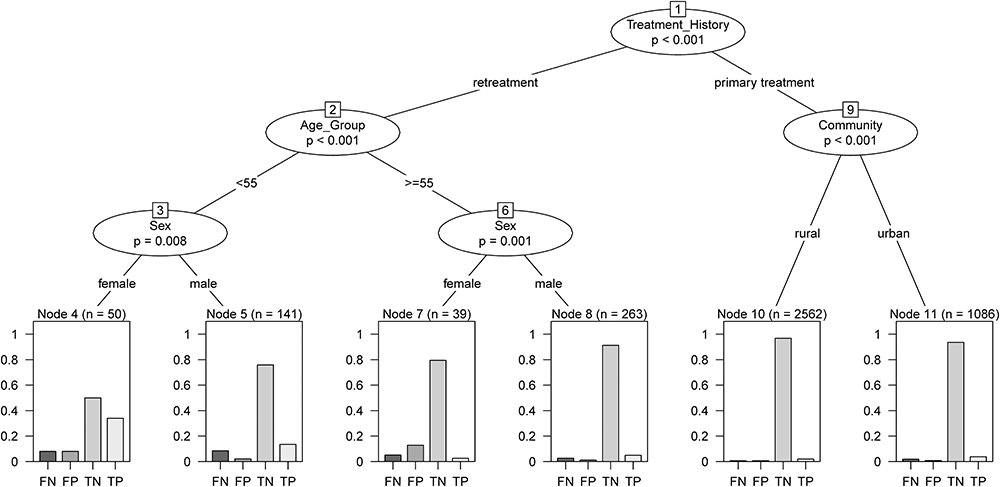 |
Figure 4 CART analysis of GeneChip performance in the diagnosis of MDR. Abbreviations: CART, Classification and Regression Trees; FN, false negative; FP, false positive; TN, true negative; TP, true positive. |
Diagnostic Performance of GeneChip in Subgroup Patients
For RIF resistance, the overall sensitivity, specificity, PPV, NPV, AR and kappa values were 0.81 (95% CI: 0.76–0.86), 0.98 (95% CI: 0.97–0.98), 0.72 (95% CI: 0.67–0.77), 0.99 (95% CI: 0.98–0.99), 0.97 (95% CI: 0.96–0.97) and 0.75 (95% CI: 0.70–0.79), respectively (Table 2). The PPV (younger cases: 0.78, 95% CI: 0.71–0.84 vs older cases: 0.63, 95% CI: 0.54–0.71; treatment failure cases: 0.92, 95% CI: 0.73–0.99 vs cases without treatment failure: 0.70, 95% CI: 0.65–0.75) and kappa (younger cases: 0.79, 95% CI: 0.75–0.84 vs older cases: 0.67, 95% CI: 0.59–0.74; treatment failure cases: 0.92, 95% CI: 0.83–1.00 vs cases without treatment failure: 0.73, 95% CI: 0.69–0.77) of GeneChip were significantly higher in younger and treatment failure cases. Newly treated cases had significantly higher specificity (newly treated cases: 0.98, 95% CI: 0.97–0.98 vs previously treated cases: 0.94, 95% CI: 0.92–0.96), NPV (newly treated cases: 0.99, 95% CI: 0.98–0.99 vs previously treated cases: 0.96, 95% CI: 0.93–0.97), and AR (newly treated cases: 0.97, 95% CI: 0.97–0.98 vs previously treated cases: 0.92, 95% CI: 0.89–0.94). No significant difference between subgroups was observed for sex or place of residence (Table 2).
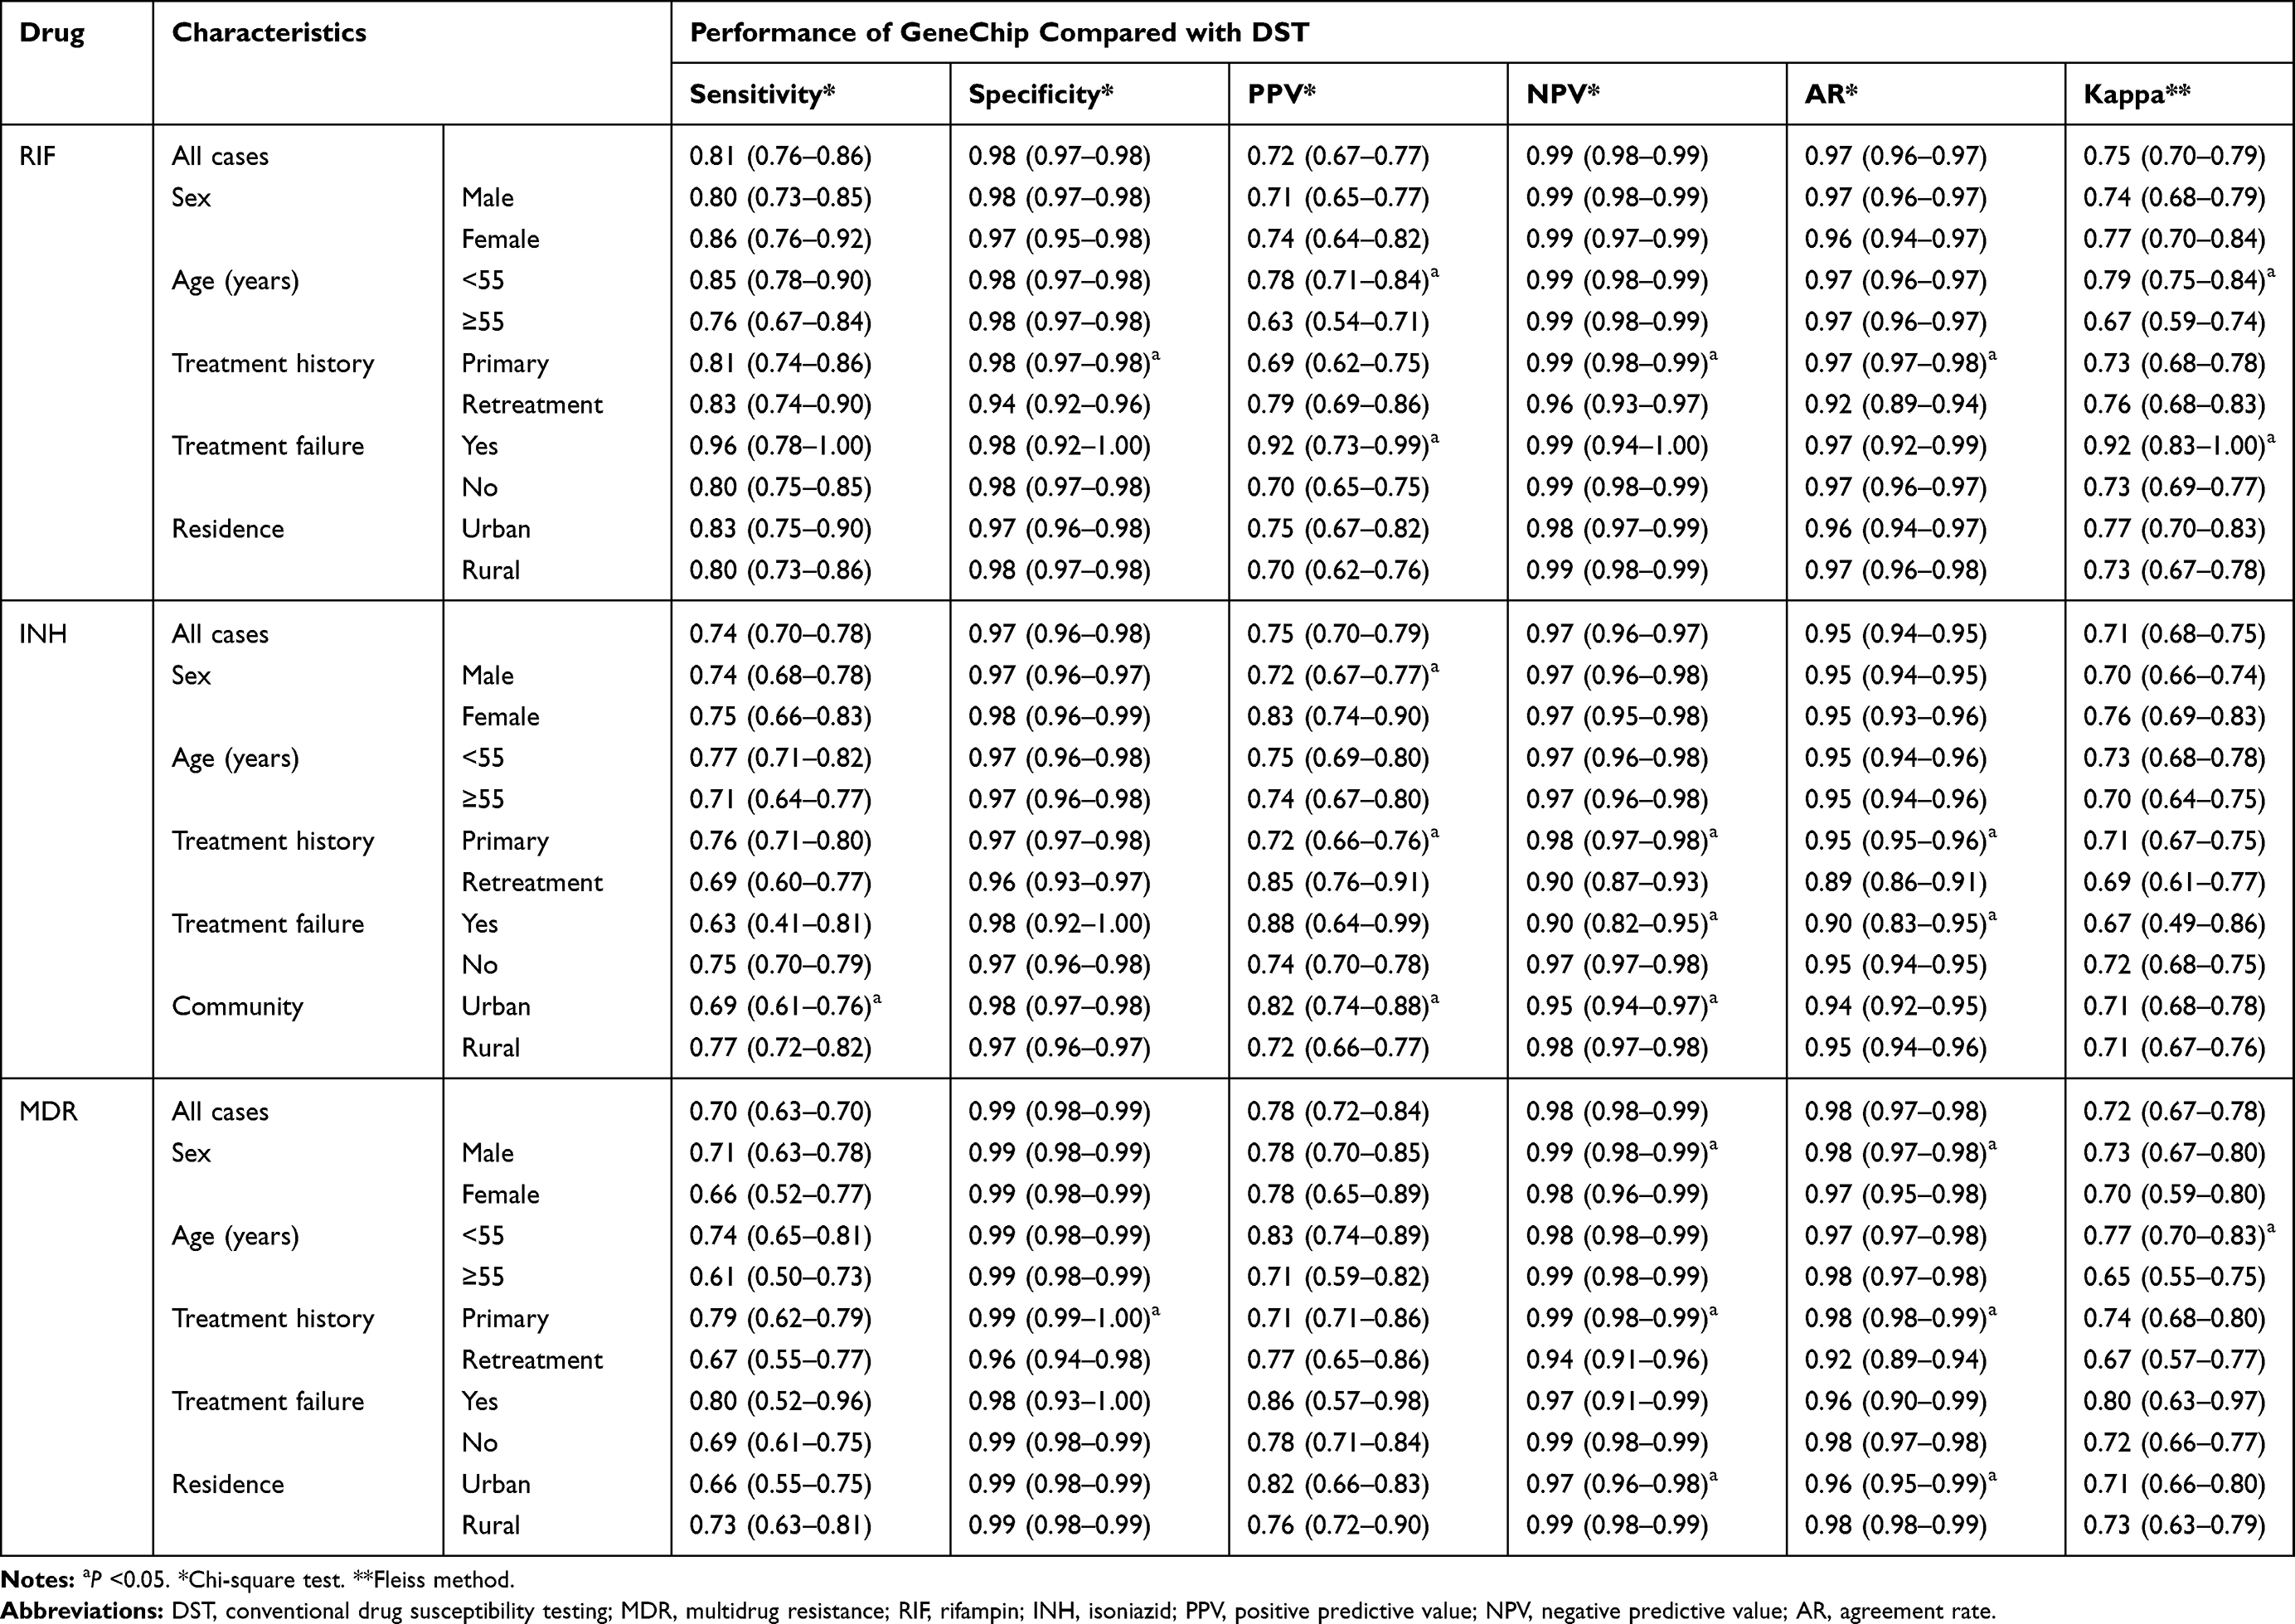 |
Table 2 Performance Evaluation of GeneChip for Rifampin and Isoniazid Resistance in Tuberculosis Cases with Different Characteristics |
For INH resistance, the overall sensitivity, specificity, PPV, NPV, AR and kappa were 0.74 (95% CI: 0.70–0.78), 0.97 (95% CI: 0.96–0.98), 0.75 (95% CI: 0.70–0.79), 0.97 (95% CI: 0.96–0.97), 0.95 (95% CI: 0.94–0.95) and 0.71 (95% CI: 0.68–0.75), respectively. Newly treated cases had significantly higher NPV (newly treated cases: 0.98, 95% CI: 0.97–0.98 vs previously treated cases: 0.90, 95% CI: 0.87–0.93) and AR (newly treated cases: 0.95, 95% CI: 0.95–0.96 vs previously treated cases: 0.89, 95% CI: 0.86–0.91) and lower PPV (newly treated cases: 0.72, 95% CI: 0.66–0.76 vs previously treated cases: 0.85, 95% CI: 0.76–0.91). The NPV (treatment failure cases: 0.90, 95% CI: 0.82–0.95 vs cases without treatment failure: 0.97, 95% CI: 0.97–0.98) and AR (treatment failure cases: 0.90, 95% CI: 0.83–0.95 vs cases without treatment failure: 0.95, 95% CI: 0.94–0.95) were significantly lower among patients with treatment failure outcomes. In patients living in urban areas, the sensitivity (urban cases: 0.69, 95% CI: 0.61–0.76 vs rural cases: 0.77, 95% CI: 0.72–0.82) and NPV (urban cases: 0.95, 95% CI: 0.94–0.97 vs rural cases: 0.98, 95% CI: 0.97–0.98) were significantly lower, but the PPV (urban cases: 0.82, 95% CI: 0.74–0.88 vs rural cases: 0.72, 95% CI: 0.66–0.77) was higher (Table 2).
Diagnostic Performance of GeneChip for MDR-TB in Subgroup Patients
The overall sensitivity, specificity, PPV, NPV, AR and kappa for detecting MDR-TB were 0.70 (95% CI: 0.63–0.70), 0.99 (95% CI: 0.98–0.99), 0.78 (95% CI: 0.72–0.84), 0.98 (95% CI: 0.98–0.99), 0.98 (95% CI: 0.97–0.98) and 0.72 (95% CI: 0.67–0.78), respectively. The NPV (male cases: 0.99, 95% CI: 0.98–0.99 vs female cases: 0.98, 95% CI: 0.96–0.99; newly treated cases: 0.99, 95% CI: 0.98–0.99 vs previously treated cases: 0.94, 95% CI: 0.91–0.96) and AR (male cases: 0.98, 95% CI: 0.97–0.98 vs female cases: 0.97, 95% CI: 0.95–0.98; newly treated cases: 0.98, 95% CI: 0.98–0.99 vs previously treated cases: 0.92, 95% CI: 0.89–0.94) were significantly higher in males and newly treated cases, but a significantly lower NPV (urban cases: 0.97, 95% CI: 0.96–0.98 vs rural cases: 0.99, 95% CI: 0.98–0.99) and AR (urban cases: 0.96, 95% CI: 0.95–0.99 vs rural cases: 0.98, 95% CI: 0.98–0.99) was observed in urban patients. The specificity value (newly treated cases: 0.99, 95% CI: 0.99–1.00 vs previously treated cases: 0.96, 95% CI: 0.94–0.98) was significantly higher in newly treated cases. No significant difference was observed in the performance of GeneChip for detecting MDR between patients with different treatment outcomes (Table 2).
RIF Resistance, INH Resistance, and MDR-TB
Patients sensitive to RIF detected by GeneChip had a significantly low probability of MDR (Prob =0.008, 95% CI: 0.006–0.012, P<0.001). RIF resistance was correlated with MDR (kappa=0.636, 95% CI: 0.584–0.688, P<0.001), which was regarded as “substantial agreement”. Patients with INH resistance detected by GeneChip had a significant probability of MDR (Prob =0.360, 95% CI: 0.314–0.407, P<0.001). Patients without INH resistance detected by GeneChip had a significantly low probability of MDR (Prob =0.013, 95% CI: 0.010–0.017, P<0.001) showing “moderate agreement” (kappa =0.452, 95% CI: 0.395–0.510, P<0.001). Patients with MDR detected by GeneChip had a significantly higher probability of MDR detected by DST (Prob =0.783, 95% CI: 0.716–0.841, P<0.001) than patients without MDR (Prob =0.016, 95% CI: 0.012–0.020, P<0.001). Patients with MDR detected by GeneChip were strongly correlated with MDR (kappa =0.723, 95% CI: 0.670–0.777, P<0.001), which was regarded as “substantial agreement” (Table 3). Additionally, younger patients with MDR detected by GeneChip had a significantly higher kappa value (0.77) than older patients (0.65) (Table 2).
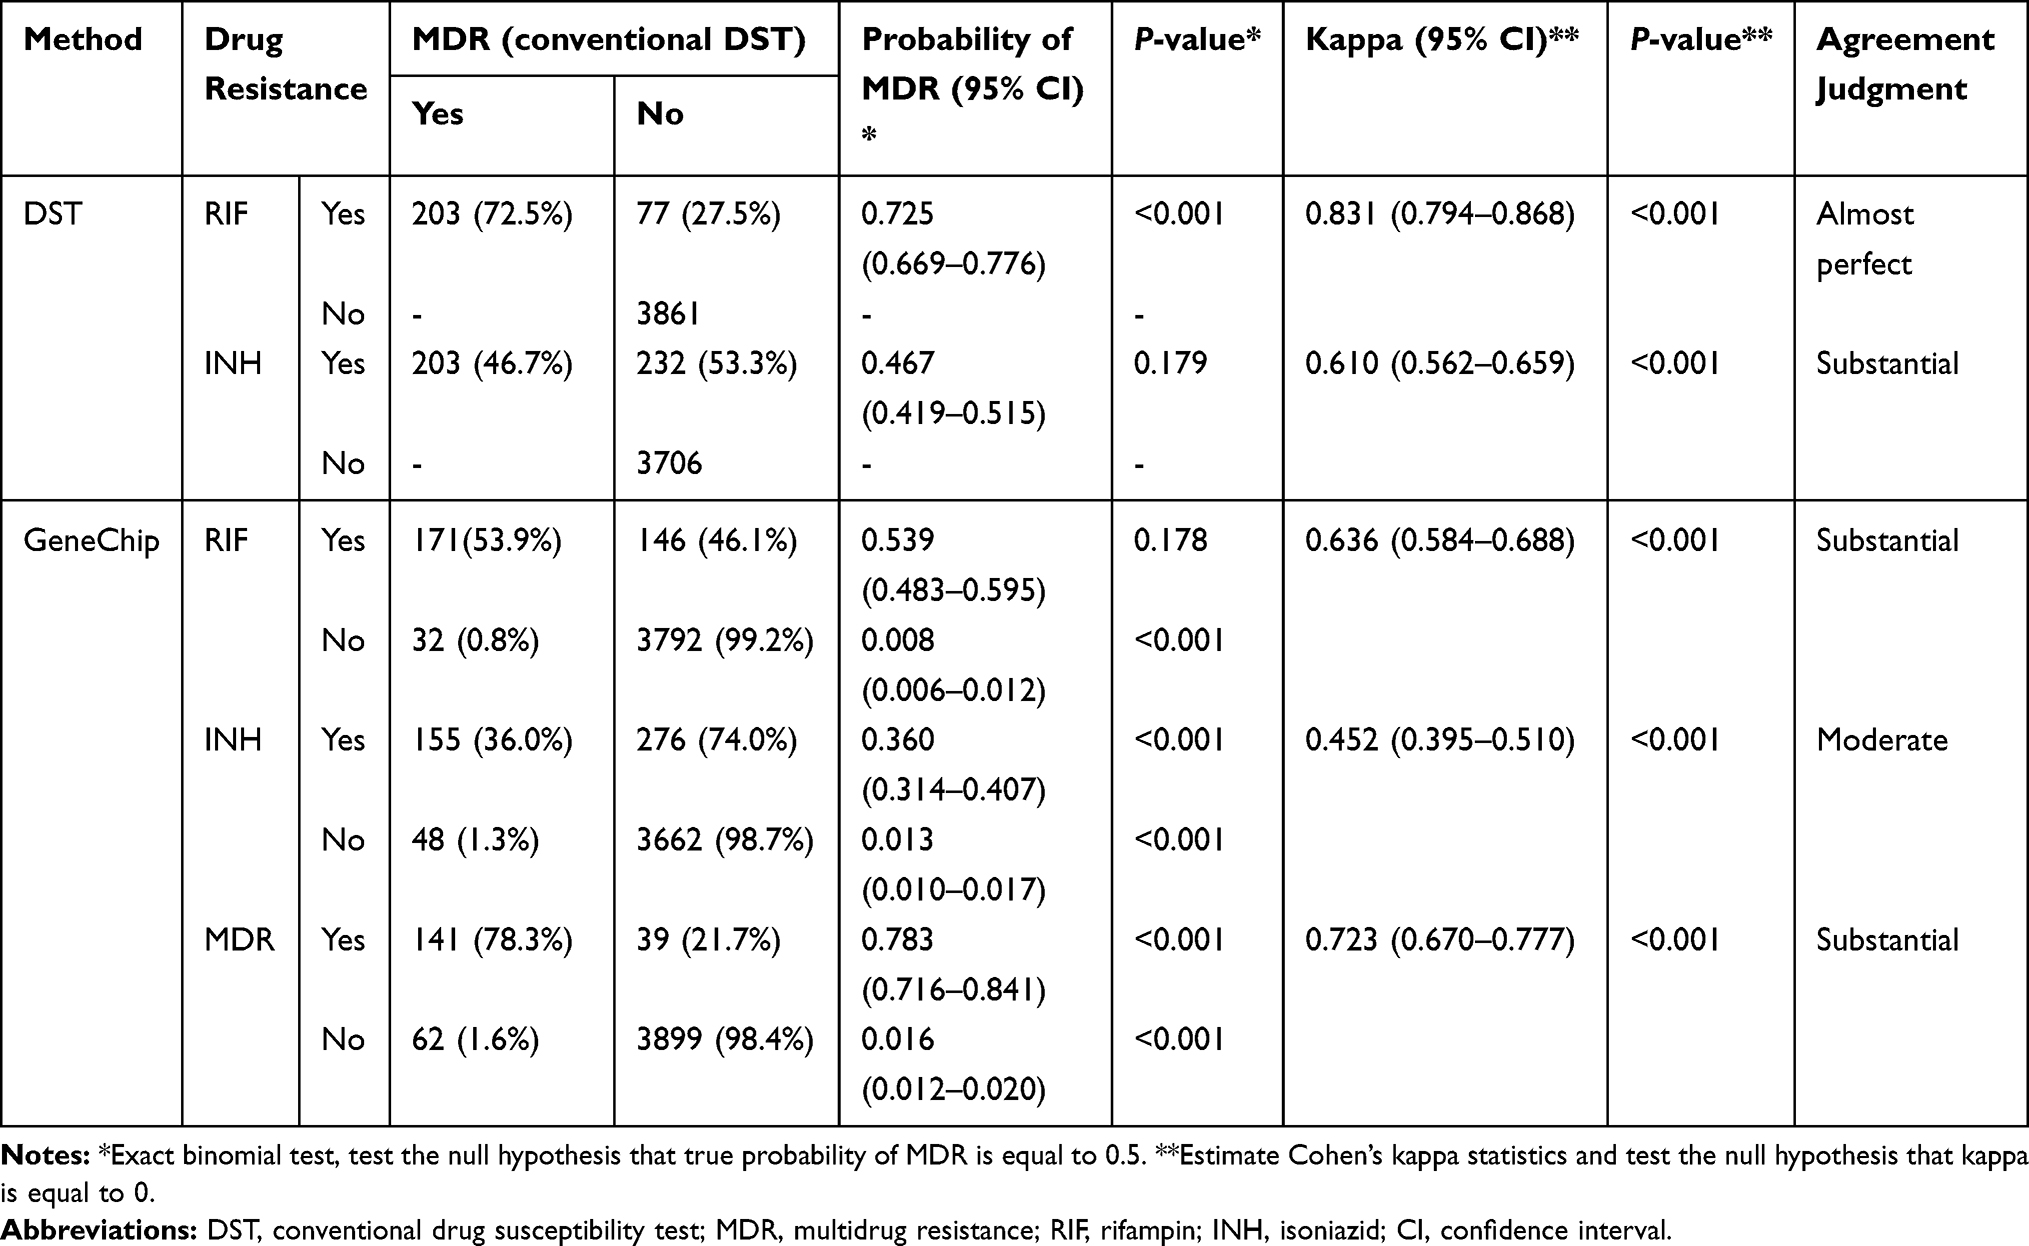 |
Table 3 Performance of GeneChip Detecting RIF Resistance, INH Resistance, and MDR Compared with DST |
Discussion
In this comparative study, we explored the diagnostic performance of GeneChip in detecting RIF resistance, INH resistance, and MDR-TB in overall and subgroup TB patients. Characteristics including sex, age, treatment history, treatment outcomes, and place of residence were found to be significantly associated with the performance of GeneChip. We also established a CART approach to identify predictors of GeneChip performance.
Globally, there were an estimated 465,000 (range: 400,000–535,000) incident cases of MDR/RIF-resistant TB (RR-TB) in 2019, and 78% of RR-TB cases were estimated to be MDR-TB. Nearly 50% of global cases were in India (27%), China (14%), and the Russian Federation (8%).1 Drug-resistant TB has shifted the schema of global TB control and has been a major public health concern. Therefore, the possibility of drug resistance should be considered. The CapitalBio DNA microarray, which incorporates specific nucleotides at given positions of the rpoB, inhA, and katG genes, has been developed to detect M.tb isolates and MDR forms in sputum specimens and proven to have notable sensitivity and specificity.16,21,22
A study in Zhejiang, China, reported that GeneChip had a sensitivity of 86.08% and a specificity of 97.70% for RIF resistance and a sensitivity of 79.36% and a specificity of 98.71% for INH resistance.23 For MDR-TB, the sensitivity was 78.01%, and the specificity was 98.86%.23 Zhu et al explored the performance of GeneChip on 1747 sputum specimens and showed a sensitivity of 83.30% and a specificity of 97.93% for RIF resistance and a sensitivity of 63.81% and a specificity of 97.57% for INH resistance.21 Another study in China reported that GeneChip performed better in newly treated cases in detecting RIF resistance, INH resistance, and MDR-TB.24 However, few studies have evaluated the performance of GeneChip in subgroups of patients with different characteristics.
Previous studies found that RIF-resistant TB was more prevalent among relapse and treatment failure cases, but had a lower frequency among older patients.25 Compared with rural areas, urban areas have a higher prevalence of MDR-TB.26,27 Therefore, the characteristics of cases should not be ignored when evaluating the performance of GeneChip.24,28 In the current study, we observed that sex, age, treatment history, treatment failure outcome, and place of residence were significantly associated with the diagnostic value of GeneChip.
Prediction, classification, and the assessment of drug resistance are fundamental tasks in TB clinical treatment management. For the classification of GeneChip performance, it is possible to predict an estimate of the class probabilities from the relative frequencies of each class in the terminal nodes of CART.19 We observed a high concordance between GeneChip and DST among TB patients with different characteristics, indicating that GeneChip can be a potential alternative tool for rapid MDR-TB detection. It may be used as an ancillary test for drug resistance for urgent clinical needs.29,30
Although MDR-TB is defined as resistance to at least RIF and INH, the critical determinant for treatment failure is RIF resistance. Detection of RIF resistance has thus been proposed as a proxy for MDR-TB diagnosis,31 especially in areas with a high burden of drug resistance.32 Areas with additional circulating drug-resistant strains should use comprehensive DST before prescribing a standard shorter-term regimen.33 The WHO recommends that TB patients with confirmed resistance to RIF can be treated as MDR until INH resistance is confirmed.34
The Xpert M.tb/RIF assay (Cepheid, Sunnyvale, CA, USA) is an automated, single-cartridge-based nucleic acid amplification test.35 It has excellent performance with lower biosafety requirements and more straightforward contamination control. However, the major drawback of real-time PCR-based methods is that the instrumentation and reagent costs at present are significantly higher than those of array-based technologies.12 Compared with Xpert, GeneChip is relatively less expensive and more cost-effective.17 Although GeneChip has a lower sensitivity than the Xpert M.tb assay, their specificities were both >0.97.16 Therefore, GeneChip still has value in clinical application, especially in areas lacking resources.
A major strength of this study is that we recruited all smear-positive TB cases in four counties and one downtown area of the study area, which guaranteed good representativeness of the samples. In addition, data were collected within ten consecutive years, and the sample size was relatively large for molecular epidemiological study. This study provided novel insight into the performance of GeneChip in differing characteristic TB cases and potentially worth expanding to clinical settings in China.
However, several limitations of this study should not be ignored. First, we did not routinely test each patient for HIV, which might affect the accurate estimation of the diagnostic value of GeneChip. Considering the low prevalence of HIV in the study area, its effect was believed to be low. Second, recall bias of the treatment history may cause misclassification of newly and previously treated cases. Third, low-level but probably clinically relevant RIF-resistant TB linked to some specific rpoB mutations, which are not covered by GeneChip, is easily missed, resulting in the risk of a false negative.30,36,37
In conclusion, GeneChip is a rapid diagnostic method that can detect drug resistance to RIF and INH among different subgroups of TB patients. We observed a high concordance between GeneChip and DST among patients with different characteristics, indicating that GeneChip can be a potential alternative tool for rapid MDR-TB detection.
Acknowledgments
This study was funded by the National Key R&D Program of China (2017YFC0907000), National Natural Science Foundation of China (81973103), and Medical Research Project of Jiangsu Health Commission (ZDB2020013). The funding agencies had no role in the study design, data collection, analysis, decision to publish, or manuscript preparation.
Author Contributions
All authors made a significant contribution to the work reported, whether that is in the conception, study design, execution, acquisition of data, analysis and interpretation, or in all these areas; took part in drafting, revising or critically reviewing the article; gave final approval of the version to be published; have agreed on the journal to which the article has been submitted; and agree to be accountable for all aspects of the work.
Disclosure
The authors report no conflicts of interest in this work.
References
1. WHO. Global Tuberculosis Report 2020. Geneva: World Health Organization; 2020.
2. Nahid P, Dorman SE, Alipanah N, et al. Official American Thoracic Society/Centers for disease control and prevention/infectious diseases Society of America clinical practice guidelines: treatment of drug-susceptible tuberculosis. Clin Infect Dis. 2016;63(7):e147–e195. doi:10.1093/cid/ciw376
3. Singh R, Dwivedi SP, Gaharwar US, Meena R, Rajamani P, Prasad T. Recent updates on drug resistance in Mycobacterium tuberculosis. J Appl Microbiol. 2020;128(6):1547–1567. doi:10.1111/jam.14478
4. Unissa AN, Subbian S, Hanna LE, Selvakumar N. Overview on mechanisms of isoniazid action and resistance in Mycobacterium tuberculosis. Infect Genet Evol. 2016;45:474–492. doi:10.1016/j.meegid.2016.09.004
5. Zhao Y, Xu S, Wang L, et al. National survey of drug-resistant tuberculosis in China. N Engl J Med. 2012;366(23):2161–2170. doi:10.1056/NEJMoa1108789
6. He GX, Wang HY, Borgdorff MW, et al. Multidrug-resistant tuberculosis, People’s Republic of China, 2007–2009. Emerg Infect Dis. 2011;17(10):1831–1838. doi:10.3201/eid1710.110546
7. Lawn SD. Advances in diagnostic assays for tuberculosis. Cold Spring Harb Perspect Med. 2015;5(12):a017806. doi:10.1101/cshperspect.a017806
8. WHO. Technical Report on Critical Concentrations for Drug Susceptibility Testing of Medicines Used in the Treatment of Drug-Resistant Tuberculosis. Geneva: World Health Organization; 2018.
9. Boehme CC, Nicol MP, Nabeta P, et al. Feasibility, diagnostic accuracy, and effectiveness of decentralised use of the Xpert MTB/RIF test for diagnosis of tuberculosis and multidrug resistance: a multicentre implementation study. Lancet. 2011;377(9776):1495–1505. doi:10.1016/S0140-6736(11)60438-8
10. Shah M, Chihota V, Coetzee G, Churchyard G, Dorman SE. Comparison of laboratory costs of rapid molecular tests and conventional diagnostics for detection of tuberculosis and drug-resistant tuberculosis in South Africa. BMC Infect Dis. 2013;13(1):352. doi:10.1186/1471-2334-13-352
11. Miller BS, Gliddon HD, McKendry RA. Towards a future of rapid, low-cost, multiplexed detection of antimicrobial resistance markers for tuberculosis and other pathogens. Clin Chem. 2019;65(3):367–369. doi:10.1373/clinchem.2018.296715
12. Saravanan M, Niguse S, Abdulkader M, et al. Review on emergence of drug-resistant tuberculosis (MDR & XDR-TB) and its molecular diagnosis in Ethiopia. Microb Pathog. 2018;117:237–242. doi:10.1016/j.micpath.2018.02.047
13. Zhou W, Sun J, Li X. Low-cost quantitative photothermal genetic detection of pathogens on a paper hybrid device using a thermometer. Anal Chem. 2020;92(21):14830–14837. doi:10.1021/acs.analchem.0c03700
14. Guo Y, Zhou Y, Wang C, et al. Rapid, accurate determination of multidrug resistance in M. tuberculosis isolates and sputum using a biochip system. Int J Tuberc Lung Dis. 2009;13(7):914–920.
15. Zhang Z, Li L, Luo F, et al. Rapid and accurate detection of RMP- and INH- resistant mycobacterium tuberculosis in spinal tuberculosis specimens by capitalBio DNA microarray: a prospective validation study. BMC Infect Dis. 2012;12(1):303. doi:10.1186/1471-2334-12-303
16. Sun Y, Gao L, Xia H, et al. Accuracy of molecular diagnostic tests for drug-resistant tuberculosis detection in China: a systematic review. Int J Tuberc Lung Dis. 2019;23(8):931–942. doi:10.5588/ijtld.18.0550
17. Pang Y, Li Q, Ou X, et al. Cost-effectiveness comparison of Genechip and conventional drug susceptibility test for detecting multidrug-resistant tuberculosis in China. PLoS One. 2013;8(7):e69267. doi:10.1371/journal.pone.0069267
18. Zhu L, Jiang G, Wang S, et al. Biochip system for rapid and accurate identification of mycobacterial species from isolates and sputum. J Clin Microbiol. 2010;48(10):3654–3660. doi:10.1128/JCM.00158-10
19. Strobl C, Malley J, Tutz G. An introduction to recursive partitioning: rationale, application, and characteristics of classification and regression trees, bagging, and random forests. Psychol Methods. 2009;14(4):323–348. doi:10.1037/a0016973
20. Vanbelle S. A new interpretation of the weighted kappa coefficients. Psychometrika. 2016;81(2):399–410. doi:10.1007/s11336-014-9439-4
21. Zhu L, Zuo LL, Zhou LT, et al. The analysis of drug-resistant gene mutations of mycobacterium tuberculosis by GeneChip in lianyungang, China. Clin Lab. 2020;66(01+02/2020):65–72. doi:10.7754/Clin.Lab.2019.190526
22. Pang Y, Xia H, Zhang Z, et al. Multicenter evaluation of genechip for detection of multidrug-resistant mycobacterium tuberculosis. J Clin Microbiol. 2013;51(6):1707–1713. doi:10.1128/JCM.03436-12
23. Xu K, Wang S, Wu J, et al. Performance of biochip system in detecting drug resistant and multidrug-resistant tuberculosis using sputum collected from multiple clinical settings in Zhejiang, China. Sci Rep. 2018;8(1):10587. doi:10.1038/s41598-018-28955-0
24. Zhu L, Liu Q, Martinez L, et al. Diagnostic value of GeneChip for detection of resistant mycobacterium tuberculosis in patients with differing treatment histories. J Clin Microbiol. 2015;53(1):131–135. doi:10.1128/JCM.02283-14
25. Wasihun AG, Dejene TA, Hailu GG. Frequency of MTB and rifampicin resistance MTB using Xpert-MTB/RIF assay among adult presumptive tuberculosis patients in Tigray, Northern Ethiopia: a cross sectional study. PLoS One. 2020;15(11):e0240361. doi:10.1371/journal.pone.0240361
26. Almeida D, Rodrigues C, Udwadia ZF, et al. Incidence of multidrug-resistant tuberculosis in urban and rural India and implications for prevention. Clin Infect Dis. 2003;36(12):e152–154. doi:10.1086/374931
27. Wang W, Wang J, Zhao Q, et al. Contribution of rural-to-urban migration in the prevalence of drug resistant tuberculosis in China. Eur J Clin Microbiol Infect Dis. 2011;30(4):581–586. doi:10.1007/s10096-010-1125-6
28. Pang Y, Ruan YZ, Zhao J, et al. Diagnostic dilemma: treatment outcomes of tuberculosis patients with inconsistent rifampicin susceptibility. Int J Tuberc Lung Dis. 2014;18(3):357–362. doi:10.5588/ijtld.13.0459
29. Cui ZL, Hu ZY, Wang J, Zhang YR, Chen HP, Weng XH. [Comparison of four methods in the detection of isoniazid resistance in clinical isolates of mycobacterium tuberculosis]. Zhonghua Jie He He Hu Xi Za Zhi. 2005;28(4):245–249. Chinese.
30. Van Deun A, Barrera L, Bastian I, et al. Mycobacterium tuberculosis strains with highly discordant rifampin susceptibility test results. J Clin Microbiol. 2009;47(11):3501–3506. doi:10.1128/JCM.01209-09
31. Traore H, Fissette K, Bastian I, Devleeschouwer M, Portaels F. Detection of rifampicin resistance in Mycobacterium tuberculosis isolates from diverse countries by a commercial line probe assay as an initial indicator of multidrug resistance. Int J Tuberc Lung Dis. 2000;4(5):481–484.
32. WHO. Anti-Tuberculosis Drug Resistance in the World: Fourth Global Report./The WHO/IUATLD Global Project on Anti-Tuberculosis Drug Resistance Surveillance, 2002–2007. Geneva: World Health Organization; 2008.
33. Tornheim JA, Udwadia ZF, Gupta A, Shorter A. Regimen for rifampin-resistant tuberculosis. N Engl J Med. 2019;381(11):e22. doi:10.1056/NEJMc1905782
34. Weyer K, Mirzayev F, Migliori GB, et al. Rapid molecular TB diagnosis: evidence, policy making and global implementation of Xpert MTB/RIF. Eur Respir J. 2013;42(1):252–271. doi:10.1183/09031936.00157212
35. El-Hajj HH, Marras SA, Tyagi S, Kramer FR, Alland D. Detection of rifampin resistance in mycobacterium tuberculosis in a single tube with molecular beacons. J Clin Microbiol. 2001;39(11):4131–4137. doi:10.1128/JCM.39.11.4131-4137.2001
36. Rigouts L, Gumusboga M, de Rijk WB, et al. Rifampin resistance missed in automated liquid culture system for mycobacterium tuberculosis isolates with specific rpoB mutations. J Clin Microbiol. 2013;51(8):2641–2645. doi:10.1128/JCM.02741-12
37. Van Deun A, Aung KJ, Bola V, et al. Rifampin drug resistance tests for tuberculosis: challenging the gold standard. J Clin Microbiol. 2013;51(8):2633–2640. doi:10.1128/JCM.00553-13
 © 2021 The Author(s). This work is published and licensed by Dove Medical Press Limited. The full terms of this license are available at https://www.dovepress.com/terms.php and incorporate the Creative Commons Attribution - Non Commercial (unported, v3.0) License.
By accessing the work you hereby accept the Terms. Non-commercial uses of the work are permitted without any further permission from Dove Medical Press Limited, provided the work is properly attributed. For permission for commercial use of this work, please see paragraphs 4.2 and 5 of our Terms.
© 2021 The Author(s). This work is published and licensed by Dove Medical Press Limited. The full terms of this license are available at https://www.dovepress.com/terms.php and incorporate the Creative Commons Attribution - Non Commercial (unported, v3.0) License.
By accessing the work you hereby accept the Terms. Non-commercial uses of the work are permitted without any further permission from Dove Medical Press Limited, provided the work is properly attributed. For permission for commercial use of this work, please see paragraphs 4.2 and 5 of our Terms.