")
Back to Journals » Cancer Management and Research » Volume 13
Diagnostic and Predictive Values of Strain Ratios in the Regions of Interests in Reference Tissue for Breast Tumor
Authors Wang H, Li CY, Zha HL, Xu D , Hu ZB
Received 24 November 2020
Accepted for publication 8 January 2021
Published 4 February 2021 Volume 2021:13 Pages 1017—1028
DOI https://doi.org/10.2147/CMAR.S292944
Checked for plagiarism Yes
Review by Single anonymous peer review
Peer reviewer comments 2
Editor who approved publication: Dr Ahmet Emre Eşkazan
Hui Wang,1,* Cui-Ying Li,1,* Hai-Ling Zha,1 Di Xu,1 Zhi-Bin Hu2
1Department of Ultrasound, The First Affiliated Hospital of Nanjing Medical University, Nanjing, 210029, People’s Republic of China; 2Department of Epidemiology, Center for Global Health, School of Public Health, Nanjing Medical University, Nanjing, 211166, People’s Republic of China
*These authors contributed equally to this work
Correspondence: Zhi-Bin Hu
Department of Epidemiology, Center for Global Health, School of Public Health, Nanjing Medical University, No. 101 Longmian Avenue, Jiangning District, Nanjing, 211166, Jiangsu, People’s Republic of China
Tel +86-25-86868437
Email [email protected]
Di Xu
Department of Ultrasound, The First Affiliated Hospital of Nanjing Medical University, 300 Guangzhou Road, Nanjing, 210029, Jiangsu, People’s Republic of China
Tel +86-25-83714511
Email [email protected]
Purpose: To investigate the diagnostic and predictive value of strain ratios in the regions of interests (ROIs) in reference tissue for breast tumor.
Patients and Methods: A total of 707 lesions in 665 consecutive patients were examined with B-mode Breast Imaging-Reporting and Data System (BI-RADS) and Ultrasonic elastography (UE). Elasticity score (ES) and strain ratio (SR) in each lesion were calculated. Receiver operating characteristic (ROC) curves were used to assess the diagnostic value of BI-RADS, ES, SR1, SR2, BI-RADS combined with ES (BI-RADS+ES), BI-RADS combined with SR1 (BI-RADS+SR1), and BI-RADS combined with SR2 (BI-RADS+SR2). The sensitivity, specificity, and areas under the ROC curves (Az) were obtained. Scatter plots were generated to demonstrate the correlation between SR1 and SR2. Kruskal-Walls H-test, Mann–Whitney U-test and one-way ANOVA were performed to evaluate SRs and tumor-related variables. Multiple linear regression analysis was carried out to determine variables independently associated with SRs.
Results: BI-RADS had high sensitivity and low specificity in the diagnosis of breast tumor. The specificity of BI-BADS combined with ES or SR was even higher. The Az value of BI-RADS+ES or BI-RADS+SRs was higher than that of BI-RADS (P < 0.001). The Az value of ES was higher than those of SR1 and SR2 (P < 0.001), and those of SR1 and SR2 were similar. SR1 and SR2 were highly positively correlated. There was no statistical difference between Az values of BI-RADS+ES, BI-RADS+SR1, and BI-RADS+SR2. Indistinct margin, high histologic grade, histological type, and negative human epidermal growth factor receptor (Her-2) were associated with SR1 and SR2. Progesterone receptor (PR) status and molecular subtype were associated with SR2. Histologic grade and tumor margin were significantly associated with SR1, and tumor margin was associated with SR2.
Conclusion: SRs in different ROIs in the reference tissue at the same depth showed no different diagnostic value for breast tumor. Both SR1 and SR2 could be useful in assessing the biological characteristics of invasive breast carcinoma.
Keywords: conventional ultrasonography, Breast Imaging-Reporting and Data System, ultrasonic elastography, elasticity score, strain ratio
Introduction
In women, breast cancer is the commonest malignancy and a leading cause of cancer-related death worldwide.1 Current breast-imaging tools, such as ultrasound (US), mammography, and magnetic resonance imaging, are sensitive but not specific enough, leading to unnecessary close monitoring and biopsy.2–4 Clinically, palpation of the breast is a useful method in differentiating benign from malignant lesions.5 Malignant breast lesions are usually stiffer than benign masses.6 However, diagnosis through manual palpation is subjective and unstandardized. Ultrasound elastography was introduced into breast imaging in 2003 to characterize the tissue stiffness in breast lesions.7,8
In strain elastography, which is commonly used in current US examination, the lesion is deformed with an external force from the patient’s movements (like breathing, heartbeat), or rhythmic compression of US transducer.3 Strain elastography displays a color overlaid on the B-mode ultrasound (US), with red/green/blue used to represent the degree of stiffness.9 Strain elastography provides qualitative and semi-quantitative results, which reflect the stiffness of the lesions. Qualitative analysis is subjective and lacks consistency, so semi-quantitative measurement, such as the SR, is introduced to reach consistency between examiners.10,11 The SR is calculated through dividing the mean strain of the reference tissue by the mean strain within the breast lesion. Normal breast tissue, either glandular tissue or fatty tissue, has served as the reference in some studies.12–14 In 2008, Zhi et al15 found that the strain ratios derived from the reference tissue at the same depth showed no difference in the diagnosis of breast masses. However, we found that the ROIs of different sizes in the reference tissue at the same depth yielded different breast SRs. Our study aimed to 1) investigate the value of SRs derived from different ROIs in distinguishing malignant tumors and benign ones, and 2) assess the association between SRs and diagnostic factors in invasive breast cancer.
Patients and Methods
Materials
This study was approved by the ethics committee of the First Affiliated Hospital of Nanjing Medical University (Nanjing, China). Informed consent was waived since this was a retrospective study. The study protocol observed to the ethical guidelines of the Declaration of Helsinki. From January 2018 to June 2019, we analyzed 62,997 breast lesions from 62,597 consecutive patients. The inclusion criteria for breast lesions were as follows: 1) solid breast lesions with a diameter ≤25mm; 2) pathological findings; 3) complete imaging. The exclusion criteria were as follows: 1) simple cystic lesions; 2) lesions with a diameter >25 mm; 3) no pathological findings; 4) incomplete images or information; 5) lesions from patients under neoadjuvant chemotherapy; 6) unclear lesion edges with posterior acoustic shadow. Finally, 707 lesions from 655 patients were included (Figure 1).
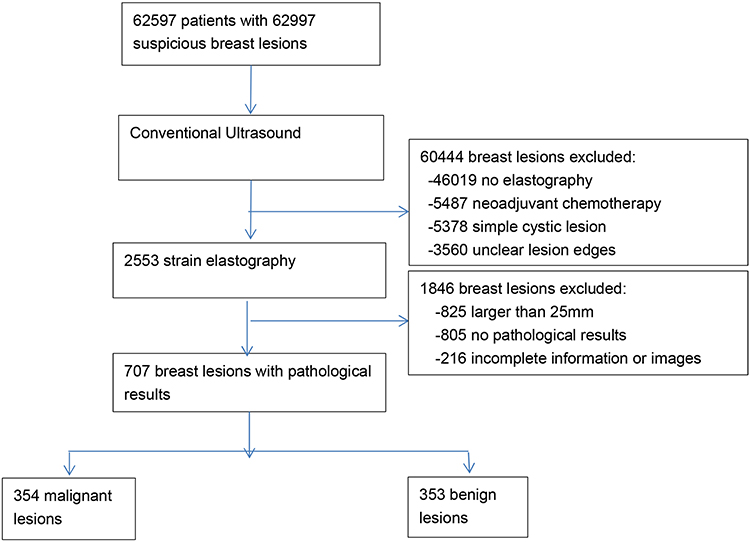 |
Figure 1 Study flow diagram. |
Image Acquisition
All patients underwent CUS and UE with a high-frequency linear transducer (LA523, 4–13MHz) connected to an ultrasound system (MyLab Twice, Esaote, Italy), which is developed with elastic imaging Q-Elaxto technology. The patients were placed in a supine position to fully expose their breasts and armpits. Real-time elastography was performed by manual compression after B-mode sonographic examinations. In scanning, the transducer was positioned perpendicular to the skin, with light pressure monitored according to compression frequency (range, 3–4), an indicator displayed on the screen. A rectangular region of interest (ROI) box was placed at a site more than twice as large as a solid mass, to ensure that it had covered the subcutaneous fat layer and the greater pectoral muscle. The strain was displayed with an elastographic map of 256 colors, from green (greatest strain; softest) to blue (average strain; intermediate) to red (no strain; hardest). Conventional and elastographic US images were acquired by two radiologists with more than 15 years of experience in CUS and UE of breast.
Image Analysis
The Breast Imaging-Reporting and Data System (BI-RADS)-US was used to evaluate each nodule on conventional US and Doppler images.16 The following parameters were recorded: tumor size (the long axis), shape (oval, round, and irregular; oval and round considered as regular), margin (circumscribed and not circumscribed; indistinct, angular, microlobulated, and spiculated considered as not circumscribed), posterior acoustic feature (no posterior features, enhancement, and attenuation), and growth orientation (the relationship of the mass with the skin). Doppler images were categorized into four classes (0, I, II, and III) according to the Adler semi-quantitative blood-flow classification.17
According to the methods of Itoh et al,18 qualitative elastographic images were scored: 1, an even strain in the entire lesion; 2, strain in most of the lesion; 3, strain at the periphery out of the center; 4, the entire lesion was stiff; 5, the entire lesion and surrounding tissue were stiff. Elasticity scores of 1 to 3 were classified as benign, while scores 4 and 5 as malignant.
For semi-quantitative evaluation, SR was used to describe the ratio of glandular tissue elasticity to lesion elasticity, and was evaluated through a Picture Archiving and Communication System by two radiologists with more than 15 years of experience. In some studies, normal fatty tissue was taken as the reference tissue.11 However, the layer of breast fat in East Asian women is comparatively thin.19 So, glandular tissue was taken as the reference tissue in our study. The ROIs were drawn automatically in regular lesions and manually in irregular ones. The first ROI (A) was drawn along the margin of the lesion, and the strain in ROI (A) was measured as the strain of this lesion. Similarly, the second ROI (B) and third ROI (C) were selected at the normal glandular tissue, which reflected the strain of glandular tissue. However, the areas of the ROI (B) and ROI (C) were different. The second ROI (B) was small (≤3.1 mm2), and the third ROI (C) was as large as the first ROI (A). Three ROIs at the same depth in the same color map were chosen. Then the SR was calculated twice automatically. SR1 was calculated as B/A, and SR2 as C/A (Figure 2).
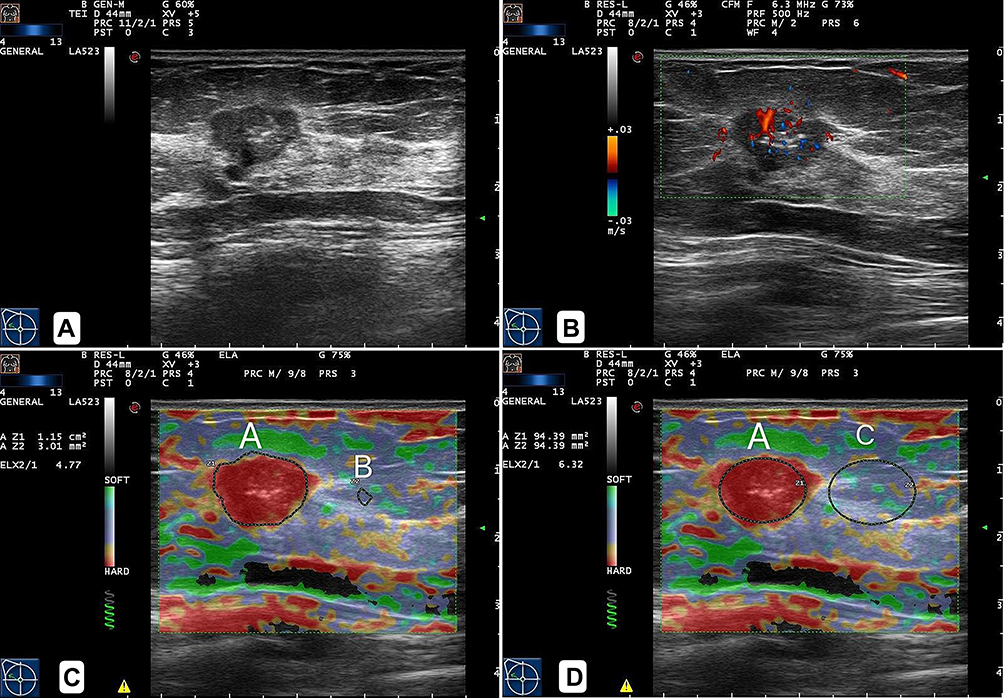 |
Figure 2 Invasive ductal carcinoma grade II in a 50-year-old woman. (A) Greyscale US image showed an irregular hypoechoic mass. (B) Color Doppler showed the blood flow was abundant in the mass. (C and D). Elastographic image showed the lesion scored 5, and ROI (A) was drawn along the margin of the lesion, and its strain was recorded. The ROI (B) and ROI (C) were selected at the normal glandular tissue, which reflected the strain of glandular tissue. ROI (B) was small (≤3.1mm2) and ROI (C) was as large as ROI (A). SR1 was 4.77 (C), and SR2 was 6.32 (D). |
According to the method proposed by Xue et al,20 ES, SR1, and SR2 were combined with BI-RADS (eg, ES+BI-RADS, SR1+BI-RADS, and SR2+BI-RADS), respectively. The grades originally assigned to the lesions were lifted (or lowered) (except grades 5 and 2, which remained unchanged) according to cutoffs derived from receiver operating characteristic curves. If less than the cut-off point, the BI-RADS was downgraded, and vice versa.
Histopathological Evaluation
For invasive cancers, specimens were used to determine the histological grades of breast lesions, and the levels of estrogen receptor (ER), progesterone receptor (PR), human epidermal growth factor receptor (Her-2), and Ki-67. The histologic grade was defined according to the Nottingham grading system (grade 1, differentiated; grade 2, moderately differentiated; grade 3, poorly differentiated).21 The ER and PR expressions were scored as positive or negative with a nuclear immunostaining cutoff of 10%, and Ki67 ≥14% was indicative of high proliferation.22 Immunohistochemistry was taken into consideration in classifying Her-2. Her-2 status was deemed to be positive with a score of 3+ and negative with a score of 0 or 1+. Tumors scoring 2+ were submitted to fluorescence in situ hybridization (FISH). Tumors with Her-2 amplification were considered positive when the ratio of the Her-2 gene signal to chromosome 17 signal was ≥2. Based on our immunohistochemistry results, the invasive cancers were divided into four molecular subtypes: luminal A, luminal B, Her-2 enriched, and triple-negative breast cancer.23 A positive axillary lymph node was determined by the presence of metastasis, with pathological results as a reference.
Statistical Analysis
ROC curve was fitted. The area under the ROC curve (Az) with a 95% CI was determined to find the cutoff values of ES and SR for differentiating benign from malignant breast masses. The sensitivity and specificity were calculated. The scatter plots were used to measure the correlation between SR1 and SR2. All variables about invasive carcinoma were subjected to a descriptive analysis, Kruskal-Walls H-test, Mann–Whitney U-test and one-way ANOVA were performed to evaluate the association of SR1 or SR2 with tumor-related variables. Using variables screened by a univariate analysis, a multiple linear regression analysis was performed to determine variables independently associated with SR1 and SR2. The statistical analysis was performed on SPSS 19.0 software (IBM Corporation, Armonk, NY). A receiver operator characteristic (ROC) analysis was performed using MedCalc 19.0.4 (MedCalc Software, Mariakerke, Belgium). P < 0.05 was considered statistically significant, and r > 0.6 as highly correlated.
Results
Pathological Diagnoses
The pathological analysis showed that 354 (50.1%) lesions were malignant and 353 (49.9%) lesions were benign (Table 1). The most common malignant tumor was invasive ductal carcinoma (n = 273), and the most common benign tumor was fibroadenoma (n = 145). The mean diameter of malignant lesions was 16.41 ± 5.00 mm, and that of benign lesions was 13.69 ± 4.95 mm (P < 0.001). Mean age of malignant breast lesions also differed from that of benign ones significantly (52.73 ± 11.15 y vs 47.15 ± 12.44 y, P < 0.001).
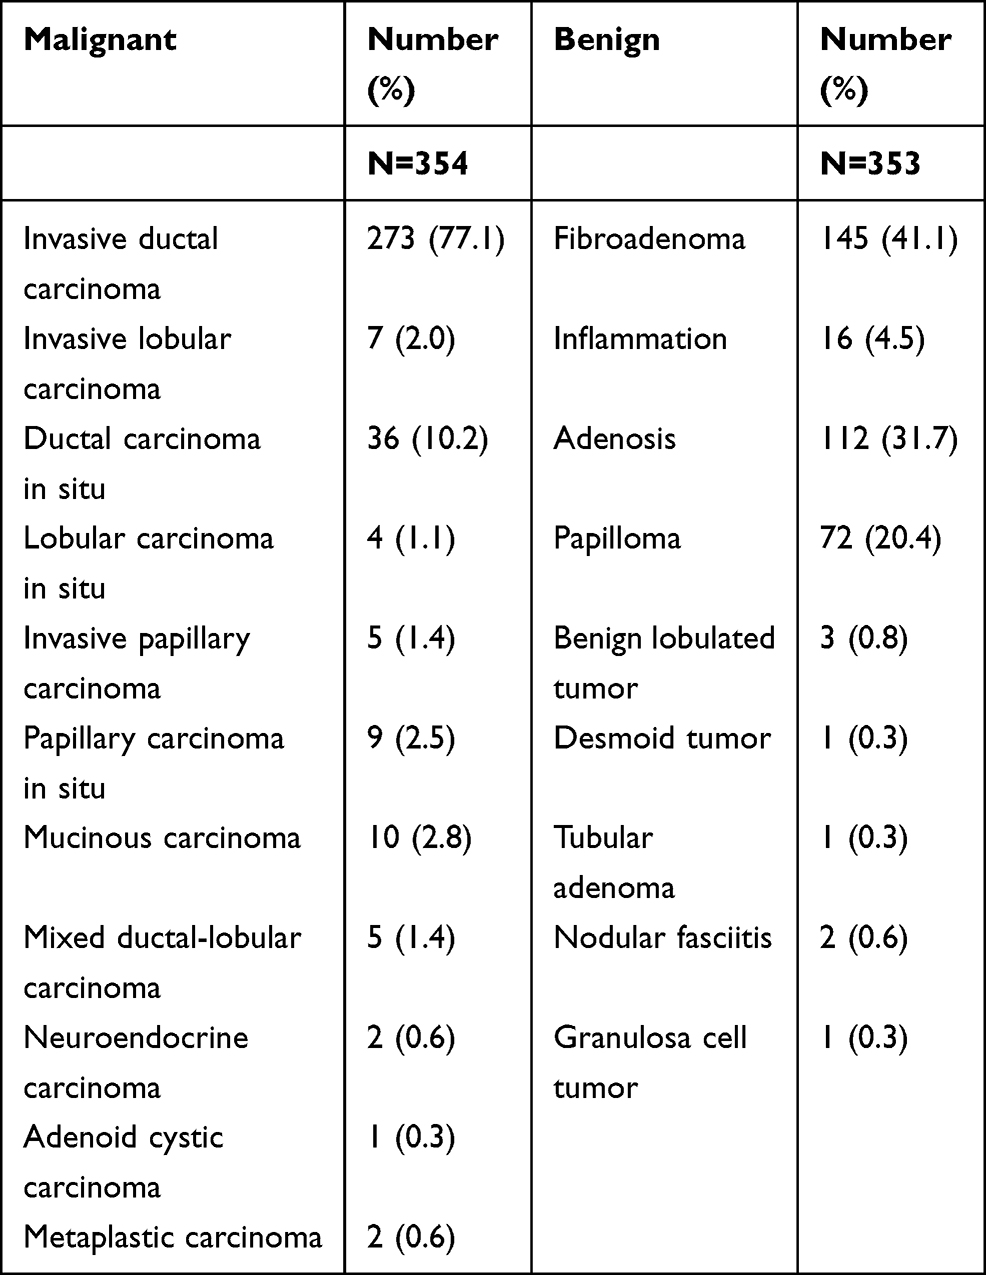 |
Table 1 Pathological Diagnoses in 707 Breast Lesions |
Diagnostic Performance of BI-RADS and Elastography
On conventional US, 140 lesions were classified into BI-RADS category 3, 187 into category 4A, 100 into category 4B, 208 into category 4C, and 72 into category 5 (Table 2). On the color map, two lesions were scored as 1, 184 lesions as 2, 157 as 3, 335 as 4, and 29 as 5 (Table 3). The elasticity score of malignant lesions was 3.80 ± 0.68, which was higher than that of benign lesions (2.78 ± 0.82) (P < 0.001) (Table 4). The sensitivity, specificity, and Az of elasticity score were 79.1%, 76.2%, and 0.806, respectively (Table 5).
 |
Table 2 Distribution of Malignant and Benign Tumours for BI-RADS 1–5 |
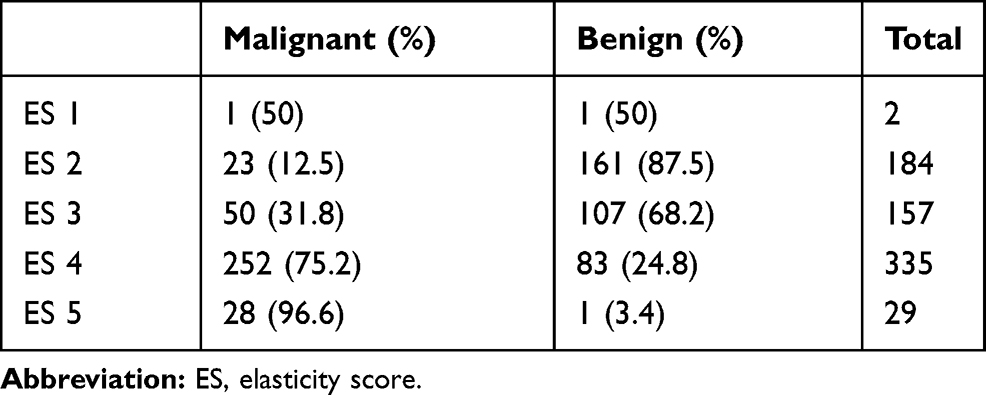 |
Table 3 Distribution of Malignant and Benign Tumours for Elasticity Score 1–5 |
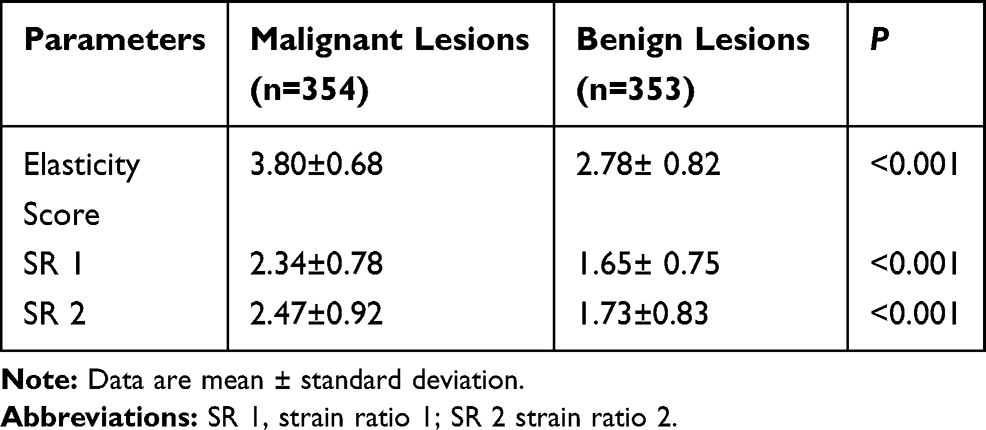 |
Table 4 Elasticity Parameters in Malignant and Benign Lesions |
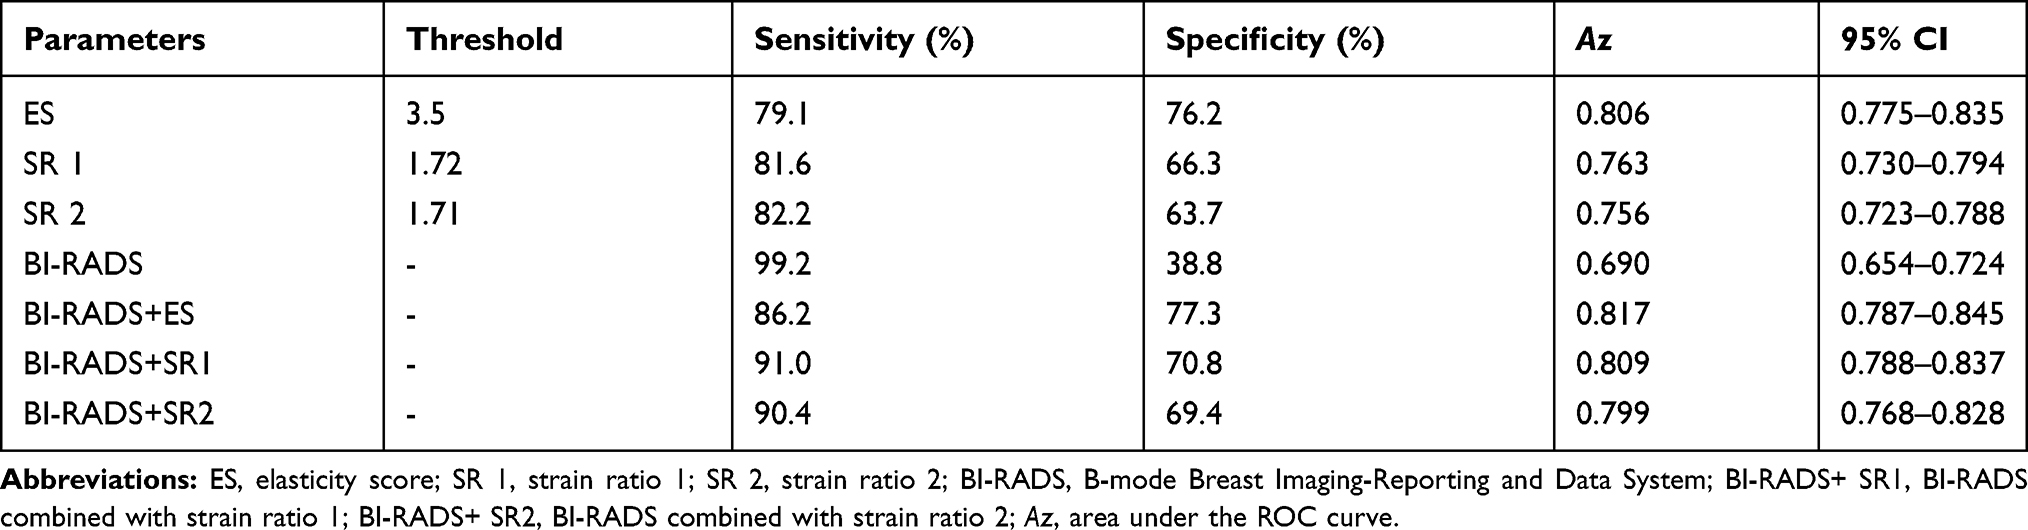 |
Table 5 Diagnostic Performances of Different Elasticity Parameters |
SR1 showed significant difference between malignant and benign lesions (2.34 ± 0.78 vs 1.65 ± 0.75, P < 0.001). Similarly, the mean SR2 of the malignant lesions was significantly higher than that of the benign ones (2.47 ± 0.92 vs 1.73 ± 0.83, P < 0.001) (Table 4).
The sensitivity, specificity, and Az of SR1 were 81.6%, 66.3%, and 0.763, respectively; those of SR2 were 82.2%, 63.7%, and 0.756, respectively (Table 5). The scatter plots demonstrated that SR1 and SR2 had a strong positive correlation (r = 0.821) (Figure 3). SRs (SR1 and SR2) increased with elasticity score (Figure 4). The sensitivity, specificity, and Az of BI-RADS were 99.2%, 38.8%, and 0.690, respectively. After BI-RADS combined with elasticity score or strain ratio, the specificity was significantly improved. The Az value of BI-RADS+ES or BI-RADS+SRs was higher than BI-RADS (P < 0.001) (Table 5).
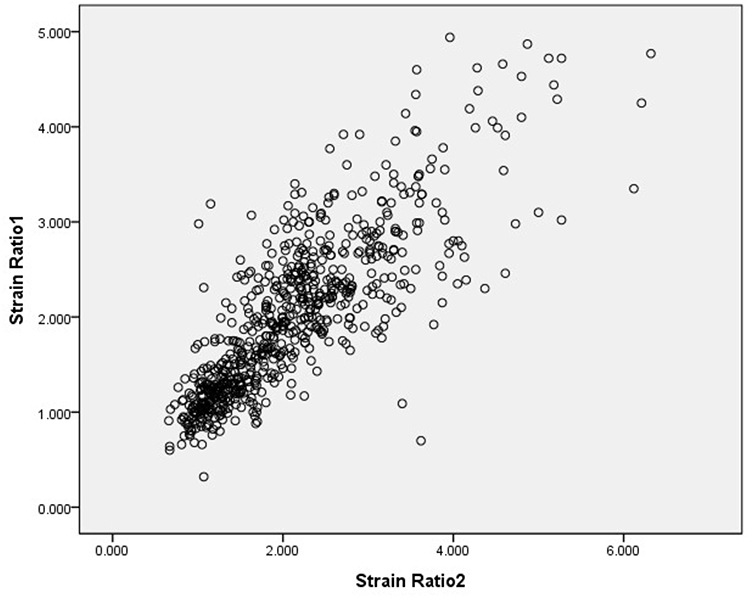 |
Figure 3 A scatter plot showing the correlation between SR1 and SR2, with a positive correlation coefficient of r = 0.821 (R2 = 0.674). |
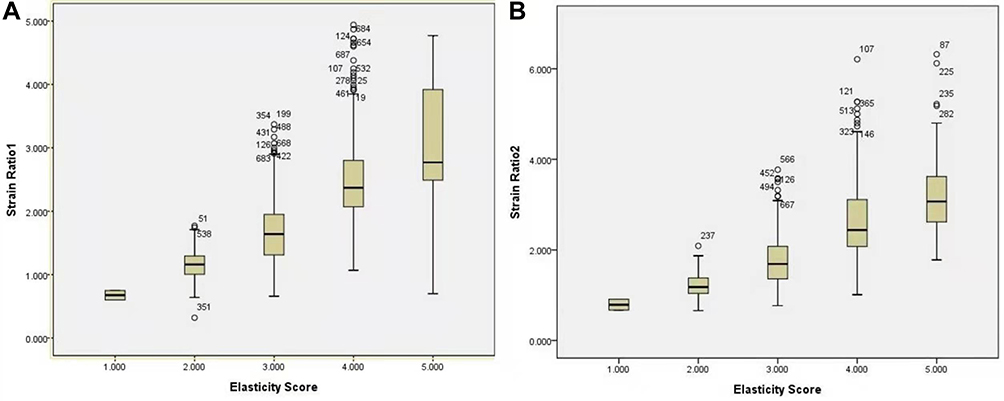 |
Figure 4 Elasticity ratios according to elasticity score. Boxplot graphs demonstrated the strain ratio was closely related to the elasticity score. (A) As the elasticity score increased, the SR1 value increased. (B) As the elasticity score increased, the SR2 value also increased. |
Diagnostic Performance of Elasticity Parameters
The elasticity score yielded the highest Az value (0.806), higher than those of SR1 (Az = 0.763) and SR2 (Az = 0.756) (P < 0.001). The Az value of SR1 neared that of SR2 (P = 0.569) (Figure 5A).
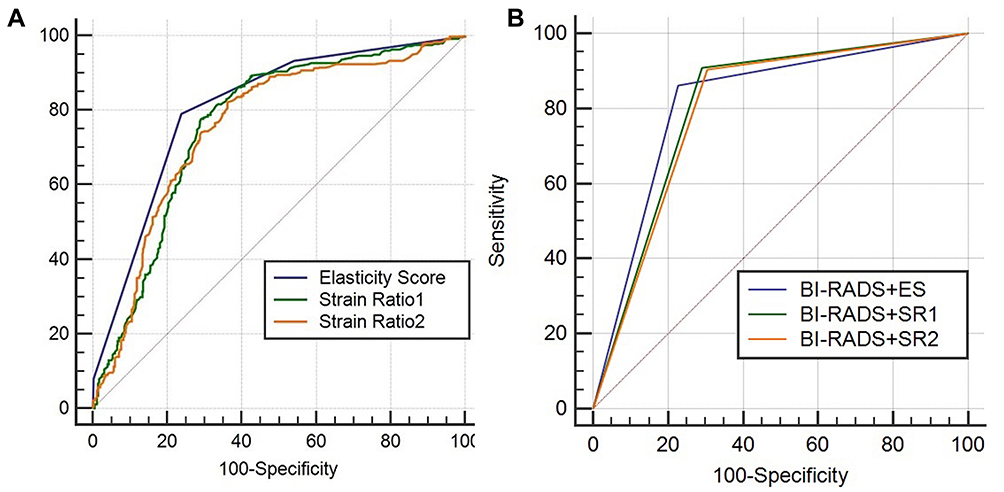 |
Figure 5 Receiver operating characteristic curves for different elasticity parameters. (A) The Az value of elasticity score (0.806) was significantly higher than that those of SR1 (0.763) and SR2 (0.756) (P < 0.001). However, there was no significant difference between the Az values of SR1 and SR2 (P = 0.569). (B). There was no significant difference between the Az values of BI-RADS combined with ES (0.817), BI-RADS combined with SR1 (0.809), and BI-RADS combined with SR2 (0.799) (all P values > 0.05). |
The sensitivity, specificity, and Az of BI-RADS+ES were 86.2%, 77.3%, and 0.817 (cutoff 3.5), respectively; those of BI-RADS+SR1 were 91.0%, 70.8%, and 0.809 (cutoff 1.72), respectively; those of BI-RADS+SR2 were 90.4%, 69.4%, and 0.799 (cutoff 1.71) (Table 5). The sensitivity, specificity, and Az showed no difference among the three indexes (Figure 5B).
Correlations Between Tumor Stiffness and Clinicopathological Factors
Lesions enrolled in this study demonstrated 305 invasive breast carcinomas, including 273 invasive ductal carcinomas, 7 invasive lobular carcinomas, 10 mucinous carcinomas, 5 mixed ductal lobular carcinomas, and 10 rare invasive breast carcinomas. Histological type was significantly associated with SR1 (P = 0.001) and SR2 (P = 0.008). Of these invasive cancers, invasive lobular carcinoma showed the highest SR, while mucinous carcinoma showed the lowest SR.
As for molecular subtypes, 12.1% of cancers were classified into luminal A subtype, 60.7% into luminal B subtype, 18.7% into Her-2 enriched subtype, and 8.5% into triple-negative subtype. There was no significant statistical difference in SR value between these four subgroups.
In the univariate analysis, indistinct margin, high histologic grade, histological type, and negative Her-2 status were significantly associated with tumor stiffness described as SR1 and SR2. PR status and molecular subtype were associated with SR2. However, patient age, tumor size, shape, posterior acoustic feature, orientation, Adler blood flow grade, axillary lymph node status, ER, and Ki-67 expression were not associated with SR (all P > 0.05).
In the multivariate logistic regression analysis, histologic grade (P = 0.012) and tumor margin (P = 0.034) were significantly associated with SR1, and tumor margin (P = 0.043) was significantly associated with SR2 (Table 6).
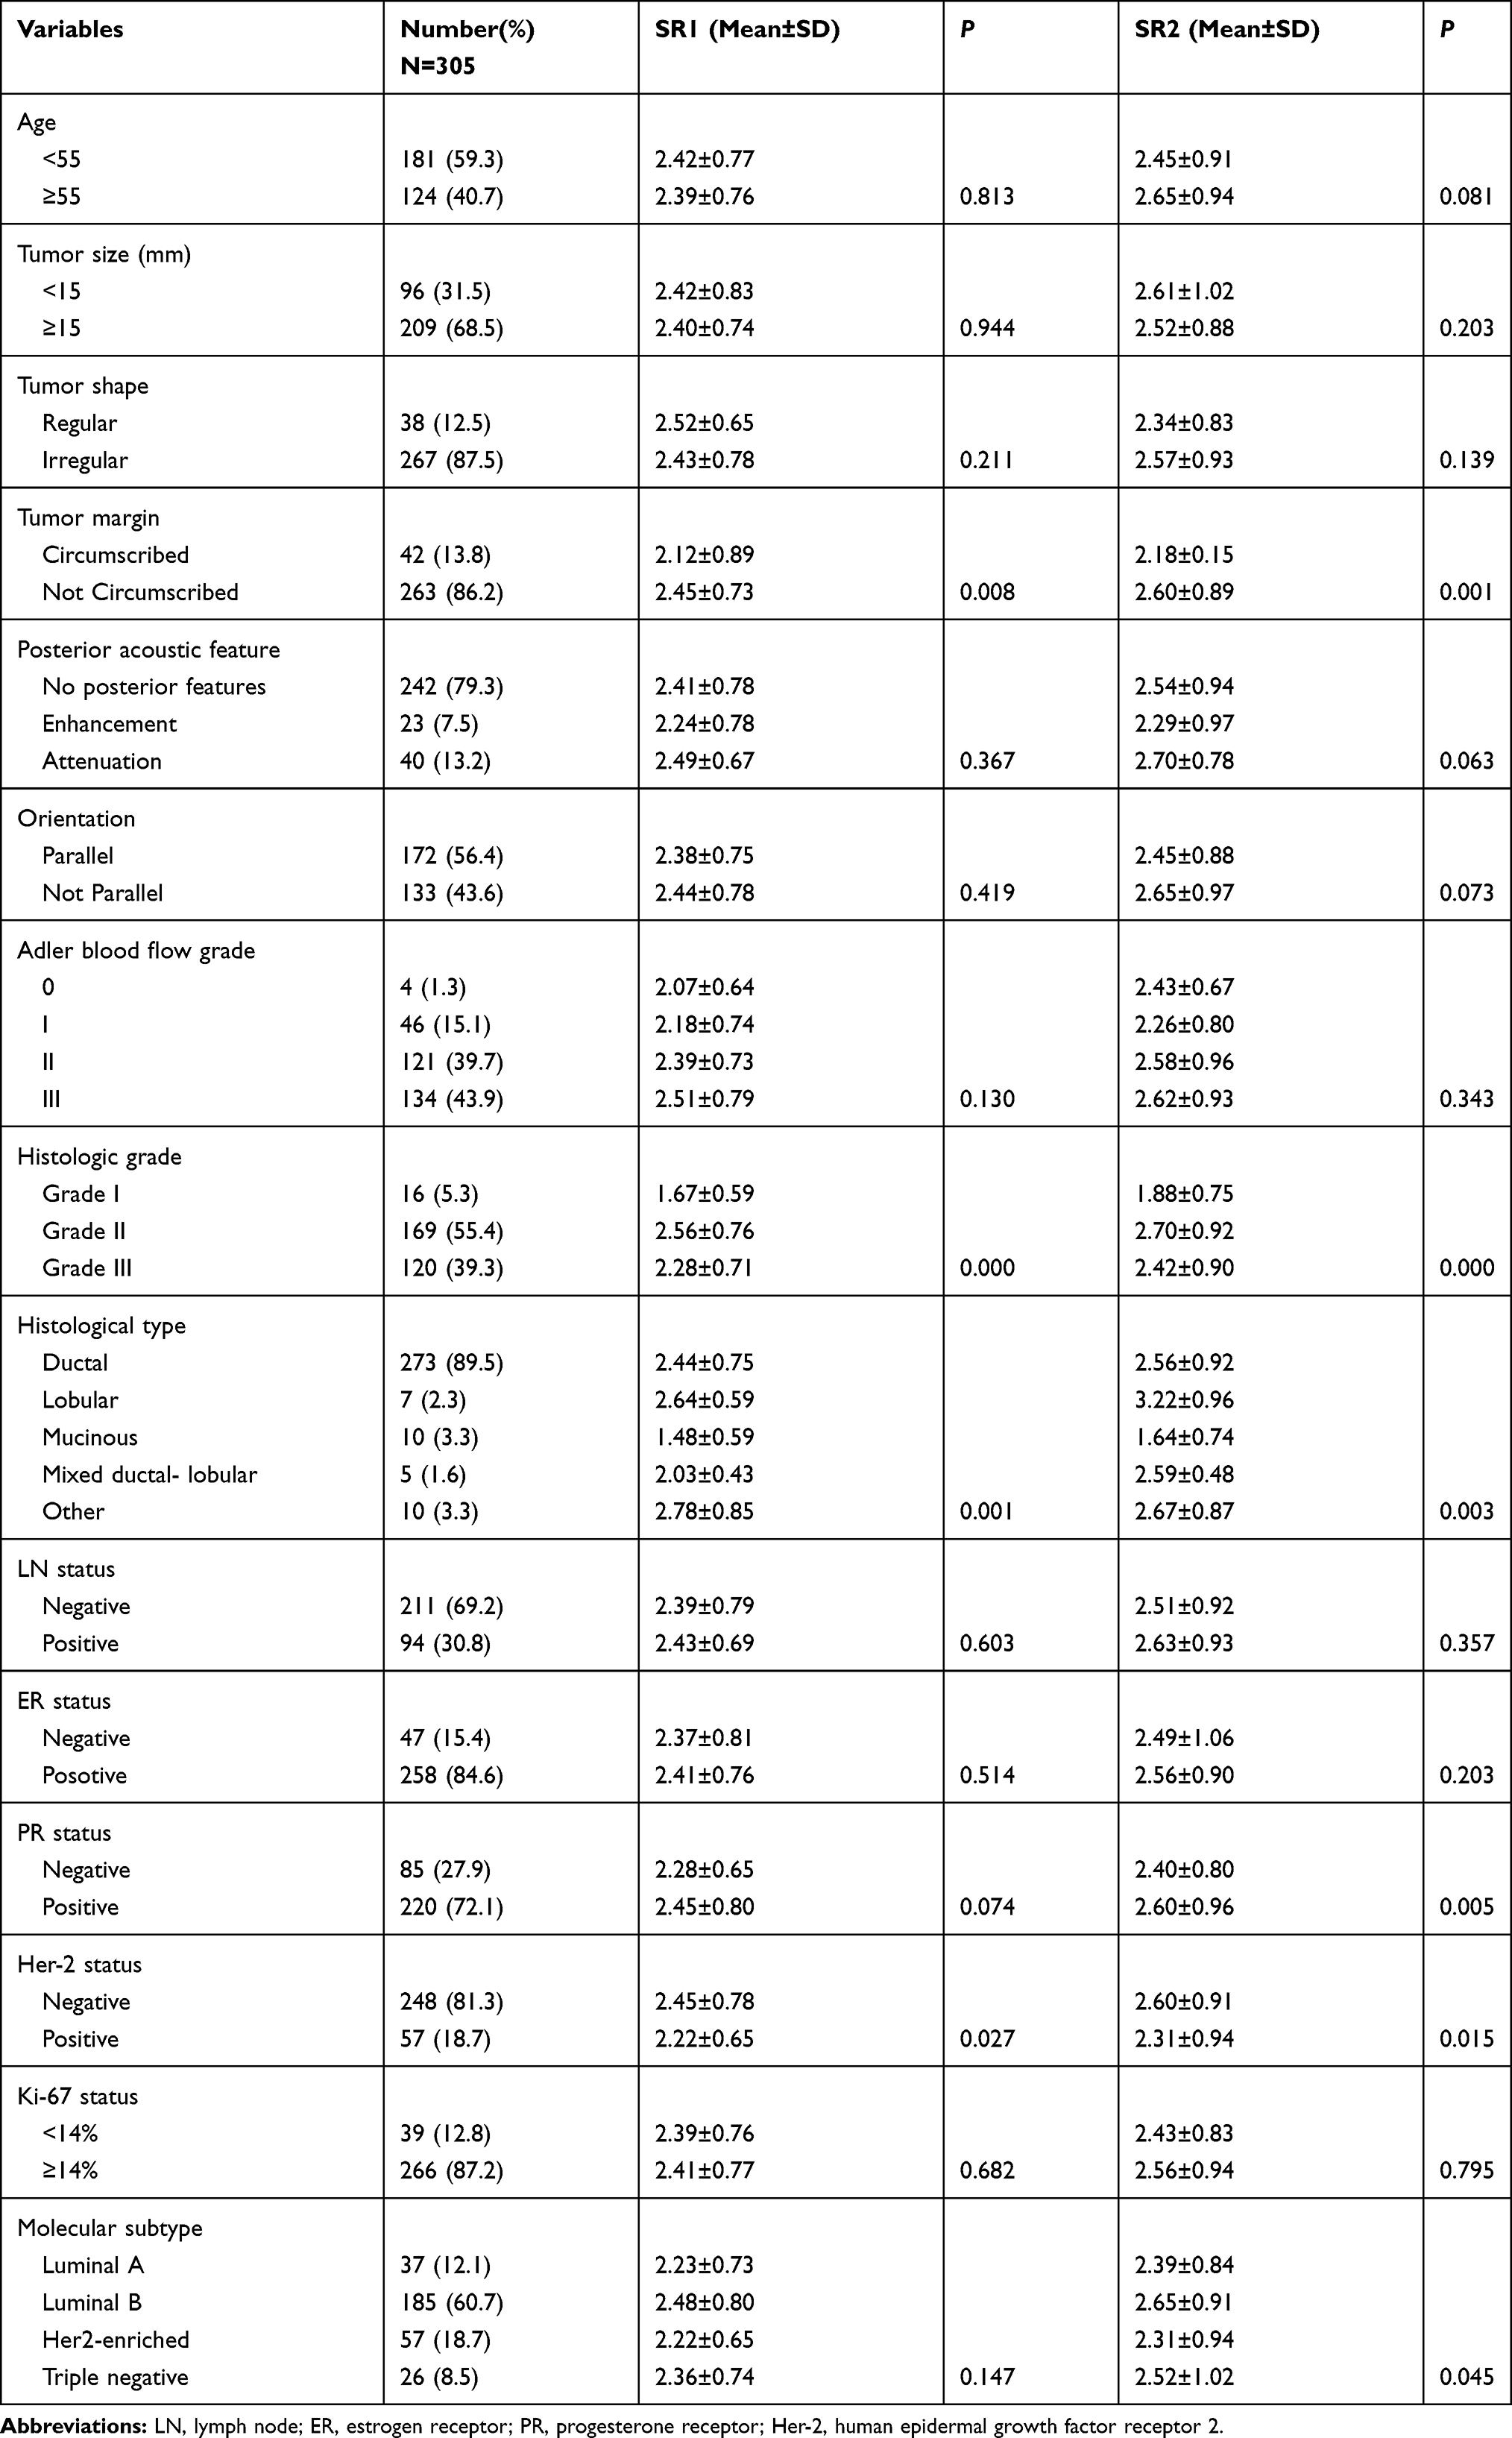 |
Table 6 Relationships Between Strain Ratios and Clinicopathological Features in Invasive Carcinoma |
Discussion
Breast elastography has been developed as an adjunct to conventional B-mode US for improving the overall diagnostic accuracy of breast lesions.24 It evaluates the stiffness of a lesion by comparing US radiofrequency signals obtained before and after slight compression on the tissue.25 In this study, elastography combined with BI-RADS significantly improved the specificity for breast lesions. In breast US elastography, the five-point elasticity scoring system and SR are used to differentiate benign and malignant breast lesions.18 Elasticity scoring is qualitative and operator-dependent, whereas SR is a semi-quantitative index describing the stiffness difference between pathological and normal (reference) tissue. To calculate SR, fatty or glandular tissue is often taken as reference.7 In previous analyses based on strain elastography,5,26,27 there was no uniform standard for the selection of reference tissue. Previous studies showed that SRs at sites with the same distance to the stress source did not vary in a tissue-mimicking phantom, regardless of the size of reference tissue.28 However, the texture of tissue-mimicking phantom made of synthetic polymers is different from that of woman breast, so the diagnostic value of SRs in the reference tissue for breast tumor remains to be assessed.
This is the first large-Chinese-population study to compare the breast-cancer-diagnosing values of SRs in different ROIs selected from the same reference tissue. This study showed that at the same depth, the difference was not statistically significant between areas under the curve of SR1 and SR2, and both areas were positively correlated. Because ultrasonography can only be used to define the ROI in tumor tissue, the ROI in reference tissue has to be set manually. In measuring SR1, we found that the ROIs of reference tissue showed homogeneous colors, making it easier to select ROIs and perform multiple measurements. Additionally, the area of ROI in SR1 measurement was small, which is consistent with the results of Harve et al,28 who pointed out that a smaller reference area provided a better anatomical perspective and a more even strain distribution. In measuring SR2, the ROIs showed inhomogeneous colors; for SR2 measurement, the area of ROI in irregular lesions was not equal to that of the lesion. In China with a large population, SR1 is easier to be measured and suitable for clinical work.
Previous studies harvested inconsistent findings on the diagnostic value of elasticity score and SR for breast lesions.13,26,29 In our study, the areas under the ROC curve for elasticity score, SR1, and SR2 were 0.806, 0.763, and 0.756, respectively; that of elasticity score was higher than those of SR1 and SR2. This finding is concordant with those by Lee et al30 and Zhou et al.5 Even though, elasticity score is often subjectively obtained and highly dependent on the experience of operators. In this study, the operators had 15–20 years of experience in breast imaging. For less-experienced doctors, whether the elasticity score is more accurate than SR remains to be investigated. The areas under the ROC curve for BI-RADS+ES, BI-RADS+SR1, and BI-RADS+SR2 were 0.817, 0.809, and 0.799, respectively; there was no significant statistical difference between them.
To our knowledge, this is the first large-Chinese-population study to evaluate the efficacy of strain elastography in diagnosing invasive breast cancer. In our study, the stiffness of a cancer was positively associated with its malignance. A high SR was significantly associated with an indistinct margin, a histologic type, a high histologic grade, and a negative Her-2 status.
As we all know, angular and spiculated margins are two well-established malignant criteria.31 An indistinct margin may suggest the desmoplastic reaction within surrounding tissue. A study by Blaichman et al32 showed a slight to moderate predictive power of margin in malignant tumors. As shown in other studies,33,34 histological type was another major factor associated with SR1, highest in invasive lobular carcinoma (ILC) and lowest in mucinous carcinoma. The growth of ILC involves the invasion of single cells or single files of cells through the stroma, with little disturbance to normal tissue, so ILC often displays perfect or moderate differentiation.35 In this study, ILC was moderately differentiated and had less necroses, so it was stiffer than invasive ductal carcinoma. Joseph et al36 and Ganau et al37 also reported the similar results. Since ILC often appears as a non-mass-like lesion on ultrasound, elastography may be complementary in identifying ILC. As discussed by Ganau et al,37 for its regular morphology and high-level mucin, mucinous carcinoma often appears benign and soft.
The association between histological grade and sonoelastographic features remains controversial. Similar to those made by You et al and Lee et al,38,39 this study showed that the SRs of grades 2 and 3 were greater than that of grade 1, but the SR of grade 3 was lower than that of grade 2. Chamming et al40 suggested that necrosis, more in higher grades, was correlated with stiffness. Dominkovic et al41,42 also suggested that triple negative breast cancers, always in a higher histological grade, demonstrated softer features on shear wave elastography. Overexpression of Her-2 is linked with cell proliferation, invasion, and metastasis, so Her-2-positive cells have more malignant phenotypes.38 Her-2-positive tumors usually develop with more necroses and less pronounced desmoplastic reaction.43,44 In a murine model, Chamming’s et al40 confirmed a negative correlation between stiffness and necrosis and a positive correlation between stiffness and fibrosis. However, the present study showed a higher SR in Her-2-negative breast cancer than in Her-2-positive breast cancer, which is similar to the finding of You et al.38 This higher SR in Her-2 negative lesions might be associated with higher-degree fibrosis and lower-degree necrosis. Of the 248 Her-2-negative masses, 61% were in grade 2, probably explaining why their stiffness was greater than that in Her-2-positive masses. Molecular subtype was associated with SR2 (as suggested by Zheng et al46), but not with SR1 (as suggested by Durhan et al45). The relationship between PR status and lesion elasticity was controversial.38,47 In this study, positive PR was associated with SR2, but not with SR1. Large sample and multi-center studies may be needed to determine the relationship between SR and these prognostic factors.
There were some limitations in this study. First, the study only involved Chinese women, without considering the influence of race. Second, we did not evaluate the effect of interobserver variability on breast elastography. Precompression technique, which can avoid interobserver variability, was not assessed in our study. Moreover, according to Havre’s research of tissue-mimicking phantom, we assumed that the SRs at the same depth were the same. In fact, we need to compare strain ratios at different depths in breast tissue. Another limitation was that the selection of samples was biased, and tumors larger than 25 mm in diameter were not studied. Finally, we explored the relationships between prognostic factors and SR, but the long-term clinical outcomes of SR remain unclear.
In conclusion, SRs in different ROIs of the reference tissue at the same depth showed no statistical difference in the diagnosis of breast tumors, and SR1 and SR2 were highly positively correlated. SR1 is more suitable for clinical setting in China. In addition, both SR1 and SR2 could be useful in identifying invasive breast cancer. Better-designed studies should be accomplished to verify our results.
Acknowledgments
Hui Wang and Cui-Ying Li are co-first authors for this study.
Disclosure
The authors report no conflicts of interest for this work.
References
1. Zou HS, Xue Y, Ou Y, et al. Factors affecting the quality of breast quasistatic ultrasound elastograms. J Ultrasound Med. 2018;37(7):1701–1712. doi:10.1002/jum.14518
2. Stachs A, Hartmann S, Stubert J, et al. Differentiating between malignant and benign breast masses: factors limiting sonoelastographic strain ratio. Ultraschall Med. 2013;34(2):131–136. doi:10.1055/s-0032-1313168
3. Barr RG. Sonographic breast elastography: a primer. J Ultrasound Med. 2012;31(5):773–783. doi:10.7863/jum.2012.31.5.773
4. Koh J, Kim EK, Kim MJ, et al. Role of elastography for downgrading BI-RADS category 4a breast lesions according to risk factors. Acta Radiol. 2019;60(3):278–285. doi:10.1177/0284185118780901
5. Zhou J, Zhou C, Zhan W, et al. Elastography ultrasound for breast lesions: fat-to-lesion strain ratio vs gland-to-lesion strain ratio. Eur Radiol. 2014;24(12):3171–3177. doi:10.1007/s00330-014-3366-8
6. Garra BS, Cespedes EI, Ophir J, et al. Elastography of breast lesions: initial clinical results. Radiology. 1997;202(1):79–86. doi:10.1148/radiology.202.1.8988195
7. Chee C, Lombardo P, Schneider M, et al. Comparison of the fat-to-lesion strain ratio and the gland-to-lesion strain ratio with controlled precompression in characterizing indeterminate and suspicious breast lesions on ultrasound imaging. J Ultrasound Med. 2019;38(12):3257–3266. doi:10.1002/jum.15037
8. Barr RG, De Silvestri A, Scotti V, et al. Diagnostic performance and accuracy of the 3 interpreting methods of breast strain elastography: a systematic review and meta-analysis. J Ultrasound Med. 2019;38(6):1397–1404. doi:10.1002/jum.14849
9. Moon JH, Koh SH, Park SY, et al. Comparison of the SR max, SR ave, and color map of strain-elastography in differentiating malignant from benign breast lesions. Acta Radiol. 2019;60(1):28–34. doi:10.1177/0284185118773510
10. Cho N, Moon W, Kim H, et al. Sonoelastographic strain index for differentiation of benign and malignant nonpalpable breast masses. J Ultrasound Med. 2010;29(1):1–7. doi:10.7863/jum.2010.29.1.1
11. Sadigh G, Carlos R, Neal CH, et al. Accuracy of quantitative ultrasound elastography for differentiation of malignant and benign breast abnormalities: a meta-analysis. Breast Cancer Res Treat. 2012;134(3):923–931. doi:10.1007/s10549-012-2020-x
12. Zhao QL, Ruan LT, Zhang H, et al. Diagnosis of solid breast lesions by elastography 5-point score and strain ratio method. Eur J Radiol. 2012;81(11):3245–3249. doi:10.1016/j.ejrad.2012.06.004
13. Zhi H, Xiao XY, Yang HY, et al. Ultrasonic elastography in breast cancer diagnosis: strain ratio vs 5-point scale. Acad Radiol. 2010;17(10):1227–1233. doi:10.1016/j.acra.2010.05.004
14. Yerli H, Yilmaz T, Kaskati T, et al. Qualitative and semiquantitative evaluations of solid breast lesions by sonoelastography. J Ultrasound Med. 2011;30(2):179–186. doi:10.7863/jum.2011.30.2.179
15. Zhi H, Xiao XY, Yang HY, et al. Semi-quantitating stiffness of breast solid lesions in ultrasonic elastography. Acad Radiol. 2008;15(11):1347–1353. doi:10.1016/j.acra.2008.08.003
16. Sedgwick E. The breast ultrasound lexicon: breast imaging reporting and data system (BI-RADS). Semin Roentgenol. 2011;46(4):245–251. doi:10.1053/j.ro.2011.04.001
17. Adler DD, Carson PL, Rubin JM, et al. Doppler ultrasound and color flow imaging in the study of breast cancer: preliminary findings. Ultrasound Med Biol. 1990;16(6):553–559. doi:10.1016/0301-5629(90)90020-d
18. Itoh A, Ueno E, Tohno E, et al. Breast disease: clinical application of US elastography for diagnosis. Radiology. 2006;239(2):341–350. doi:10.1148/radiol.2391041676
19. Zhou JQ, Zhan WW, Dong YJ, et al. Stiffness of the surrounding tissue of breast lesions evaluated by ultrasound elastography. Eur Radiol. 2014;24(7):1659–1667. doi:10.1007/s00330-014-3152-7
20. Xue Y, Zou HS, Ou Y, et al. Strain histograms used for differential diagnosis of breast masses according to hardness percentage. Medicine(Baltimore). 2019;98(15):e15125. doi:10.1097/MD.0000000000015125
21. Elston CW, Ellis IO. Pathological prognostic factors in breast cancer. I. The value of histological grade in breast cancer: experience from a large study with long-term follow-up. C. W. Elston & I. O. Ellis. Histopathology 1991; 19; 403–410. Histopathology. 2002;41(3A):151–153. doi:10.1046/j.1365-2559.2002.14691.x
22. Schnitt SJ. Will molecular classification replace traditional breast pathology? Int J Surg Pathol. 2010;18(3Suppl):162s–166s. doi:10.1177/1066896910370771
23. Harbeck N, Gnant M. Breast cancer. Lancet. 2017;389(10074):1134–1150. doi:10.1016/S0140-6736(16)31891-8
24. Leong LCH, Moey THL, Tan PH, et al. Comparative study of pattern-based versus size ratio ultrasound strain elastographic techniques on breast masses. J Ultrasound Med. 2019;38(7):1779–1790. doi:10.1002/jum.14867
25. Ophir J, Céspedes I, Ponnekanti H, et al. Elastography: a quantitative method for imaging the elasticity of biological tissues. Ultrason Imaging. 1991;13(2):111–134. doi:10.1177/016173469101300201
26. Jung NY, Park CS, Kim SH, et al. Sonoelastographic strain ratio: how does the position of reference fat influence it? Jpn J Radiol. 2016;34(6):440–447. doi:10.1007/s11604-016-0543-5
27. Ueno E, Tohno E, Morishima I, et al. A preliminary prospective study to compare the diagnostic performance of assist strain ratio versus manual strain ratio. J Med Ultrason. 2005;42(4):521–531. doi:10.1007/s10396-015-0633-5
28. Havre RF, Waage JR, Gilja OH, et al. Real-time elastography: strain ratio measurements are influenced by the position of the reference area. Ultraschall Med. 2012;33(6):550–568. doi:10.1055/s-0031-1273247
29. Thomas A, Degenhardt F, Farrokh A, et al. Significant differentiation of focal breast lesions: calculation of strain ratio in breast sonoelastography. Acad Radiol. 2010;17(5):558–563. doi:10.1016/j.acra.2009.12.006
30. Lee JH, Kim SH, Kang BJ, et al. Role and clinical usefulness of elastography in small breast masses. Acad Radiol. 2011;18(1):74–80. doi:10.1016/j.acra.2010.07.014
31. Skaane P, Engedal K. Analysis of sonographic features in the differentiation of fibroadenoma and invasive ductal carcinoma. AJR. 1998;170(1):109–114. doi:10.2214/ajr.170.1.9423610
32. Blaichman J, Marcus JC, Alsaadi T, et al. Sonographic appearance of invasive ductal carcinoma of the breast according to histologic grade. AJR Am J Roentgenol. 2012;199(3):W402–W408. doi:10.2214/AJR.11.7374
33. Gennisson JL, Deffieux T, Fink M, et al. Ultrasound elastography: principles and techniques. Diagn Interv Imaging. 2013;94(5):487–495. doi:10.1016/j.diii.2013.01.022
34. Evans A, Whelehan P, Thomson K, et al. Invasive breast cancer: relationship between shear-wave elastographic findings and histologic prognostic factors. Radiology. 2012;263(3):673–677. doi:10.1148/radiol.12111317
35. Reed AE, Kutasovic JR, Lakhani SR, et al. Invasive lobular carcinoma of the breast: morphology,biomarkers and ’omics. Breast Cancer Res. 2015;17(1):12. doi:10.1186/s13058-015-0519-x
36. Joseph R, Richard G. Strain elastography for prediction of breast cancer tumor grades. J Ultrasound Med. 2014;33(1):129–134. doi:10.7863/ultra.33.1.129
37. Ganau S, Andreu FJ, Escribano F, et al. Shear-wave elastography and immunohistochemical profiles in invasive breast cancer: evaluation of maximum and mean elasticity values. Eur J Radiol. 2015;84(4):617–622. doi:10.1016/j.ejrad.2014.12.020
38. You Y, Song Y, Li SX, et al. Quantitative and qualitative evaluation of breast cancer prognosis: a sonographic elastography study. Med Sci Monit. 2019;25:9272–9279. doi:10.12659/MSM.918806
39. Lee SH, Moon WK, Cho N, et al. Shear-wave elastographic features of breast cancers: comparison with mechanical elasticity and histopathologic characteristics. Invest Radiol. 2014;49(3):147–155. doi:10.1097/RLI.0000000000000006
40. Chamming’s F, Latorre-Ossa H, Le Frere-belda MA, et al. Shear wave elastography of tumour growth in a human breast cancer model with pathological correlation. Eur Radiol. 2013;23(8):2079–2086. doi:10.1007/s00330-013-2828-8
41. Qiu J, Xue X, Hu C, et al. Comparison of clinicopathological features and prognosis in triple-negative and non-triple negative breast cancer. J Cancer. 2016;7(2):167–173. doi:10.7150/jca.10944
42. Dzoic Dominkovic M, Ivanac G, Kelava T, et al. Elastographic features of triple negative breast cancers. Eur Radiol. 2016;26(4):1090–1097. doi:10.1007/s00330-015-3925-7
43. Ko ES, Lee BH, Kim HA, et al. Triple-negative breast cancer: correlation between imaging and pathological findings. Eur Radiol. 2010;20(5):1111–1117. doi:10.1007/s00330-009-1656-3
44. Tamaki K, Ishida T, Miyashita M, et al. Correlation between mammographic findings and corresponding histopathology: potential predictors for biological characteristics of breast diseases. Cancer Sci. 2011;102(12):2179–2185. doi:10.1111/j.1349-7006.2011.02088.x
45. Durhan G, Öztekin P, Ünverdi H, et al. Do histopathological features and microcalcification affect the elasticity of breast cancer? J Ultrasound Med. 2017;36(6):1101–1108. doi:10.7863/ultra.16.06064
46. Zheng XY, Huang YN, Liu YB, et al. Shear-wave elastography of the breast: added value of a quality map in diagnosis and prediction of the biological characteristics of breast cancer. Korean J Radiol. 2020;21(2):172–180. doi:10.3348/kjr.2019.0453
47. Chang JM, Park IA, Lee SH, et al. Stiffness of tumours measured by shear-wave elastography correlated with subtypes of breast cancer. Eur Radiol. 2013;23(9):2450–2458. doi:10.1007/s00330-013-2866-2
 © 2021 The Author(s). This work is published and licensed by Dove Medical Press Limited. The full terms of this license are available at https://www.dovepress.com/terms.php and incorporate the Creative Commons Attribution - Non Commercial (unported, v3.0) License.
By accessing the work you hereby accept the Terms. Non-commercial uses of the work are permitted without any further permission from Dove Medical Press Limited, provided the work is properly attributed. For permission for commercial use of this work, please see paragraphs 4.2 and 5 of our Terms.
© 2021 The Author(s). This work is published and licensed by Dove Medical Press Limited. The full terms of this license are available at https://www.dovepress.com/terms.php and incorporate the Creative Commons Attribution - Non Commercial (unported, v3.0) License.
By accessing the work you hereby accept the Terms. Non-commercial uses of the work are permitted without any further permission from Dove Medical Press Limited, provided the work is properly attributed. For permission for commercial use of this work, please see paragraphs 4.2 and 5 of our Terms.