")
Back to Journals » Diabetes, Metabolic Syndrome and Obesity » Volume 11
Developmental origins of health and disease: a new approach for the identification of adults who suffered undernutrition in early life
Authors Ferreira HS , Xavier Junior AF , Assunção ML, Uchôa TC , Lira-Neto AB , Nakano RP
Received 17 June 2018
Accepted for publication 27 July 2018
Published 26 September 2018 Volume 2018:11 Pages 543—551
DOI https://doi.org/10.2147/DMSO.S177486
Checked for plagiarism Yes
Review by Single anonymous peer review
Peer reviewer comments 3
Editor who approved publication: Professor Ming-Hui Zou
Haroldo da Silva Ferreira,1 Antonio Fernando Silva Xavier Junior,2 Monica Lopes Assunção,1 Tainá Cardoso Caminha Uchôa,3 Abel Barbosa Lira-Neto,2 Ricardo Paulino Nakano3
1Faculty of Nutrition, Federal University of Alagoas, Maceió, Alagoas, Brazil; 2Post-graduate Program in Health Sciences, Federal University of Alagoas, Maceió, Alagoas, Brazil; 3Post-graduate Program in Nutrition, Federal University of Alagoas, Maceió, Alagoas, Brazil
Background: Undernutrition in early life (UELife) is a condition associated with greater occurrence of chronic diseases in adulthood. Some studies on this relationship have used short stature as indicator of UELife. However, other non-nutritional factors can also determine short stature. Depending on the severity of UELife, the human body reacts primarily compromising weight and length gain, but prioritizing brain growth, resulting in disproportionate individuals. Based on this premise, this study aimed to validate a new anthropometric indicator of UELife.
Design: Using stature and head circumference data from a probabilistic sample of 3,109 women, the Head-to-Height Index was calculated: HHI = (head × 2.898)/height. A HHI >1.028 (75th percentile) was the best cutoff for predicting obesity (best balance between sensitivity/specificity, largest area under the receiver operating characteristic curve, and highest correlation coefficient) and was used to define the condition of body disproportionality. The strength of associations with several outcomes was tested for both disproportionality and short stature (height ≤25th percentile: 153.1 cm).
Results: In adjusted analysis for confounding factors (age, smoking, and education level), the strength of the associations between body disproportionality and the analyzed outcomes was greater than that observed when short stature was used. Respectively, the observed prevalence ratios (95% CI) were (P<0.05 for all comparisons): obesity: 2.61 (2.17–3.15) vs 1.09 (0.92–1.28); abdominal obesity: 2.11 (1.86–2.40) vs 1.42 (1.27– 1.59); high blood pressure: 1.24 (1.02–1.50) vs 0.90 (0.75–1.08); hypercholesterolemia: 2.98 (1.47–6.05) vs 1.65 (0.91–2.99); and hypertriglyceridemia: 1.47 (1.07–2.03) vs 0.91 (0.69–1.21).
Conclusion: Body disproportionality is a more accurate indicator of UELife than short stature. While short stature may be genetically determined, a high HHI is due to metabolic adaptations to undernutrition in early life.
Keywords: anthropometric indices, metabolic risk factors, cardiovascular risk, obesity, dyslipidemia, epidemiological survey
Introduction
Since David Barker and colleagues in the 1980s published their first work on the long-term consequences of undernutrition in early life, there has been increasing interest worldwide in studies on the concept now called Developmental Origins of Health and Disease (DOHaD). According to this concept, poor nutrition in utero or during early childhood is associated with an increased risk of chronic diseases later in life.1–4
The term undernutrition used in this study should be understood in a broader sense than merely a deficiency in energy and protein, given that in contexts of poverty and lack of access to adequate food, significant proportion of individuals are subjected to multiple deficiencies. Then, in addition to macronutrients, there is a deficit of several micronutrients essential to the adequate process of growth and development of individuals.5
In this context, we have conducted several studies based on the population of Alagoas, which is one of the poorest Brazilian states and is characterized by the worst social indicators in relation to other states, such as illiteracy rate, precarious infrastructure of basic sanitation services, and high disparity in socioeconomic conditions. Since 2000, Alagoas has been designated as the state with the worst Human Development Index.6 In 1989, the prevalence of chronic undernutrition in pre-school children in Alagoas was more than seven times higher than that observed in the state of Santa Catarina (36.8% vs 4.9%),7 one of the states of the southern region of the country, which presents greater social and economic development when compared to the northeast region.
There is evidence that during the pre-conceptional, fetal, and infant phases of life, exposure to environmental compounds or behaviors, placental insufficiency, maternal inadequate nutrition, and metabolic disturbances can promote improper “epigenetic programming”, leading to susceptibility to various disease states or lesions in the first generation and sometimes subsequent generations, ie, transgenerational effects.8,9
Perhaps this explains why the height of adults in Alagoas is below the median of the population of other Brazilian states with better economic conditions,10 since the population of Alagoas was for decades undergoing a chronic process of undernutrition. For this reason, this population is especially suitable for studies on the long-term consequences of undernutrition in early life.
Having this aspect as support, we have used the short stature in adults as an indicator of undernutrition in early life. Comparing individuals of short stature with those of normal stature, we showed that the former were at higher risk for high blood pressure, obesity (but not with a high energy intake), insulin resistance, and alterations in lipid profile.11–16 Other authors have been using this same strategy to clarify issues related to DOHaD.17,18
An important limitation of this approach is that not all adults of short stature suffered undernutrition during growth and development phases. Besides a good nutritional condition, the growth of the human body also depends on genetic factors and of the neuroendocrine system. Thus, the presence of many “false positives” (individuals of short stature of hereditary origin, mainly) would reduce the strength of the association between short stature and the investigated outcomes (eg, obesity, high blood pressure, dyslipidemia,).11
As an alternative to short stature, other authors have used low birth weight as an indicator of nutritional deprivation in early life.19–21 However, this indicator covers only the prenatal phase. The period from birth to 2 years of life also constitutes a window of opportunity for the promotion of health. There are evidences that nutritional damages occurred in this phase can determine structural, metabolic and functional changes that predispose these individuals to chronic diseases in adulthood.22 Furthermore, in cross-sectional studies with adult individuals, information on birth weight is not always easily available and is also subject to a greater risk of memory bias when obtained by interview.
In view of the above limitations presented in relation to the use of short stature or low birth weight to identify undernutrition in early life, the need for validation of alternative strategies with good discriminatory power is justified.
For this, we take into account the premise that in early life the organism in adaptive response to a nutritional insult minimizes damage to head growth rather than linear growth,23,24 leading to a disproportionality of the body. Adaptive physiological mechanisms seem to explain the organism’s attempt to maintain better blood perfusion in favor of vital organs, as in the case of brain tissue.25–27
From this perspective, the construction of an anthropometric index that relates cephalic perimeter to stature is based on the assumption that individuals who underwent undernutrition in early life present a disproportion between head size and respective height, the former relatively preserved, while the latter would be reduced by virtue of the metabolic adjustments induced by nutritional damage.28
The objective of this work is to describe and propose a new anthropometric method to be used as an indicator of undernutrition in early life.
Methods
The data analyzed were obtained from a cross-sectional survey that aimed to investigate the prevalence and factors associated with food insecurity among Alagoan families.29 For this, we obtained a probabilistic sample representative of the population of women from Alagoas (in the northeast region of Brazil), one of 27 Brazilian states (including the Federal District). Brazil is a country of continental dimensions with ~200 million inhabitants, where over 80% live in urban areas. The 27 states of Brazil are grouped into five regions: north, northeast, midwest, southeast, and south. The last two regions are the richest and most developed, while the north and northeast regions are considerably poorer. The smallest administrative divisions in the country are municipalities, encompassing both urban and rural areas. Alagoas has 102 municipalities and an estimated population of 3,358,963 inhabitants.30
The variable of interest used to calculate the sample size was food insecurity, for which the study considered the prevalence of 34.7% that was found for Alagoas in the last survey conducted by the Brazilian Institute of Geography and Statistics (IBGE).31 The study population was estimated to include 841,117 families. The margin of error assumed was 2.0%. The study also considered a sample formed from 120 conglomerates (census tracts, a geographic region defined by IBGE for census purposes consisting of ~300 families) and a value of 1.5 to correct for the effect of the complex design. For a 95% CI, it would be necessary to have 3,360 families in the study. To this amount, a total of 10% was added to cover possible sample losses (closed or empty houses and refusals), totaling a sample number of 3,696 families/households. Therefore, in the case of sample losses, there was no need for replacement (provided that the losses were less than 10%). The calculations were performed using the StatCalc tool from Epi-info, version 7.1.4. (CDC, Atlanta, GA, USA). Further details have been described elsewhere, including demographic and socioeconomic characteristics.29
The present study included women aged 20–49 years residing in the households investigated. If there were two or more women, only one of them, chosen at random, was evaluated. The final sample analyzed in this study consisted of 3,109 women (Figure 1).
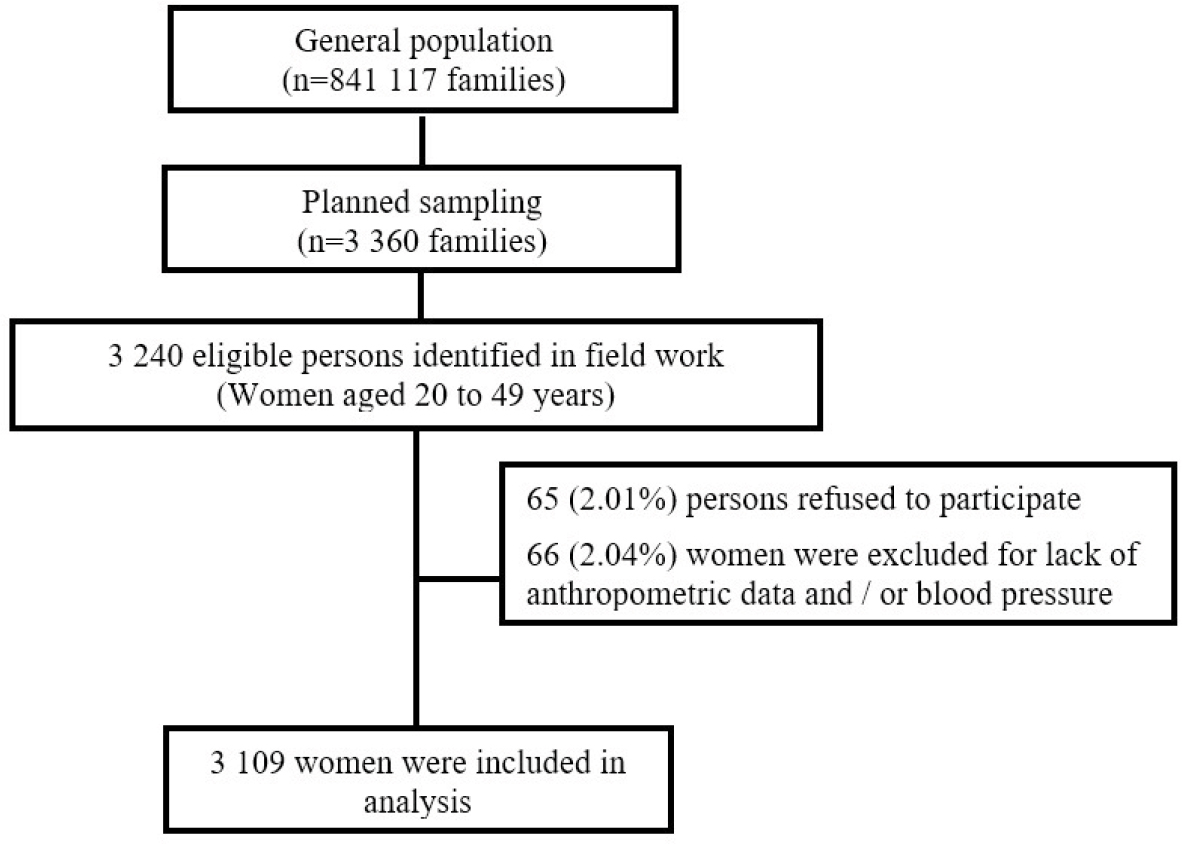 | Figure 1 Flow diagram of the participant selection process. |
Data collection
The data collection, preceded by training and a pilot study, was conducted through household visits from April 2014 to March 2015. The field team was composed of a general coordinator, a supervisor, two anthropometrists, and 12 interviewers. The coordinator was responsible for logistical and administrative matters, while the supervisor systematically ensured the quality of the data obtained. Following a sequence of questions contained in structured forms and standardized procedures, socioeconomic, demographic, environmental, anthropometric, biochemical, and health data were collected.
Anthropometric data
The anthropometric data were collected under international standardized protocols.32 Women who had visible anatomical changes that could interfere with the accuracy of the anthropometric measurement were excluded from the analysis. To measure height, a portable stadiometer (model 213; Seca GmbH & Co, Hamburg, Germany) equipped with a measuring tape with a sensitivity of 0.1 cm was used. Those assigned to the first quartile (≤153.1 cm) were considered to be of short stature, a condition that is associated with a higher probability of having suffered undernutrition during one or more phases of growth and development,11,14,15 women from the fourth quartile (>161.0 cm) were taken to be of normal stature and served as a reference for comparison of the variables of interest.
Weight was verified on a digital scale (model MS6121R; Charder Electronic Co, Taichung City, Taiwan) with a capacity of 250 kg and a precision of 100 g. The scale was calibrated daily against a standard weight. Obesity was identified by a body mass index (BMI) ≥30 kg/m2.32 Occipitofrontal circumference was measured with a narrow non-stretch tape placed in the horizontal plane encompassing the widest circumference of the head. The tape measure was kept taut, and measurements were made to the nearest 0.1 cm.33
The waist circumference (WC) was measured at the midpoint between the last rib and the upper edge of the iliac crest, using an inextensible tape measure with a sensitivity of 0.1 cm and a capacity of 150 cm. Abdominal obesity was defined by waist-to-height ratio (WHtR) >0.54.34
Considering the values obtained for the perimeter of the head and for stature, the Head-to-Height Index (HHI) was created. This index seeks to reveal disproportions in the relationship between head size and respective height and, if associated with an appropriate cutoff point, may become a good indicator of nutritional disorders occurring at the beginning of life (pre- and/or postnatal life).
Construction of the Head-to-Height Index (including the commands routine in Stata™)
- Creation of a constant that makes the median perimeter of the head (cm) equal to the median height of the studied population (cm).
gen constant_hhi = height/head
sum constant_hhi, d Result: The median value was 2.898
- Generation of the variable HHI:
gen hhi = (head * 2.898)/height
- Estimation of the best cutoff of the HHI as an indicator of undernutrition in early life:
In the estimation of the best cutoff values of the HHI, the following criteria were adopted: balance between sensitivity and specificity, the area under the receiver operating characteristic (ROC) curve and the Spearman’s correlation coefficient. Since obesity is an important risk factor for chronic non-communicable diseases in general, this condition was used as the dependent variable in the calculations for the definition of this cutoff point.
centile hhi, centile(75) Result: 1.028
The procedure was repeated to identify the values corresponding to the percentiles 80, 85, 90, and 95.
gen head75 = hhi > 1.028 if hhi <.
With this command, the variable “head75” was generated, with a cutoff value corresponding to the 75th percentile of the HHI distribution. Then, the procedure was repeated considering the other cutoff points, obtaining the variables “head80”, “head85”, “head90”, and “head95”.
diagt obesity head75
This procedure was used to test the accuracy of the indicator as a predictor of obesity. After this command, the Stata returns, among others, the following information: sensitivity, specificity, and the area under the ROC curve. Then, the command was repeated to find these parameters based on the other variables (head80, head85, head90, and head95).
spearman obesity head75
With this procedure, the Spearman’s correlation coefficient between obesity and HHI >75th percentile was identified. The same was done for the other variables.
The results obtained are shown in Table 1. The value corresponding to the 75th percentile was the one that was most adequate for the proposed objectives, since it presented the best balance between sensitivity and specificity, the largest area under the ROC curve, and the highest correlation coefficient.
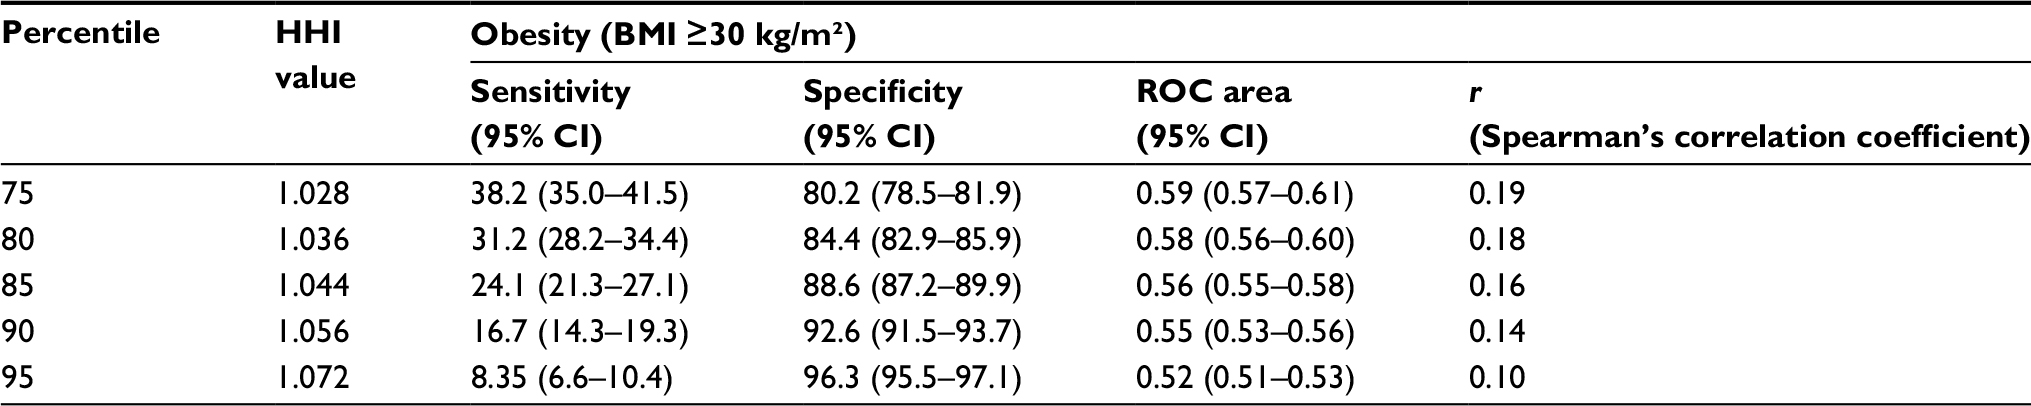 | Table 1 Accuracy of different cutoff points applied to HHI (Head-to-Height Index) in the prediction of obesity Abbreviations: ROC, receiver operating characteristic; BMI, body mass index. |
Given this definition, it was assumed that individuals above the 75th percentile of the HHI distribution had heads that were disproportionally large in relation to their respective height and are referred in this study as high HHI or disproportionate individuals. Therefore, HHI >75th percentile (fourth quartile) was compared with short stature to establish which of these two criteria would be the best indicator of undernutrition in early life. This comparison was based on the definition of the best ability of the indicator as a predictor of conditions such as obesity, high blood pressure, dyslipidemia, and high WC. There is ample documentation in the literature evidencing that individuals who suffered undernutrition in early life are more susceptible to presenting such conditions.11–17,35–37
Blood pressure
The blood pressure check was carried out in duplicate, with the individual seated and after 15 minutes of rest, with a minimum interval of 5 minutes between checks. The digital devices used were an Omron brand product (model HEM-7113). In cases of a difference above 5 mmHg between the two measurements, a third check was carried out. In these cases, for average calculations, the most discrepant measurement was disregarded.34
Blood pressure was measured in a single moment, and the diagnosis of hypertension should be based on readings taken on several occasions.38 For this reason, the analyzed outcome will be referred as high blood pressure and not as hypertension. As performed in this study, many other epidemiological surveys on blood pressure have used this same strategy.12,34,39,40 High blood pressure was defined when the mean systolic blood pressure was ≥140 mmHg and/or mean diastolic blood pressure was ≥90 mmHg and/or when the participant stated the use of antihypertensive drugs.41
Biochemical data
After 12–14 hours of fasting, capillary whole blood samples were collected and immediately assayed using Alere Cholestech LDX System® (Alere Inc, Waltham, MA, USA). This equipment was properly certified in regard to its accuracy and reproducibility.42 The concentrations of serum triglycerides (TG) and low-density lipoprotein-cholesterol (LDL-c) were determined. For the interpretation of the results, the cutoffs of the new Brazilian Guidelines of Dyslipidemias and Atherosclerosis Prevention (hypercholesterolemia: LDL-c ≥160 mg/dL; hypertriglyceridemia: TG ≥150 mg/dL) were used as references.43
These determinations were performed on a subgroup of women established by systematic sampling equivalent to a quarter of the total sample.
Covariables
During the interview, information was obtained on variables that were admittedly associated with the occurrence of the dependent variables, which were properly controlled in the statistical analysis. The variables analyzed were as follows: age, smoking, and education level (assumed to be an indicator of socioeconomic level).
Statistical analyses
All statistical analyses were performed with Stata/SE 12.1 (Stata Corp., College Station, TX, USA). The adherence of the data to the parametric assumptions was tested with the Kolmogorov–Smirnov test. Continuous variables were expressed as the mean ± SD, and differences between groups were tested with Student’s t-test (comparing two groups) or one-way ANOVA (comparing three or more groups). Categorical variables are expressed as percentages and compared by chi-squared tests. Pearson’s correlations were performed to explore the relationships between continuous variables.
The prevalence ratio (PR) and corresponding 95% CI were used to estimate the associations of each dependent variable (obesity, abdominal obesity, high blood pressure, hypercholesterolemia, and hypertriglyceridemia) with the independent variables (short stature or high HHI/disproportionate individuals), both in the crude and adjusted analyses by the covariates (age, smoking, and education level). The PR was estimated using Poisson regression with robust adjustment of variance.
The dependent variables were categorized and analyzed according to the interquartile ranges of the respective continuous variables. However, the results were presented only for comparisons among women below the 25th percentile (first quartile) with those above the 75th percentile (fourth quartile).
In all situations, two-tailed P<0.05 was accepted as statistical significance.
Ethical aspects
This study is part of the II Health Diagnosis of Maternal and Child Population of Alagoas State, which was approved by the Ethics Committee on Human Research of the Federal University of Alagoas (case no 010102/0355). All surveyed women were informed about the study objectives, its risks and benefits, and expressed their agreement to participate by signing an informed consent form.
Results
As shown in Table 2, there were significant correlations between systolic blood pressure, BMI, WHtR, LDLc, and TG, both with stature (cm) and with HHI. However, the correlations with high HHI were stronger in all situations.
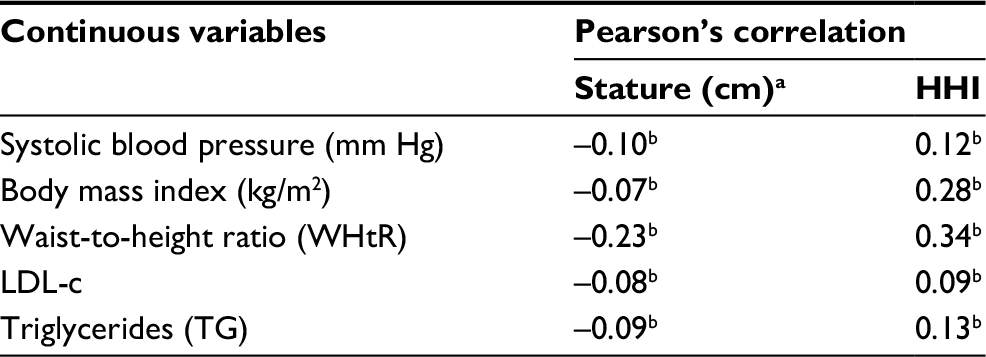 | Table 2 Pearson’s correlation coefficients between the dependent variables and the independent variables: stature (cm) or Head-to-Height Index Notes: aStature ≤153.1 cm (25th percentile), HHI >1.028 (75th percentile); bsignificant correlation (P<0.05). Abbreviation: HHI, Head-to-Height Index; LDL-c, low-density lipoprotein cholesterol. |
Similarly, the data contained in Table 3 also indicate a greater strength of association between the dependent variables and high HHI when compared to short stature. Respectively, the following PRs were observed: obesity: 2.92 (2.42–3.52) vs 1.28 (1.09–1.50); abdominal obesity: 2.44 (2.14–2.77) vs 1.71 (1.52–1.92); high blood pressure: 1.64 (1.35–2.00) vs 1.29 (1.07–1.57); hypercholesterolemia: 3.50 (1.73–7.10) vs 1.87 (1.04–3.34); and hypertriglyceridemia: 1.66 (1.20–2.28) vs 1.02 (0.77–1.35). As seen from the 95% CIs, all associations were statistically significant, except for the prevalence of hypertriglyceridemia among women of short stature.
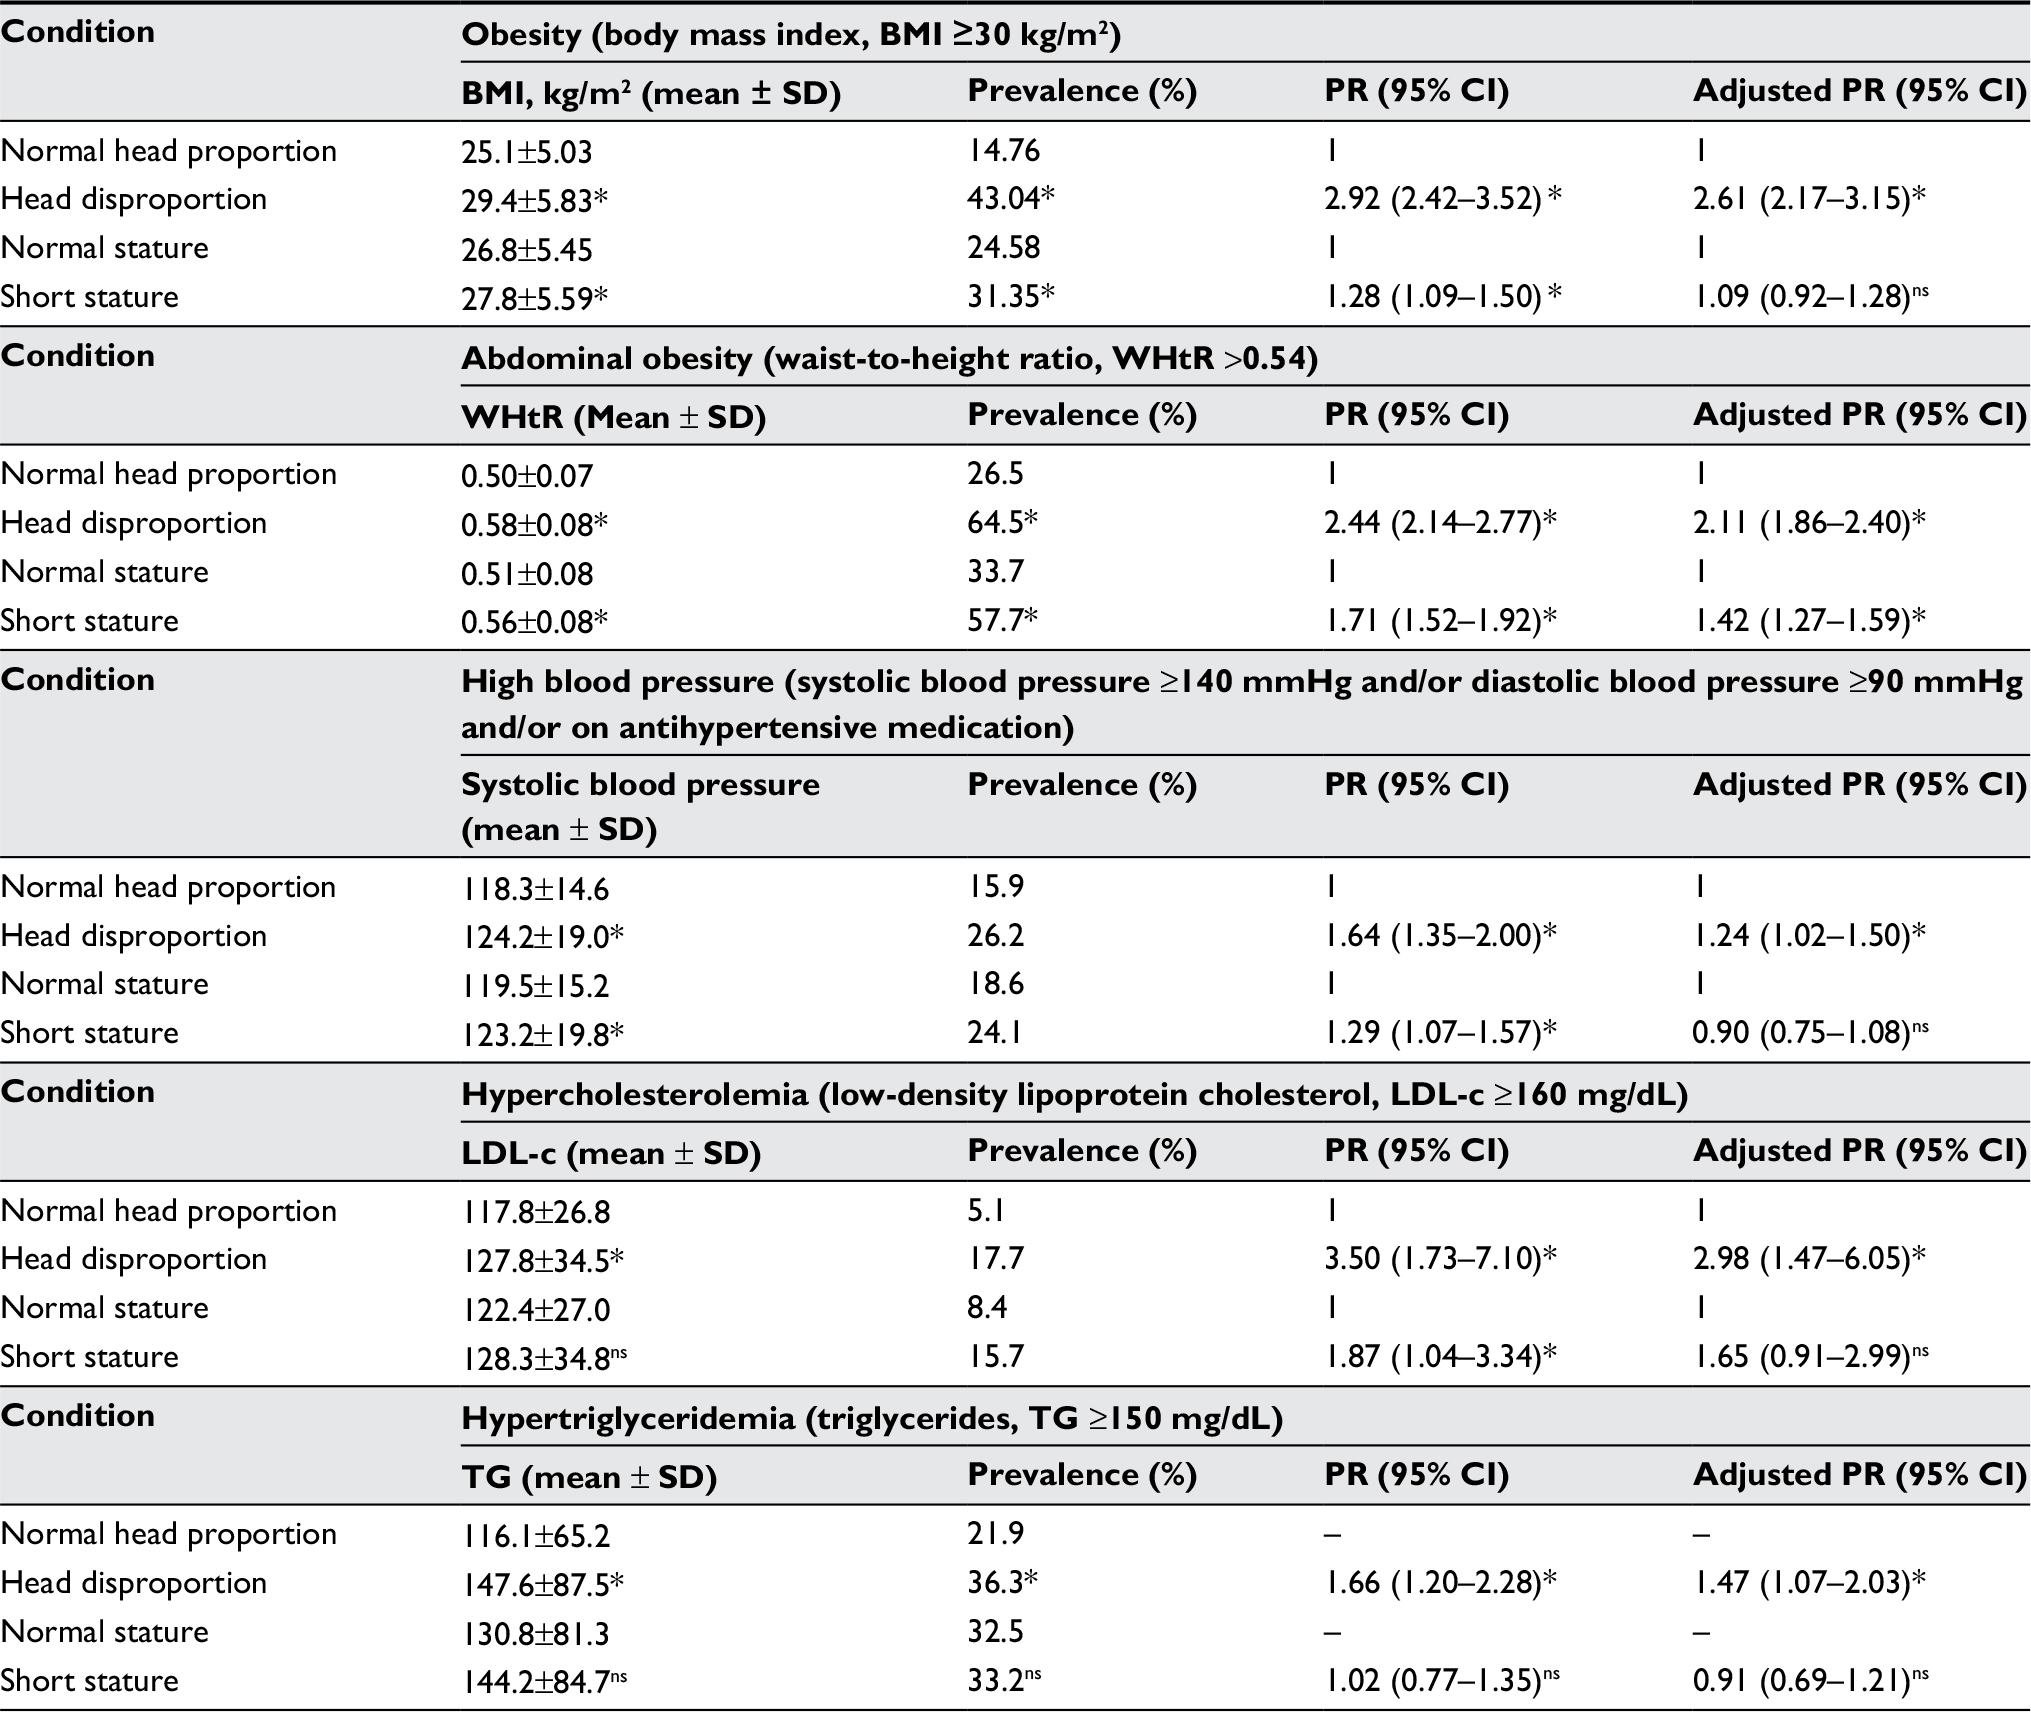 | Table 3 Mean (± SD), prevalence, unadjusted and adjusted prevalence ratio (PR) of anthropometric, biochemical, and health variables, according to two indicators of undernutrition in early life: head disproportiona and short statureb Notes: *Significantly different (P<0.05) from the respective comparison group (normal head proportion or normal stature), according to Bonferroni’s test. aHead disproportion was defined by Head-to-Height Index (HHI) >75th percentile; normal head proportion was defined by HHI ≤25th percentile. bShort stature was defined by height 25th percentile; normal stature was defined by height >75th percentile. Abbreviation: ns, not significant. |
When the PR was adjusted for confounding factors, all associations analyzed in relation to women with high HHI remained statistically significant. On the other hand, for women of short stature, the statistical significance was lost for all outcomes, except for abdominal obesity. Comparing high HHI with short stature, the PRs (and 95% CI) obtained for the outcomes analyzed were, respectively: obesity: 2.61 (2.17–3.15) vs 1.09 (0.92–1.28); abdominal obesity: 2.11 (1.86–2.40) vs 1.42 (1.27–1.59); high blood pressure: 1.24 (1.02–1.50) vs 0.90 (0.75–1.08); hypercholesterolemia: 2.98 (1.47–6.05) vs 1.65 (0.91–2.99); and hypertriglyceridemia: 1.47 (1.07–2.03) vs 0.91 (0.69–1.21).
Discussion
Obesity, abdominal obesity, high blood pressure, and dyslipidemias constitute important risk factors for cardiovascular diseases, which are the leading causes of mortality worldwide.34 All of these conditions are recognized as more prevalent in individuals who suffered undernutrition in early life.11–16,21 The present study reiterates the pertinence of this statement, however, using the model of body disproportionality, which considers that under adverse nutritional conditions in the early stages of growth and development, brain growth is less affected than body growth.23–27,44
Barker et al25 reported that studies of fetal blood flow in animals have shown that in response to hypoxia there is a redistribution of fetal cardiac output, which favors the perfusion of the brain. Results obtained in their studies25 demonstrated that greater placental weight at any birth weight was associated with lower length to head perimeter ratio. They argued that such disproportionate growth is consistent with diversion of blood away from the trunk in favor of the brain. This would be one of the plausible mechanisms to explain how the organism, under nutritional stress, would spare the cerebral growth in detriment of the corporal growth.
Therefore, there is consistency in the proposition that a disproportion between head size and respective height is an indicator of undernutrition in early life and that such disproportionate individuals would be more susceptible to chronic diseases in adulthood. However, it is not the purpose of this publication to discuss the mechanisms that lead to this greater susceptibility. Such discussion is available in several other papers.4,45–47
In cross-sectional epidemiological studies involving adult population, undernutrition in early life has been identified on the basis of retrospective data on low birth weight. When information is obtained by interview, the birth weight is not always available or reliable. Then, current short stature has been used as an indicator of malnutrition in early life, because statural deficit, at population level, is an indicator of chronic malnutrition in the growth phase.3,4,15,47 The data now presented show that, although pertinent, some classification errors occur when using this approach. We believe that the main reasons for this would be the short stature not related to malnutrition, like that of hereditary origin. Then, individuals who did not suffer malnutrition early in life are classified as such, and thus are incorrectly considered to be at greater risk for chronic diseases. In studies where this condition occurs, this fact weakens the associations or even shows no association with the outcomes analyzed. This may explain the fact that, in the adjusted analysis conducted in this study, the associations between short stature and obesity, high blood pressure, hypercholesterolemia, and hypertriglyceridemia lost statistical significance.
In contrast, all of these associations were maintained when the low stature indicator was replaced by high HHI, evidencing the greater accuracy of this last parameter as indicator of undernutrition in early life.
The data used in the present analysis were obtained from a sample composed exclusively of women, which makes extrapolations for male counterparts problematic. However, all assumptions considered in the design of the now proposed indicator (brain-sparing effect against malnutrition during growth phases, greater susceptibility to chronic diseases presented by individuals who suffered malnutrition in early life) are also true for men, as evidenced in the literature.48,49
From conception to the first 2 years of life, the head is the part of the body that grows fastest, reaching more than 80% of the final size reached in adulthood.50,51 Nevertheless, head circumference is the anthropometric measure least affected by nutritional insults in early life when compared to weight and height, independent of ethnic and geographical differences.52
In this study, women whose height was ≤153.1 cm were considered to be of short stature. This cutoff corresponds to the –1.54 z-score of the distribution of height-for-age for women at 19 years of age, according to anthropometric reference data from the World Health Organization. On the other hand, the height corresponding to the 75th percentile (161.0 cm) cutoff point, applied to the investigated sample to designate women of normal height, corresponds to a –0.33 z-score (percentile 6.2) of the WHO reference distribution. In this reference, the height corresponding to the median is 163.2 cm, while 167.6 cm corresponds to the 75th percentile. These data reveal a significant left shift in the distribution of height of the studied women, probably as a consequence of the cumulative effect of malnutrition incidence on these women and their ancestors. As already mentioned, in 1989, the prevalence of chronic undernutrition in pre-school children in Alagoas was higher than that observed in other Brazilian states of better socioeconomic conditions.7 Therefore, the height of adults in Alagoas is below the median of the Brazilian population.10 Populations with such characteristics, that is, with a history of chronic malnutrition, are more suitable for studies on the effects of malnutrition in early life.
In this case, the data now presented suggest that high HHI has more validity as the intended indicator than short stature. While short stature may be merely due to genetic determination, body disproportionality is due to metabolic adaptations to malnutrition.28
Therefore, it is proposed that, instead of short stature, the HHI Index >75th percentile be used as an indicator of undernutrition in early life. This recommendation is relevant for population-based studies involving adult individuals for whom reliable information about birth weight and/or nutritional status in the perinatal period is not available.
Its application may be useful in studies that aim to understand the impact of metabolic programming, that is, the long-term effects resulting from malnutrition in early life, as well as for the planning of interventions, especially those performed during the so-called window of opportunities. In addition, HHI could be used as a screening method, especially for those individuals who have not yet developed obesity, allowing a timely intervention to minimize excess mortality from cardiovascular diseases.
There is strong evidence that the first 1,000 days of life characterize a window of opportunities for interventions for the promotion of infant nutrition and health, constituting a way of effectively breaking the intergenerational cycle of chronic malnutrition, fetal programming, and its consequences related to metabolic disorders in adult life, especially in the context of less developed countries.53,54
Acknowledgments
This work is part of the II Diagnosis of Maternal and Child Health of the Population of Alagoas State, carried out with funds from Brazilian National Council for Scientific and Technological Development – CNPq (grant number 474381/2011-0), and Foundation of Research Support of Alagoas State – FAPEAL (grant number 20110818-006-0018-0017). HSF is a research fellow of the CNPq (grant number 302732/2015-2).
Disclosure
The authors report no conflicts of interest in this work.
References
Suzuki K. The developing world of DOHaD. J Dev Orig Health Dis. 2018;9(3):266–269. | ||
Uauy R, Kain J, Corvalan C. How can the Developmental Origins of Health and Disease (DOHaD) hypothesis contribute to improving health in developing countries? Am J Clin Nutr. 2011;94(Suppl 6):1759S–1764S. | ||
Wadhwa PD, Buss C, Entringer S, Swanson JM. Developmental origins of health and disease: brief history of the approach and current focus on epigenetic mechanisms. Semin Reprod Med. 2009;27(5):358–368. | ||
Hoffman DJ. Growth retardation and metabolic programming: implications and consequences for adult health and disease risk. J Pediatr. 2014;90(4):325–328. | ||
Golden MH. The nature of nutritional deficiency in relation to growth failure and poverty. Acta Paediatr Scand Suppl. 1991;374:95–110. | ||
PNUD (Programa das Nações Unidas Para oDesenvolvimento). Atlas do Desenvolvimento Humano no Brasil [Atlas of Human Development in Brazil]. Brasília: PNUD; 2013. Portugese. Available from: http://www.atlasbrasil.org.br/2013/. Accessed May 11, 2018. | ||
Monteiro CA. Dimensão da Pobreza da fome e da desnutrição no Brasil [Dimension of Poverty, Hunger and Malnutrition in Brazil]. Estudos Avançados. 1995;9:195–207. Portugese. | ||
Langley-Evans SC. Nutrition in early life and the programming of adult disease: a review. J Hum Nutr Diet. 2015;28(Suppl 1):1–14. | ||
Harding JE. The nutritional basis of the fetal origins of adult disease. Int J Epidemiol. 2001;30(1):15–23. | ||
Ferreira HDS, Silva WO, Santos EAD, Bezerra MKDA, da Silva BCV, Horta BL. Body composition and hypertension: a comparative study involving women from maroon communities and from the general population of Alagoas State, Brazil. Rev Nutr. 2013;26(5):539–549. | ||
Ferreira HS, Florêncio TT, Fragoso MC, Melo FP, Silva TG. Hipertensão, obesidade abdominal e baixa estatura: aspectos da transição nutricional em uma população favelada [Hypertension, abdominal obesity and short stature: aspects of nutritional transition within a shantytown in the city of Maceió, Northeastern Brazil]. Revista de Nutrição. 2005;18:209–218. Portugese. | ||
Florêncio TT, Ferreira HS, Cavalcante JC, Sawaya AL, Stature S. Short stature, obesity and arterial hypertension in a very low income population in North-eastern Brazil. Nutr Metab Cardiovasc Dis. 2004;14(1):26–33. | ||
Florêncio TT, Ferreira HS, Cavalcante JC, Luciano SM, Sawaya AL. Food consumed does not account for the higher prevalence of obesity among stunted adults in a very-low-income population in the Northeast of Brazil (Maceió, Alagoas). Eur J Clin Nutr. 2003;57(11):1437–1446. | ||
Florêncio TT, Ferreira HS, Cavalcante JC, Stux GR, Sawaya AL, Stature S. Short stature, abdominal obesity, insulin resistance and alterations in lipid profile in very low-income women living in Maceió, north-eastern Brazil. Eur J Cardiovasc Prev Rehabil. 2007;14(2):346–348. | ||
Ferreira HS, Moura FA, Cabral CR, Florêncio TM, Vieira RC, de Assunção ML. Short stature of mothers from an area endemic for undernutrition is associated with obesity, hypertension and stunted children: a population-based study in the semi-arid region of Alagoas, Northeast Brazil. Br J Nutr. 2009;101(8):1239–1245. | ||
Ferreira HDS, Luna AA, Florêncio T, Assunção ML, Horta BL. Short stature is associated with overweight but not with high energy intake in low-income Quilombola women. Food Nutr Bull. 2017;38(2):216–225. | ||
Paajanen TA, Oksala NK, Kuukasjärvi P, Karhunen PJ. Short stature is associated with coronary heart disease: a systematic review of the literature and a meta-analysis. Eur Heart J. 2010;31(14):1802–1809. | ||
Sichieri R, dos Santos Barbosa F, Moura EC. Relationship between short stature and obesity in Brazil: a multilevel analysis. Br J Nutr. 2010;103(10):1534–1538. | ||
Alexander BT, Henry Dasinger J, Intapad S. Effect of low birth weight on women’s health. Clin Ther. 2014;36(12):1913–1923. | ||
Yuan ZP, Yang M, Liang L, et al. Possible role of birth weight on general and central obesity in Chinese children and adolescents: a cross-sectional study. Ann Epidemiol. 2015;25(10):748–752. | ||
Spracklen CN, Ryckman KK, Robinson JG, et al. Low birth weight and risk of later-life physical disability in women. J Gerontol A Biol Sci Med Sci. 2017;72(4):543–547. | ||
Prendergast AJ, Humphrey JH. The stunting syndrome in developing countries. Paediatr Int Child Health. 2014;34(4):250–265. | ||
Kramer MS, Olivier M, Mclean FH, Willis DM, Usher RH. Impact of intrauterine growth retardation and body proportionality on fetal and neonatal outcome. Pediatrics. 1990;86(5):707–713. | ||
Kramer MS, Mclean FH, Olivier M, Willis DM, Usher RH. Body proportionality and head and length “sparing” in growth-retarded neonates: a critical reappraisal. Pediatrics. 1989;84(4):717–723. | ||
Barker DJ, Bull AR, Osmond C, Simmonds SJ. Fetal and placental size and risk of hypertension in adult life. BMJ. 1990;301(6746):259–262. | ||
Streja E, Miller JE, Wu C, et al. Disproportionate fetal growth and the risk for congenital cerebral palsy in singleton births. PLoS One. 2015;10(5):e0126743. | ||
Leão Filho JC, de Lira PI. Study of body proportionality using Rohrer s Ponderal Index and degree of intrauterine growth retardation in full-term neonates. Cad Saude Publica. 2003;19(6):1603–1610. | ||
Barker DJ, Clark PM. Fetal undernutrition and disease in later life. Rev Reprod. 1997;2(2):105–112. | ||
Costa NS, Santos MO, Carvalho CPO, Assunção ML, Ferreira HS. Prevalence and factors associated with food insecurity in the context of the economic crisis in Brazil. Curr Dev Nutr. 2017;1(10):e000869. | ||
IBGE – Instituto Brasileiro de Geografia e Estatística. Population Estimated; 2017. Available from: http://www.ibge.gov.br/estadosat/perfil.php?sigla=al. Accessed May 11, 2018. | ||
IBGE (Instituto Brasileiro de Geografia e Estatística). Pesquisa Nacional por Amostra de Domicílios – Segurança Alimentar 2013 [National Household Sample Survey - Food Security 2013]. Rio de Janeiro: IBGE; 2014. Portugese. | ||
World Health Organization. Physical Status: The Use and Interpretation of Anthropometry. Technical Report Series, 854. Geneva: WHO; 1995. | ||
Gale CR, O’Callaghan FJ, Bredow M, Martyn CN; Avon Longitudinal Study of Parents and Children Study Team. The influence of head growth in fetal life, infancy, and childhood on intelligence at the ages of 4 and 8 years. Pediatrics. 2006;118(4):1486–1492. | ||
Caminha TC, Ferreira HS, Costa NS, et al. Waist-to-height ratio is the best anthropometric predictor of hypertension: a population-based study with women from a state of northeast of Brazil. Medicine. 2017;96(2):e5874. | ||
Wang N, Wang X, Li Q, et al. The famine exposure in early life and metabolic syndrome in adulthood. Clin Nutr. 2017;36(1):253–259. | ||
Alexander BT. The impact of nutritional insults during fetal life on blood pressure. J Nutr Sci Vitaminol. 2015;61(61 Suppl):S5–S6. | ||
Bacardí Gascón M, Jiménez Morán E, Santillana Marín E, Jimenez Cruz A. Effect of pre- and post-natal undernutrition on components of metabolic syndrome later in life; systematic review. Nutr Hosp. 2014;29(5):997–1003. | ||
Whelton PK, Carey RM, Aronow WS, et al. 2017 ACC/AHA/AAPA/ABC/ACPM/AGS/APhA/ASH/ASPC/NMA/PCNA guideline for the prevention, detection, evaluation, and management of high blood pressure in adults: executive summary: a report of the American College of Cardiology/American Heart Association Task Force on Clinical Practice Guidelines. Hypertension. 2018;71(6):1269–1324. | ||
Ab Majid NL, Omar MA, Khoo YY, et al. Prevalence, awareness, treatment and control of hypertension in the Malaysian population: findings from the National Health and Morbidity Survey 2006-2015. J Hum Hypertens. Epub 2018 Jun 13. | ||
Zhang Y, Moran AE. Trends in the prevalence, awareness, treatment, and control of hypertension among young adults in the United States, 1999 to 2014. Hypertension. 2017;70(4):736–742. | ||
Chobanian AV, Bakris GL, Black HR, et al. The Seventh Report of the Joint National Committee on prevention, detection, evaluation, and treatment of high blood pressure: the JNC 7 report. JAMA. 2003;289(19):2560–2572. | ||
Weinhold KR, Miller CK, Marrero DG, Nagaraja HN, Focht BC, Gascon GM. A randomized controlled trial translating the Diabetes Prevention Program to a University Worksite, Ohio, 2012-2014. Prev Chronic Dis. 2015;12:E210. | ||
Faludi AA, Izar MCO, Saraiva JFK. Atualização da Diretriz Brasileira de Dislipidemias e Prevencao da Aterosclerose - 2017 [Update of the Brazilian Guidelines of Dislipidemias and Atherosclerosis Prevention]. Arq Bras Cardiol. 2017;109(2 Supl 1):1–76. Portugese. | ||
Barker DJ, Osmond C, Simmonds SJ, Wield GA. The relation of small head circumference and thinness at birth to death from cardiovascular disease in adult life. BMJ. 1993;306(6875):422–426. | ||
Hales CN, Barker DJ, Type BD. Type 2 (non-insulin-dependent) diabetes mellitus: the thrifty phenotype hypothesis. 1992. Int J Epidemiol. 2013;42(5):1215–1222. | ||
Martins VJ, Toledo Florêncio TM, Grillo LP, et al. Long-lasting effects of undernutrition. Int J Environ Res Public Health. 2011;8(6):1817–1846. | ||
Waterland RA, Garza C. Potential mechanisms of metabolic imprinting that lead to chronic disease. Am J Clin Nutr. 1999;69(2):179–197. | ||
Andersen LG, Ängquist L, Eriksson JG, et al. Birth weight, childhood body mass index and risk of coronary heart disease in adults: combined historical cohort studies. PLoS One. 2010;5(11):e14126. | ||
Kopec G, Shekhawat PS, Mhanna MJ. Prevalence of diabetes and obesity in association with prematurity and growth restriction. Diabetes Metab Syndr Obes. 2017;10:285–295. | ||
Rollins JD, Collins JS, Holden KR. United States head circumference growth reference charts: birth to 21 years. J Pediatr. 2010;156(6): 907–913.e2. | ||
Morgan C, Mcgowan P, Herwitker S, Hart AE, Turner MA. Postnatal head growth in preterm infants: a randomized controlled parenteral nutrition study. Pediatrics. 2014;133(1):e120–e128. | ||
Gotthelf SJ, Jubany LL. Evolución del perímetro cefálico en niños desnutridos de bajo nivel socioeconómico durante el tratamiento de recuperación nutricional [Evolution of head circumference in undernourished children of low socioeconomic status during the nutritional recovery treatment]. Archivos Argentinos de Pediatria. 2002;100(3):204–209. Spanish. Available from: https://www.sap.org.ar/docs/publicaciones/archivosarg/2002/204.pdf. Accessed May 11, 2018. | ||
Prentice AM, Ward KA, Goldberg GR, et al. Critical windows for nutritional interventions against stunting. Am J Clin Nutr. 2013;97(5):911–918. | ||
Pietrobelli A, Agosti M, MeNu Group. Nutrition in the first 1000 days: ten practices to minimize obesity emerging from published science. Int J Environ Res Public Health. 2017;14(12):1491. |
 © 2018 The Author(s). This work is published and licensed by Dove Medical Press Limited. The full terms of this license are available at https://www.dovepress.com/terms.php and incorporate the Creative Commons Attribution - Non Commercial (unported, v3.0) License.
By accessing the work you hereby accept the Terms. Non-commercial uses of the work are permitted without any further permission from Dove Medical Press Limited, provided the work is properly attributed. For permission for commercial use of this work, please see paragraphs 4.2 and 5 of our Terms.
© 2018 The Author(s). This work is published and licensed by Dove Medical Press Limited. The full terms of this license are available at https://www.dovepress.com/terms.php and incorporate the Creative Commons Attribution - Non Commercial (unported, v3.0) License.
By accessing the work you hereby accept the Terms. Non-commercial uses of the work are permitted without any further permission from Dove Medical Press Limited, provided the work is properly attributed. For permission for commercial use of this work, please see paragraphs 4.2 and 5 of our Terms.