")
Back to Journals » International Journal of Nanomedicine » Volume 12
Development of solid lipid nanoparticles containing total flavonoid extract from Dracocephalum moldavica L. and their therapeutic effect against myocardial ischemia–reperfusion injury in rats
Authors Tan ME, He CH, Jiang W, Zeng C, Yu N, Huang W, Gao ZG, Xing JG
Received 7 January 2017
Accepted for publication 28 February 2017
Published 19 April 2017 Volume 2017:12 Pages 3253—3265
DOI https://doi.org/10.2147/IJN.S131893
Checked for plagiarism Yes
Review by Single anonymous peer review
Peer reviewer comments 2
Editor who approved publication: Professor Lei Yang
Mei-e Tan,1–3,* Cheng-hui He,3,* Wen Jiang,4 Cheng Zeng,2–4 Ning Yu,3 Wei Huang,2 Zhong-gao Gao,2 Jian-guo Xing3
1Key Laboratory of Xinjiang Endemic Phytomedicine Resources of Ministry of Education, School of Pharmacy, Shihezi University, Shihezi, 2State Key Laboratory of Bioactive Substance and Function of Natural Medicines, Department of Pharmaceutics, Institute of Materia Medica, Chinese Academy of Medical Sciences and Peking Union Medical College, Beijing, 3Xinjiang Key Laboratory of Uighur Medicines, Xinjiang Institute of Materia Medica, 4Xinjiang Medical University, Urumqi, People’s Republic of China
*These authors contributed equally to this work
Abstract: Total flavonoid extract from Dracocephalum moldavica L. (TFDM) contains effective components of D. moldavica L. that have myocardial protective function. However, the cardioprotection function of TFDM is undesirable due to its poor solubility. In order to improve the solubility and efficacy of TFDM, we developed TFDM-loaded solid lipid nanoparticles (TFDM-SLNs) and optimized the formulation of TFDM-SLNs using central composite design and response surface methodology. The physicochemical properties of TFDM-SLNs were characterized, and the pharmacodynamics was investigated using the myocardial ischemia–reperfusion injury model in rats. The nanoparticles of optimal formulation for TFDM-SLNs were spherical in shape with the average particle size of 104.83 nm and had a uniform size distribution with the polydispersity index value of 0.201. TFDM-SLNs also had a negative zeta potential of -28.7 mV to ensure the stability of the TFDM-SLNs emulsion system. The results of pharmacodynamics demonstrated that both TFDM and TFDM-SLN groups afforded myocardial protection, and the protective effect of TFDM-SLNs was significantly superior to that of TFDM alone, based on the infarct area, histopathological examination, cardiac enzyme levels and inflammatory factors in serum. Due to the optimal quality and the better myocardial protective effect, TFDM-SLNs are expected to become a safe and effective nanocarrier for the oral delivery of TFDM.
Keywords: solid lipid nanoparticles, Dracocephalum moldavica L., high-shear homogenization, myocardial ischemic–reperfusion injury, pharmacodynamics
Introduction
Dracocephalum moldavica L. is a plant of the family Labiatae, also known as Yixin Badi Ran Gibuya. It has the functions of purging fire, clearing heat and stopping bleeding. D. moldavica L. has a wide range of pharmacological effects, especially against coronary heart disease, hypertension, atherosclerosis and other cardiovascular diseases. The total flavonoid extract from D. moldavica L. (TFDM) contains the effective and active components responsible for the pharmacological action of Dracocephalum L.1–4 It is mainly composed of three ingredients, including rosmarinic acid, tilianin and luteolin with proportions of 15.95%, 7.09% and 6.86%, respectively. However, similar to most flavonoids, TFDM has poor solubility and low bioavailability, which greatly limit its clinical efficacy.5,6 Therefore, the research and development of oral nanoformulations of TFDM with a higher efficiency have important significance and application prospects in the future.
Solid lipid nanoparticles (SLNs) are a novel nanodrug delivery system developed in the 1990s and have attracted increasing attention as a promising drug delivery system to enhance oral bioavailability for poorly soluble drugs. It has been reported that the mechanism by which SLNs promote oral absorption is that SLNs can be absorbed by the small intestinal epithelial cells after lipolysis. After oral administration, SLNs cannot be absorbed in their intact form but could be lipolysed in the gastrointestinal tract.7,8 During lipolysis, triglycerides are regularly digested into monoglycerides and fatty acids. The extent and rate of lipolysis are influenced by the gastric emptying rate, presence of lipolysis inhibitors and the percentage of oil and fat inherent in the body; the monoglycerides and fatty acids form mixed micelles through self-assembly with phospholipids and bile salts secreted in vivo. Consequently, most of the drug encapsulated in nanoparticles is transferred to the epithelial cells through the unstirred water layer during the lipolysis process and is then absorbed by the intestinal epithelial cells in the form of mixed micelles or free molecules by passive diffusion, which leads to the enhancement of oral bioavailability.7–10 Certainly, SLNs can also improve the bioavailability of insoluble drugs by other routes, including improving the dissolution process of nonaqueous drugs to increase the latter’s solubility as well as promoting the drug absorption, transport and distribution due to their nanometer-scale particle size.11 Moreover, SLNs also have a variety of advantages, including nontoxic side effects, sustained and controlled release, targeted delivery and beneficial large-scale production, as well as improving the stability of unstable substances.12 SLNs are suitable for various routes of administration, such as intravenous, oral, topical (skin), transocular (eyes) and transalveolar (lungs) modes.13 In addition, the SLNs emulsion system can be lyophilized to ensure long-term stability of SLNs.14,15
Myocardial ischemia–reperfusion injury (MIRI) is a cardiovascular disease induced by myocardial ischemia and reperfusion of the left anterior descending coronary artery.16 MIRI is a complicated process that is associated with various factors and mechanisms, including oxidative damage, necrosis, apoptosis, inflammation, energy metabolism disruption and calcium overload.17–21 All of these conditions could lead to the apoptosis of heart cells, mitochondrial injury and elevation of levels of cardiac enzymes and inflammation factors. Since 2013, the number of deaths caused by MIRI has increased remarkably, and therefore, the treatment of MIRI is one of the most significant problems that needs to be solved.
The aim of this study was to prepare TFDM-SLNs using high-shear homogenization, followed by ultrasonication, and to optimize the formulation of TFDM-SLNs using the central composite design and response surface method (CCD-RSM). The physicochemical properties of TFDM-SLNs were measured, and the MIRI model in rats was used to investigate the pharmacodynamics of TFDM-SLNs.
Materials and methods
Materials
TFDM, tilianin (purity >98%), luteolin (purity >98%) and rosmarinic acid (purity >98%) were provided by Xinjiang Institute of Materia Medica (Urumqi, China). Compritol® 888 ATO (glyceryl behenate) was provided by Gattefossé (Gennevilliers, France). Soy lecithin was purchased from Shanghai Advanced Vehicle Technology Pharmaceutical Ltd (Shanghai, China). Tween-80 was obtained from Kermel Chemical Reagent Development Center (Tianjin, China); 10% hydrochloroaldehyde was purchased from Xuanwu Hospital (Beijing, China); 2,3,5-triphenyl-2H-tetrazolium chloride (TTC) was purchased from Sinopharm Chemical Regent Co, Ltd (Shanghai, China); lactate dehydrogenase (LDH), creatine kinase (CK), interleukin (IL)-1β and tumor necrosis factor (TNF)-α kits were purchased from Jiancheng Bioengineering Institute (Nanjing, China). The other reagents used in this study were of analytical grade.
Preparation of TFDM-SLNs
The technique of high-shear homogenization followed by ultrasonication was used to prepare TFDM-SLNs. The prescribed amount of TFDM, soy lecithin and Compritol 888 ATO were dissolved in a certain amount of ethanol and then heated to 85°C in a water bath to form a lipid phase; a certain amount of Tween-80 was dissolved in an appropriate amount of distilled water and heated to the same temperature of the lipid phase to form an aqueous phase. The aqueous phase was added into the lipid phase with magnetic stirring and then homogenized at 12,000 rpm for 5 min using a high-speed Ultra Turrax D-500 homogenizer (Wiggens Labor technik GmbH, BerLin, Germany) to form a suspension. The suspension was ultrasonicated using an ultrasonic cell crusher (Ningbo Biological Technology Co, Ltd, Ningbo, China) at 300 W for 5 min. The TFDM-SLN emulsion system was formed and stored at 4°C.
Optimization of TFDM-SLN formulation
CCD-RSM was used to optimize the formulation of TFDM-SLNs.22,23 Since luteolin, rosmarinic acid and tilianin are the main active ingredients of TFDM, the three main ingredients were investigated as the index to optimize the nanoparticles. According to preliminary experiments, the main independent variables that affected the properties of SLNs in the desired formulation were the drug/lipid ratio, soy lecithin/lipid ratio and the concentration of Tween-80. In this study, all the data were determined three times and reported as mean ± standard deviation (SD). Three factors and four response parameters were used to study the effects of different variables on formulation properties. Independent variables in this study included drug/lipid ratio (w/w) (A), soy lecithin/lipid ratio (w/w) (B) and surfactant concentration (C). The four response parameters consisted of the mean particle size (Y1), entrapment efficiency (EE) of luteolin (Y2), EE of rosmarinic acid (Y3) and EE of tilianin (Y4) of TFDM-SLNs. The four-level values of each parameter investigated are shown in Table 1. The independent factors evaluated and the response values are shown in Table 2. Three-dimensional (3D) surface plots were used to establish the relationship between independent variables and dependent variables. The desirability function of particle size was at the minimum level while the three EEs were at the maximum level, which was used to optimize the formulation. The optimal formulation was determined by the P-value, and the values of predicted R2 and analysis of variance (ANOVA) were derived to confirm the optimal formulation. Data were calculated and analyzed using Design-Expert 8.05 (Stat-Ease. Inc., Minneapolis, Minnesota, USA).
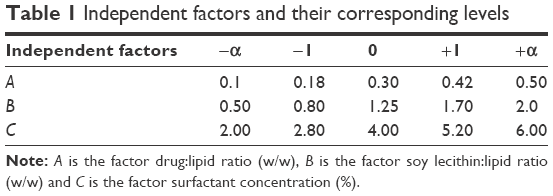 | Table 1 Independent factors and their corresponding levels |
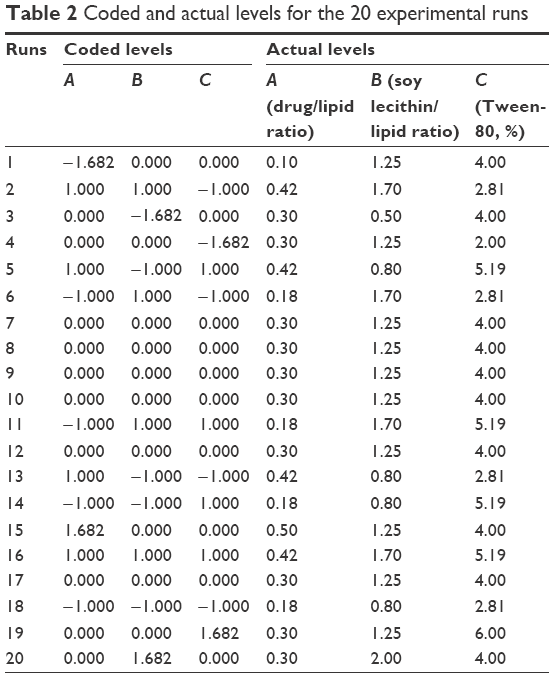 | Table 2 Coded and actual levels for the 20 experimental runs |
Transmission electron microscopy (TEM) measurement
The surface morphology and shape of the optimized TFDM-SLNs were analyzed by TEM (JEM-1200EX; Jeol, Tokyo, Japan). The sample was diluted with double-distilled water and then placed on copper grids coated with carbon film before negative staining with 2% (w/v) sodium phosphotungstic acid solution for observation.24
Particle size analysis
The mean particle size, polydispersity index (PDI) and zeta potential of the nanoparticles were measured by the dynamic light scattering technique using zetasizer (Nano ZS90; Malvern Instruments, Malvern, UK) at 25°C with a scattering angle of 90°. The SLN dispersion was distilled and filtered (0.45 μm) before measurement. All measurements were carried out in triplicate.25
EE and drug loading (DL)
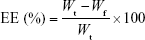
The EEs of luteolin, rosmarinic acid and tilianin, along with DL of tilianin, were determined by ultracentrifugation. For this, 0.5 mL of TFDM-SLNs was added into ultrafiltration tubes (30 k molecular weight cutoff) and then centrifuged at 12,000 rpm for 30 min at 4°C. The amount of unincorporated luteolin, rosmarinic acid and tilianin in the filtered aqueous solution was determined by high-performance liquid chromatography (HPLC). Next, 0.5 mL of nanoparticle dispersion was disrupted in triple the volume of methanol via ultrasonication and centrifuged for 10 min at 8,000 rpm; the total amount of luteolin, rosmarinic acid and tilianin added to the formulation was determined by HPLC. Values of EE and DL were calculated using the following equations:
|
|
|
|
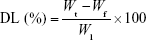
where Wt is the total amount of drug added into the formulation, Wf is the amount of free drug and Wl is the weight of lipid.
The HPLC assay was carried out on an Agilent HPLC device (Agilent Series 1260, Palo Alto, CA, USA). A C18 reversed-phase column (ACE 5-C18 250×4.6 mm) was used as the stationary phase. The mobile phase consisted of a 30:70 (v/v) mixture of acetonitrile/0.5% formic acid. The flow rate and ultraviolet (UV) wavelength were 1 mL·min−1 and 330 nm, respectively.26
Differential scanning calorimetry (DSC)
The physical state of the TFDM-SLNs was determined using the DSC6200 (Seiko Instruments Inc, Japan). Samples (4 mg) of TFDM, Compritol 888 ATO, blank SLNs and TFDM-SLNs were placed in aluminum pans and investigated, while an empty pan was used as a reference in this process. The temperature was changed from 20°C to 300°C with a heating rate of 10°C·min−1 under nitrogen gas flow.
In vitro drug release of TFDM-SLNs
The drug release of TFDM-SLNs in vitro was investigated by the dialysis bag method and the content of tilianin was used as an index. The dispersion was added into a dialysis bag (Dialysis membrane-70; Himedia; molecular weight cutoff: 12,000–14,000 Da; pore size: 2.4 nm). The dialysis bag was placed in a conical flask with 200 mL phosphate-buffered saline (PBS; pH 6.8), and the conical flask was placed in a thermostatic shaker and shaken at 80 rpm for 48 h. Then, 2 mL of sample was taken at regular intervals, and an equal amount of fresh PBS (pH 6.8) was added into the dialysis bag.27 The samples were analyzed by HPLC method, as mentioned earlier. The accumulated release was calculated using the following equation, and the release curve was drawn:
|
|

where Qn represents the cumulative release of the n-th sampling point, C represents the solution concentration, Cn represents the concentration of the n-th sampling point, V0 represents the volume of release medium and V represents the volume of each sample.
Animals
Male SPF Sprague–Dawley rats (240–260 g) were purchased from Beijing Vital River Laboratory Animal Technology Co, Ltd (Beijing, China). The study was approved by the Institute of Materia Medica of the Chinese Academy of Medical Sciences (CAMS) and Peking Union Medical College (PUMC). All animal experiments were approved by the Laboratory Animal Ethics Committee of the Institute of Materia Medica in CAMS and PUMC. Furthermore, the operational procedures of the animal experiments abided by Administration Regulations on Laboratory Animals of Beijing Municipality.
SLN administration
Rats were randomly divided into five groups (n=20), including sham group, MIRI group, positive drug control group, TFDM group and TFDM-SLNs group. The sham group and MIRI group were administered 2 mL of normal saline, and the positive drug control group was administered compound Danshen dripping pill (CDDP). The TFDM group and TFDM-SLN group were administered TFDM and TFDM-SLNs separately. All the rats were administered the chosen drug every day at the same time, and the MIRI model was prepared on the eighth day after 30 min of administration.
Establishment of MIRI model
Rats were anesthetized with 10% hydrochloroaldehyde by intraperitoneal injection. Then they were intubated by the orotracheal route, and the left part of the chest between the third and fourth intercostal regions was opened via blunt separation; then, the left anterior descending coronary artery under the auricula sinistra was ligated over a length of 2 mm using a 3-0 suture needle to create an ischemic model. After 30 min of ischemia, the needle was loosened to let the blood circulate and the chest was closed. After 24 h of reperfusion, the blood was obtained from the celiac artery and the heart was separated. All the samples were stored at −20°C before analysis.
Electrocardiogram (ECG) measurement
The success of the model was monitored by multiple physiological recording instruments through monitoring the changes of the S–T segment. The ECG was used during the whole process to investigate the changes in the physiology of the rats.
Infarct size measurement
The infarct size was determined by 1% TTC staining. The heart separated after reperfusion was frozen for 20 min and then cut into 2-mm slices from the apex toward the base of the heart. Then the heart slices were stained with 1% TTC in the dark (37°C) for 10–15 min before being fixed with neutral formaldehyde. The red area of the heart was the normal area, and the white area was the infarct area. Photographs of the stained hearts were taken with a digital camera (Nikon, Tokyo, Japan), and the infarct area of each slice was calculated using the ImageJ analysis software.
Histopathological examination of myocardium
The hearts were excised immediately after reperfusion and fixed with 10% neutral formaldehyde solution; then, they were embedded in paraffin. The embedded hearts were then cut into 5 μm thick slices and stained with hematoxylin and eosin (HE). Stained sections of the tissue were observed under a microscope at 40× magnification.
Measurement of cardiac enzymes in serum
The serum was diluted to the corresponding multiple; then, the activities of LDH and CK in the serum were investigated using the corresponding commercial kits according to the manufacturers’ instructions.
Measurement of inflammatory factors in serum
The contents of IL-1β and TNF-α in the serum were determined using the corresponding enzyme-linked immunosorbent assay (ELISA) kits, according to manufacturers’ instruction.
Statistical analysis
All data were analyzed with GraphPad Prism 5.0 (version 5.0.0.0; Graphpad Software. Inc, San Diego, California, USA) and SPSS (version 4.0.100.1124; IBM Corporation, Armonk, NY, USA) software and are shown as mean values ± SD. Statistical comparisons were performed to determine group difference through ANOVA. Significant difference between two groups was evaluated by the Student’s t-test. Statistical significance was set as follows: P<0.05, P<0.01, and P<0.001.
Results and discussion
Preparation of SLNs
The influence of lipids on SLNs is extremely complex and longer-chain lipid molecules and higher oil phase viscosity may result in a larger particle size. Complex lipid materials also can obtain higher EE and DL due to their disordered crystal type. In this study, Compritol 888 ATO is used as a solid lipid. Compritol 888 ATO is derived from behenate and glycerol, and it consists of behenic acid monoglyceride, diglyceride and triglyceride, which have different chain lengths, forms and less-perfect crystals to provide more space to accommodate the drugs. Due to its high melting point, amphiphilic Compritol 888 ATO is more likely to be introduced into the preparation of nanoparticles. Since Compritol 888 ATO is a mixture of three kinds of glycerides, a defective lattice structure is formed, which makes it a suitable carrier material with higher compatibility and effectiveness.28 Emulsifiers play an important role in the optimal formulation of SLNs; they can act on the interface of oil–water surfaces, which can affect the surface properties of SLNs in many ways, such as reducing surface tension, promoting particle separation, reducing particle aggregation and stabilizing the SLN emulsion.29,30 Emulsifier molecules can be inserted into the lattice, which can influence the lattice degree of order and slow down crystal transition to stabilize the nanoparticles. Moreover, compared to a single emulsifier, mixture of emulsifiers can significantly reduce particle size and improve the stability of SLNs.31–33 Soy lecithin and Tween-80 were used as surfactant and cosurfactant in the experiment. Tween-80 is commonly used as an emulsifier, stabilizer and transparency agent. As an emulsifier, soy lecithin can lead to a smaller particle size, higher DL and better stability due to its ability to increase the film strength.
The methods of preparing SLNs mainly include high-pressure homogenization, microemulsification, solvent emulsion evaporation method, film ultrasonication dispersion method, ultrasonic melt emulsification and high-shear homogenization followed by ultrasonication.34 In order to improve the efficiency and conserve material, the SLNs were prepared by high-shear homogenization followed by ultrasonication. The results showed that high-shear homogenization followed by ultrasonication can produce a stable, clear and transparent SLN dispersion. Hence, the method of high-shear homogenization followed by ultrasonication was selected. It is seen that homogenization can make the particle size reach a nanometer level, but it can also lead to numerous bubbles and atomization due to the high speed. The force hole formed by probe ultrasonication can not only allow uniform dispersion of nanoparticles but also overcome the defects caused by high-shear homogenization.35 Therefore, high-shear homogenization followed by ultrasonication is a simple, reliable and feasible method to prepare SLNs.
Optimization of TFDM-SLNs
The most important parameters to be considered in the formulation of SLNs are high EE and DL of the nanoparticles. EE and DL were determined by the solubility of drug in the lipid phase, the physical and chemical properties of the solid lipid and the interaction between the molten drug and lipid.36 In this part, the particle size and EE of the three ingredients were investigated to optimize the formulation of TFDM-SLNs.
The optimized TFDM-SLN composition and response values are listed in Table 3. To obtain high-quality and stable TFDM-SLNs with minimum size and high EE, different percentages of drug, soy lecithin and Tween-80, as well as their effects on particle size and EE, were measured. A mean particle size of ~104 nm was obtained by reducing soy lecithin and increasing surfactant concentration; the EE was also increased, respectively.
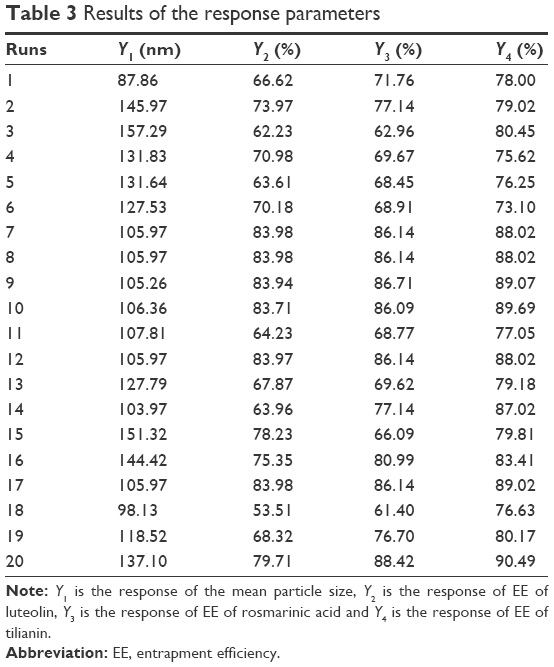 | Table 3 Results of the response parameters |
The responses Y1 (particle size), Y2 (EE of luteolin), Y3 (EE of rosmarinic acid) and Y4 (EE of tilianin) ranged from 87.86 nm to 157.29 nm, from 53.51% to 83.98%, from 61.40% to 88.42% and from 73.14% to 90.49%, respectively. The observed and predicted values of Y1, Y2, Y3 and Y4 are listed in Table 4.
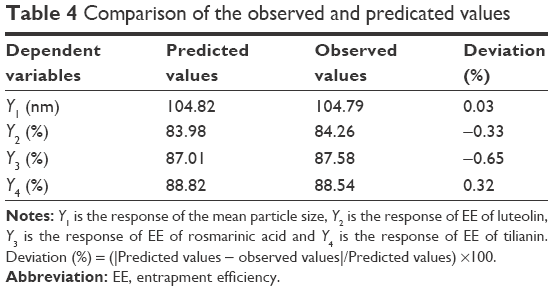 | Table 4 Comparison of the observed and predicated values |
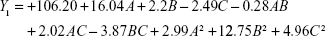
The experimental results were fitted using linear and nonlinear equations, according to the value of R2 and P; the two-polynomial fitting was better. The quadratic equations generated for different responses are as follows:
The model equation of Y1 (particle size):
|
|
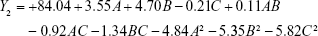
The model equation of Y2 (EE of luteolin):
|
|
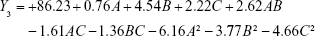
The model equation of Y3 (EE of rosmarinic acid)
|
|
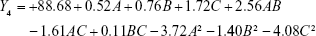
The model equation of Y4 (EE of tilianin)
|
|
where A, B and C are the independent factors and Y is the respective response value.
Response surface plots
The 3D response surface plots derived using the Design-Expert® software (Expert 8.0.5) were used to study the patterns of interaction between the independent and dependent variables. The values of the various statistical parameters such as the sum of squares (SS), degrees of freedom (DF), mean square values (MS), F-value, P-value, SD, coefficient of variation (CV) and R2 are listed in Table 5. The response-fitting results indicated that optimized TFDM-SLNs with small mean particle size and high EE were acquired at the drug (TFDM):lipid ratio of 0.29, the soy lecithin:lipid ratio of 1.34 and the surfactant concentration of 4.24%, respectively.
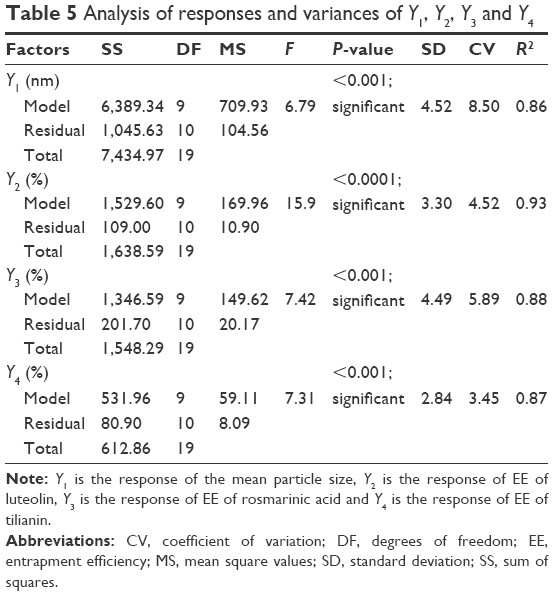 | Table 5 Analysis of responses and variances of Y1, Y2, Y3 and Y4 |
Influence of the drug:lipid ratio on particle size and EE
The ratio of drug to lipid (w/w) ranging from 1:10 to 1:2 had a positive effect on particle size, as seen in Figure 1. It was observed that with the increase of drug:lipid ratio (w/w), the particle size increased, which may be due to the increased drug adherence to the surface of the nanoparticles and the increase in the size of the nanoparticles. Similarly, the ratio of drug to lipid (w/w) had an obvious influence on the EE (Figure 1A, B, D, E, G and H). The EE of TFDN-SLNs first increased with the elevation of drug:lipid ratio (w/w) and then decreased. With the amount of drug increasing, the EE of the drug in the nanoparticles increased, but beyond a certain amount of drug, the free drug increased so that the EE decreased. Therefore, 0.29 was selected as the optimal drug:lipid ratio for the TFDM-SLNs.
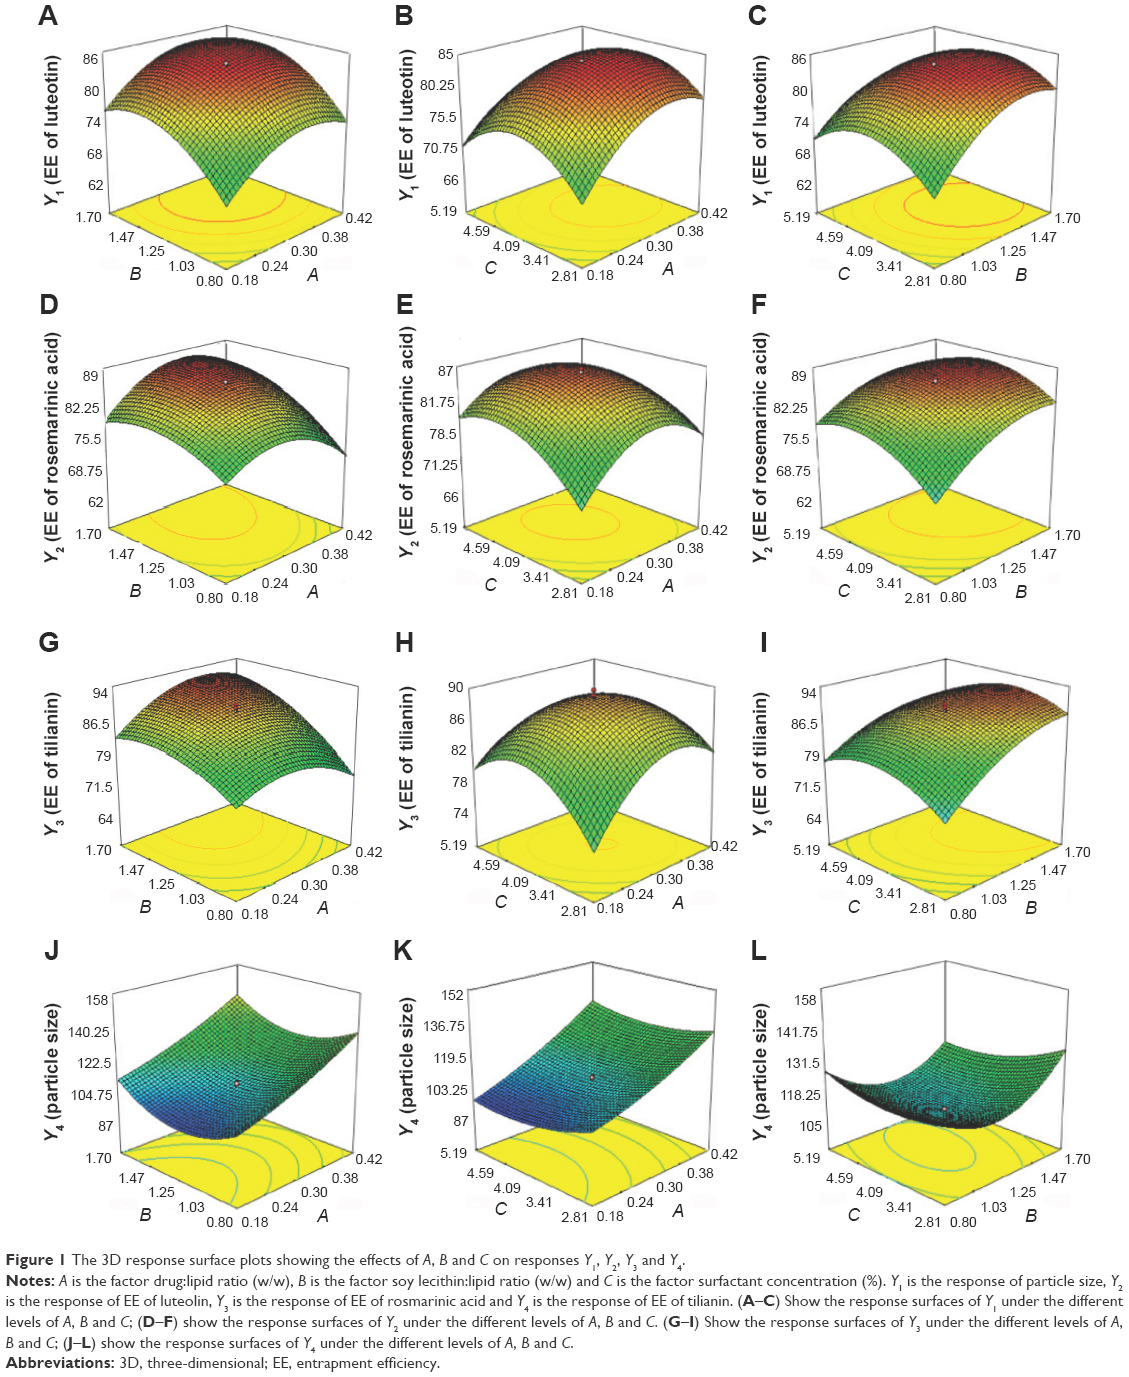 | Figure 1 The 3D response surface plots showing the effects of A, B and C on responses Y1, Y2, Y3 and Y4. |
Influence of the soy lecithin:lipid ratio on particle size and EE
The ratio of soy lecithin to lipid (w/w) was changed from 1:2 to 2:1. As can be seen from Figure 1 (A, C, D, F, G, I, J, L), the results of the ratio of soy lecithin to lipid had a similar effect as the influence of the drug to lipid ratio. That is to say, with the increase of the ratio of soy lecithin to lipid, the particle size and EE increased and, at the same time, the particle size was increased because soy lecithin can improve the film strength to increase the amount of drug in the nanoparticles. The optimal soy lecithin:lipid ratio was 1.34.
Influence of Tween-80 on particle size and EE
The surfactant concentration produced a remarkable influence on the particle size and EE, as shown in Figure 1 (B, C, E, F, H, I, K, L). Surfactant concentration plays a major role in the solubility of drug in the lipid phase and can reduce the surface tension so that the particle size becomes smaller and the EE is larger. In this research, the concentration of Tween-80 was in the range of 2%–6%, and the optimum amount of Tween-80 (4.24%) showed the highest EE with reference to other concentrations.
TEM measurement
The TEM study of TFDM-SLNs illustrated the spherical shape of nanoparticles. The result confirmed that the particles were spherical in shape, with narrow size distribution and no aggregation (Figure 2).
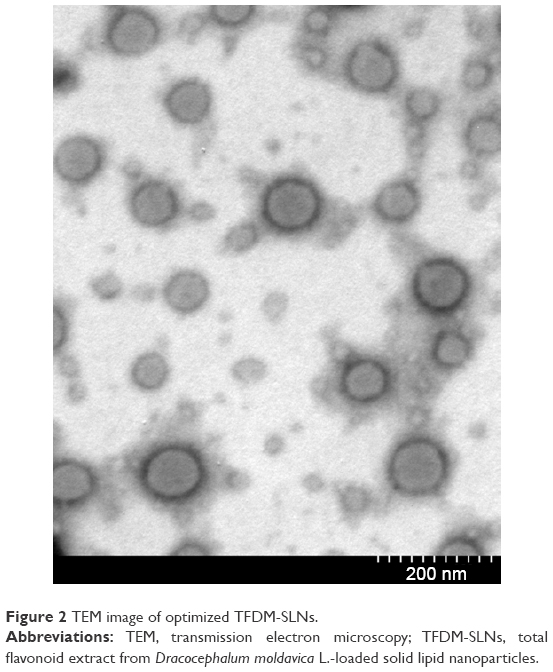 | Figure 2 TEM image of optimized TFDM-SLNs. |
Particle size and zeta potential analyses
The particle analysis by laser diffraction using Malvern Mastersizer showed a mean particle size of 104.82±0.24 nm and a PDI of 0.21±0.97 (Figure 3). PDI values ranging from 0 to 0.5 are considered to indicate monodisperse and uniform materials. PDI values <0.3 indicate acceptable SLNs. Therefore, the nanoparticles size and distribution are favorable.
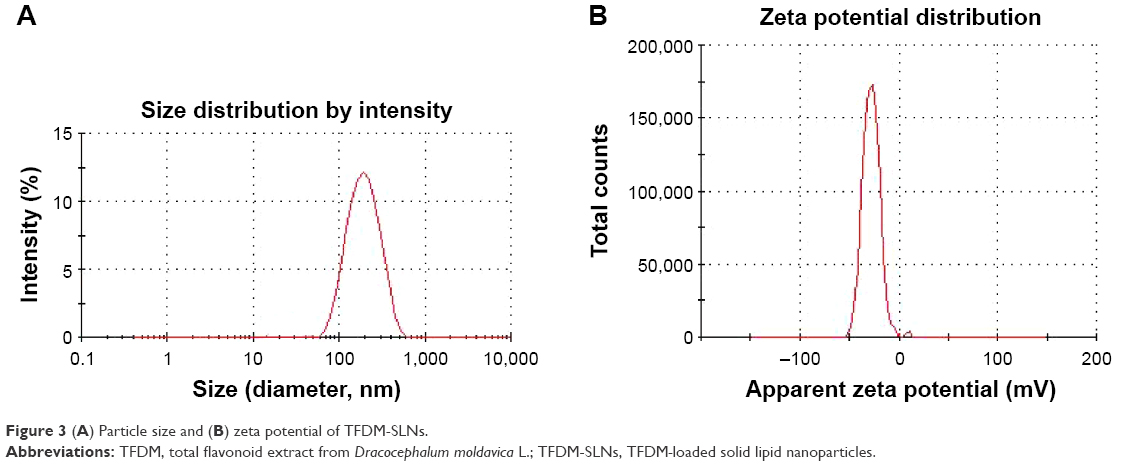 | Figure 3 (A) Particle size and (B) zeta potential of TFDM-SLNs. |
The zeta potential can be used to evaluate the charge on the surface of nanoparticles, and it is considered as one of the parameters that can be used to reflect the stability of nanoparticle emulsions. If the system has a high positive or negative value of zeta potential, aggregation of the nanoparticles is more difficult and the emulsion is more stable. It is known that a zeta potential of ±30 mV is able to stabilize nanoparticle formulations.37,38 In this test, the zeta potential of the nanoparticles emulsion was −28.7±1.94 mV, which was efficient in stabilizing the system.
EE and DL
The determination methods of EE include ultracentrifugation, dextran gel ultrafiltration method and so on. Ultracentrifugation method involves using nanocarriers of different densities and achieving separation through the dispersion medium; dextran gel method uses the molecular sieve principle based on the size and separation of different molecules. Since TFDM is difficult to dissolve in water, free drug cannot be effectively applied to the column, which is a time-consuming operation. Ultrafiltration uses the screening principle under the influence of centrifugal force. The solvent and low-molecular-weight solutes pass through the pores of the ultrafiltration membrane to reach the lower side of the membrane, while relatively high-molecular-weight solutes or nanoparticles are retained. Ultrafiltration has several advantages, such as short operation time, no need for dilution of the sample and less leakage of the encapsulated drug. In this study, a membrane with a relative molecular mass cutoff of 30 K was selected.
The EEs of luteolin, rosmarinic acid and tilianin of the optimal TFDM-SLNs formulation were 83.98%±1.05%, 87.01%±0.83% and 88.82%±0.58%, respectively, and the DL was 8.61%±0.97%. As can be seen, when the amount of drug increased, the EE was increased initially and then reduced later. The surfactant Tween-80 did not have a significant influence on the EE. The EE of the SLNs was increased with the increase of soy lecithin amount because soy lecithin can increase the film-forming properties of nanoparticles. In addition, the application of soy lecithin also helped to improve the safety and reduce the allergic reactions induced by the drugs of SLNs.
DSC analysis
DSC analysis was used to evaluate the physical state of TFDM in the nanoparticle formulation. In this experiment, A was TFDM, B was Compritol 888 ATO, C was blank SLN and D was TFDM-SLN. As can be seen in Figure 4A and B, TFDM and Compritol 888 ATO had absorption peaks at 71.2°C and 88.1°C and they did not affect the absorption peak of each other, relatively. In the blank SLNs (Figure 4C), the absorption peak of Compritol 888 ATO did not have a change, which indicated that SLNs had no obvious effect on the physical properties of Compritol 888 ATO. The absorption peak of TFDM shifted from 88.1°C to 125.5°C (Figure 4D) in the TFDM-SLN formulation, which demonstrated that TFDM was dissolved in the Compritol 888 ATO and incorporated into the SLNs.
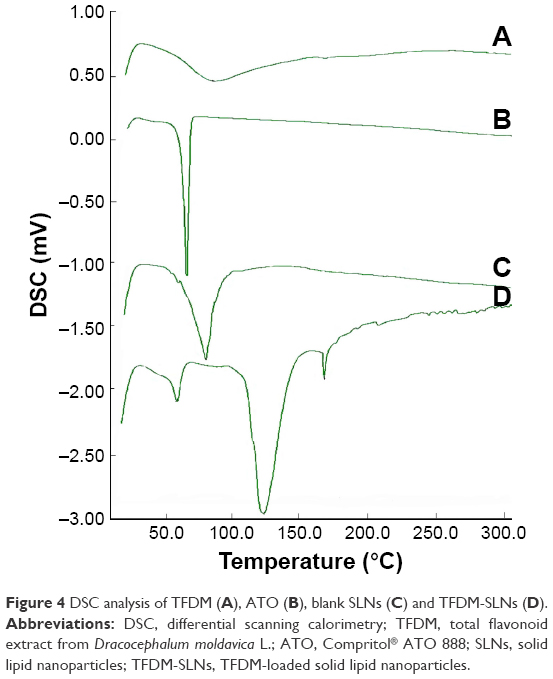 | Figure 4 DSC analysis of TFDM (A), ATO (B), blank SLNs (C) and TFDM-SLNs (D). |
In vitro drug release
In vitro drug release process of TFDM from the SLN dispersion is shown in Figure 5. It indicated that the TFDM had a burst release in the first 2 h because of the existence of a small amount of free drug in the TFDM-SLN colloidal solution and the drug adsorbed on the surface of nanoparticles, and the accumulated release ratio at 2 h increased up to 60%. From the graph, it is clear that the emulsion of TFDM-SLNs released almost 96.23% of the drug at the end of 48 h, while TFDM released 86.51% of drug after 48 h due to the poor water solubility.
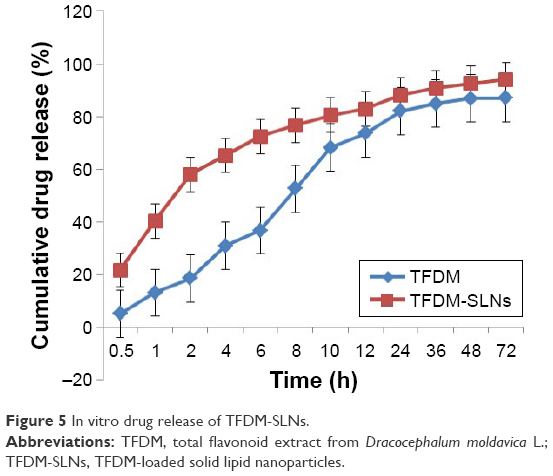 | Figure 5 In vitro drug release of TFDM-SLNs. |
ECG measurement
One of the indicators of the success of MIRI is the elevation of the S–T segment of the ECG. The ECGs of the normal group, ischemia group and reperfusion group are presented in Figure 6. It showed that the S–T segment was close to the baseline in the normal heart; the S–T segment was significantly elevated during the period of ischemia and then declined during reperfusion, which indicated that the establishment of the MIRI model was successful.
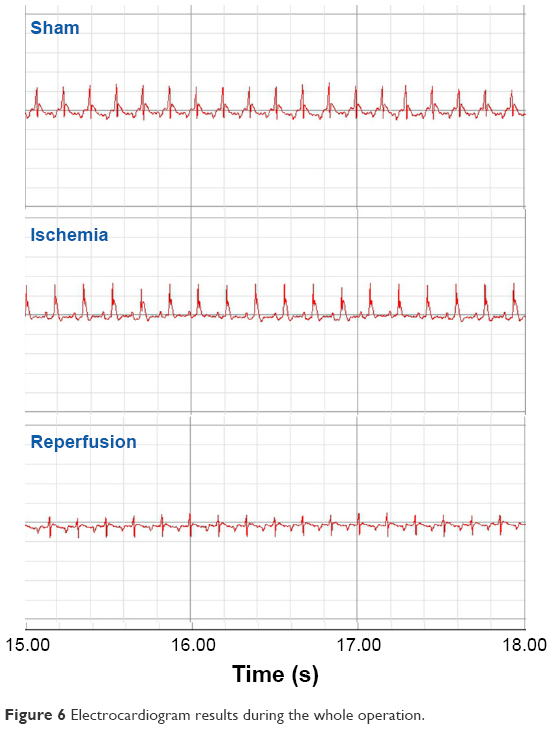 | Figure 6 Electrocardiogram results during the whole operation. |
Infarct size measurement
The measurement of myocardial infarction area can reflect the success of the MIRI model. On the other hand, it can also reflect the protective effect of drugs on the myocardium. Infarct size was determined by TTC staining, and the results are shown in Figure 7. There was no infarct in the sham group, while the infarct size of the MIRI group was significantly increased (P<0.001). Compared to the MIRI group, the infarct size of the CDDP-treated group was remarkably smaller (P<0.01), and the infarct size of the TFDM and TFDM-SLN treatment groups decreased by different degrees. Compared to the MIRI and the positive drug control groups, the TFDM and TFDM-SLN treatment groups showed a protective effect on the myocardium. The smaller infarct size of the TFDM-SLN group partially suggested a better cardioprotective effect of the TFDM-SLNs than TFDM.
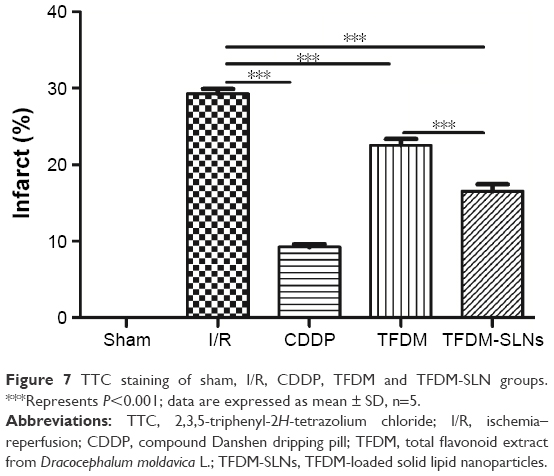 | Figure 7 TTC staining of sham, I/R, CDDP, TFDM and TFDM-SLN groups. ***Represents P<0.001; data are expressed as mean ± SD, n=5. |
Histopathological examination of myocardium
HE staining mainly causes the red coloration of the cytoplasm and extracellular matrix, and it is the basic and the most widely used method in histology, embryology and pathology. In this research, HE staining was used to identify the changes in myocardial fibers and cardiac myocytes, and the results are presented in Figure 8. The heart tissue of the sham group presented obvious integrity of the myocardial membrane and ordered myocardial fiber structure. However, in the MIRI group, there are numerous cardiac muscle cells undergoing apoptosis, and the gaps between the myocardial fibers became larger and disordered. The positive drug-, TFDM- and TFDM-SLN-administered groups clearly showed improved integrity of the myocardial membrane and myocardial fibers. Compared to the TFDM group, the improvement in the TFDM-SLN group was obvious.
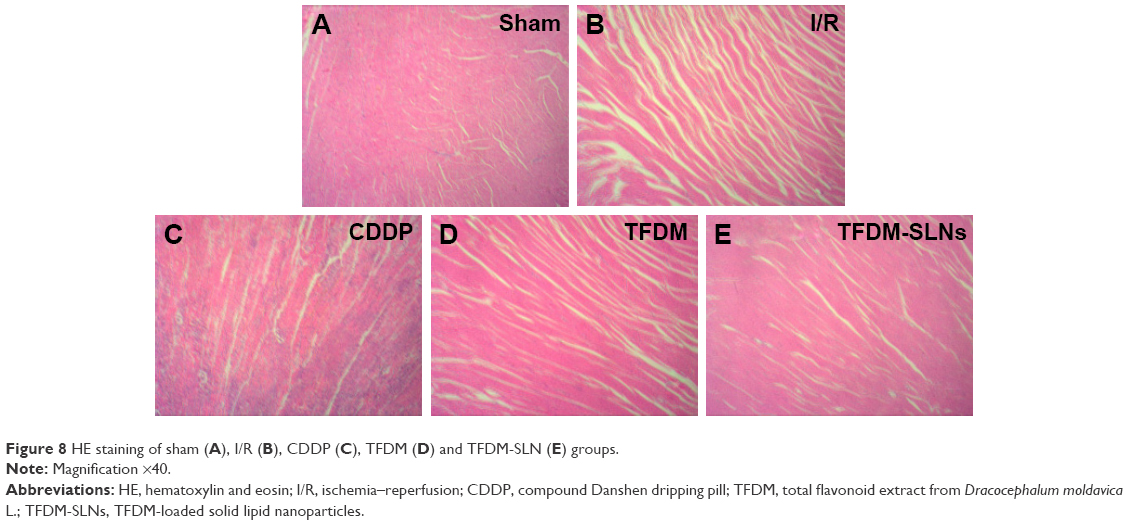 | Figure 8 HE staining of sham (A), I/R (B), CDDP (C), TFDM (D) and TFDM-SLN (E) groups. |
Measurement of cardiac enzymes in serum
LDH is one of the cardiac enzymes that exists in the cytoplasm of all the tissues and it has a high activity in tissues and a low activity in serum. LDH is an important enzyme involved in glycolysis and gluconeogenesis. The content of LDH in cardiac muscle cells is higher than that in tissue. After acute MIR, the cardiac muscle cells are damaged and the permeability of the membrane is reduced. Consequently, LDH is released into the serum and the activity of LDH in the serum increases significantly. Therefore, the changes in LDH activity can be used as an indicator of the damage to the heart. In this study, the activity of LDH was as shown in Figure 9: the activity of LDH in the MIRI group was much higher than that in the sham group (P<0.0001), and the activity of LDH in TFDM and TFDM-SLN groups had a significant difference compared to the MIRI group (P<0.001). The lower LDH activity in the TFDM-SLN group showed a better effect in the MIRI model (P<0.001), and the result is shown in Figure 9A.
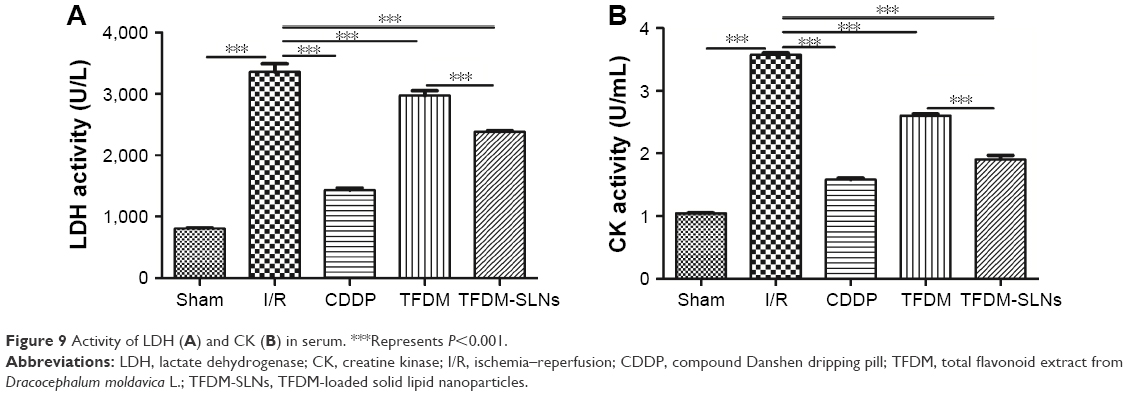 | Figure 9 Activity of LDH (A) and CK (B) in serum. ***Represents P<0.001. |
CK enzyme is another indicator that is often used to monitor MIRI. CK enzyme is widely distributed in various tissues and is related to the production of ATP. At 2 h after MIRI, the level of CK in the serum increased and had a remarkable elevation thereafter, which proved that CK was an effective index to monitor the MIRI. The results of CK enzyme analysis (Figure 9B) showed that the positive drug control group, TFDM group and TFDM-SLN group had a significant difference compared to the MIRI group (P<0.001), and the lower level of CK in the TFDM-SLN group indicated that the cardioprotection by TFDM-SLNs was better than that by TFDM (P<0.001).
Measurement of inflammatory factors in serum
Inflammation-induced damage plays an important role in MIRI, and measurement of inflammatory factors is an effective way to ensure the establishment of MIRI. As shown in Figure 10, the levels of IL-1β (Figure 10A) and TNF-α (Figure 10B) in the MIRI induced by coronary artery occlusion markedly increased (P<0.001), and as expected, the positive drug-, TFDM- and TFDM-SLN-administered groups showed significantly reduced levels of the same (P<0.001). Most importantly, the TFDM-SLNs had a much better effect than TFDM.
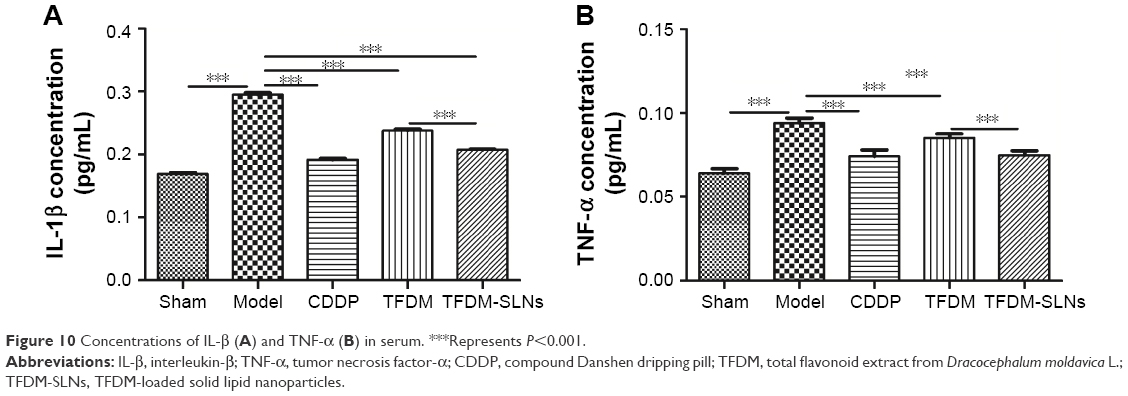 | Figure 10 Concentrations of IL-β (A) and TNF-α (B) in serum. ***Represents P<0.001. |
Conclusion
TFDM-SLNs were prepared by high-shear homogenization followed by ultrasonication, and the formulation of TFDM-SLNs was optimized by CCD-RSM. The optimized index values of TFDM-SLNs were close to the predictive values, and the surfactant and cosurfactant had a significant impact on particle size and EE. The drug release result in vitro exhibited that TFDM-SLNs had a 60% quick release in the first 2 h, which ensured a high drug concentration in the equilibrium state for a long time. The released drug amount of TFDM-SLNs was significantly higher than that of TFDM and reached 95% after 48 h, which suggested that TFDM-SLNs could improve the in vitro drug release of TFDM. Moreover, the pharmacodynamics results indicated that both TFDM and TFDM-SLNs had a significant myocardial protective effect in MIRI. Compared to TFDM alone, TFDM-SLNs had a much better myocardial protective effect, which suggested that TFDM-SLNs can serve as safe and effective nanocarriers for the oral delivery of TFDM.
Acknowledgment
This work was financially supported by Plan for Supporting Xinjiang through Science and Technology in Xinjiang Uygur Autonomous Region (201591149), National Natural Science Foundation of China (81260681), Autonomous Region High Technology Research and Development Program of China (201517109) and Graduate Scientific Research Innovation Project of Xinjiang Uygur Autonomous Region (XJGRI2015053).
Disclosure
The authors report no conflicts of interest in this work.
References
Najafi M, Ghasemian E, Fathiazad F, Garjani A. Effects of total extract of Dracocephalum moldavica on ischemia/reperfusion induced arrhythmias and infarct size in the isolated rat heart. Iran J Bas Med Sci. 2009;11(4):229–235. | ||
Yuan Y, Xing J, Wang X, Lu P, Su H, Wen Z. [Study on the intestinal absorption of Dracocephalum total flavones in situ]. Chin Hosp Pharm J. 2011;31(20):1667–1670. Chinese. | ||
Yang C, An X, Fu W, et al. [Relaxant effect of Dracocephalum flavonoids on rat thoracicaorta]. Acta Biophysica Sinica. 2010;26(4):334–340. Chinese. | ||
Yang L, Xing J, He C, Yang P. [Chemical constituents of Dracomoldavica L. and their pharmacological activities]. World Clin Drug. 2013;34(4):226–231. Chinese. | ||
Jiang J, Yuan X, Wang T, et al. Antioxidative and cardioprotective effects of total flavonoids extracted from Dracocephalum moldavica L. against acute ischemia/reperfusion-induced myocardial injury in isolated rat heart. Cardiovasc Toxicol. 2014;14(1):74–82. | ||
Fan X, Cao W, Xing J, Guo X, Yuan Y, Wang X. [Protective effect of total flavones from Dracocephalum moldavica against myocardial ischemia-reperfusion injury in rats]. Chin Med. 2013;35:1625–1629. Chinese. | ||
Hu X, Fan W, Yu Z, et al. Evidence does not support absorption of intact solid lipid nanoparticles via oral delivery. Nanoscale. 2016;8(13):7024–7035. | ||
Hu X, Zhang J, Yu Z, et al. Environment-responsive aza-BODIPY dyes quenching in water as potential probes to visualize the in vivo fate of lipid-based nanocarriers. Nanomedicine. 2015;11(8):1939–1948. | ||
Shangguan M, Qi J, Lu Y, Wu W. Comparison of the oral bioavailability of silymarin-loaded lipid nanoparticles with their artificial lipolysate counterparts: implications on the contribution of integral structure. Int J Pharm. 2015;489(1–2):195–202. | ||
Porter CJ, Trevaskis NL, Charman WN. Lipids and lipid-based formulation: optimizing the oral delivery of lipophilic drugs. Nat Rev Drug Discov. 2007;6:231–248. | ||
Yuan Y, Xing J, Wang L, Yao J, Wang X. [Study on the pharmacokanetic behavior of Dracocephalum moldavica L. flavonoids in rat]. J Shehezi Univ. 2014;32:69–72. Chinese. | ||
Mehnert W, Mäder K. Solid lipid nanoparticles: production, characterization and applications. Adv Drug Deliv Rev. 2011;47:165–196. | ||
Kalepu S, Manthina M, Padavala V. Oral lipid-based drug delivery systems an overview. Acta Pharm Sin B. 2013;3:361–372. | ||
Melike Ü, Gülgün Y. Importance of solid lipid nanoparticles in various administration routes and future perspective. Nanomedicine. 2007;2:289–300. | ||
Uner M. Preparation, characterization and physicochemical properties of solid lipid nanoparticles (SLN) and nanostructured lipid carriers (NLC): their benefits as colloidal drug carrier systems. Pharmazie. 2006;61:375–386. | ||
Wissing SA, Kayser O, Muller RH. Solid lipid nanoparticles for parenteral drug delivery. Adv Drug Deliv Rev. 2003;56:1257–1272. | ||
Yang J, Wang HX, Zhang YJ, et al. Astragaloside IV attenuates inflammatory cytokines by inhibiting TLR4/NF-κB signaling pathway in isoproterenol-induced myocardial hypertrophy. J Ethnopharmacol. 2013;150:1062–1070. | ||
Stanley WC. Myocardial energy metabolism during ischemia and the mechanisms of metabolic therapies. J Cardiovasc Pharmacol Ther. 2004;9(suppl 1):S31–S45. | ||
Guo J, Wang SB, Yuan TY, et al. Coptisine protects rat heart against myocardial ischemia/reperfusion injury by suppressing myocardial apoptosis and inflammation. Atherosclerosis. 2013;231(2):384–391. | ||
Marchant DJ, Boyd JH, Lin DC, Granville DJ, Garmaroudi FS, McManus BM. Inflammation in myocardial diseases. Circ Res. 2012;110(1):126–144. | ||
Vander Heide RS, Steenbergen C. Cardioprotection and myocardial reperfusion: pitfalls to clinical application. Circ Res. 2013;113(4):464–477. | ||
Liu CH, Wu CT. Optimization of nanostructured lipid carriers for lutein delivery. Colloids Surf A. 2010;353:149–156. | ||
Zhang X, Liu J, Qiao H, et al. Formulation optimization of dihydroartemisinin nanostructured lipid carrier using response surface methodology. Powder Technol. 2010;197:120–128. | ||
Alex MR, Chacko AJ, Jose S, Souto EB. Lopinavir loaded solid lipid nanoparticles (SLN) for intestinal lymphatic targeting. Eur J Pharm Sci. 2011;42(1–2):11–18. | ||
Mishra DK, Dhote V, Bhatnagar P, Mishra PK. Engineering solid lipid nanoparticles for improved drug delivery. Drug Deliv Transl Res. 2012;2:238–253. | ||
Song R, Jin C, Zhou Y. [To determine content of total flavonoids and robinin-7-o-β-xylosylglucoside from Dracocephalum mololarie]. Chin J Exp Tradit Med Formulae. 2010;16:71–74. Chinese. | ||
Makwana V, Jain R, Patel K, Nivsarkar M, Joshi A. Solid lipid nanoparticles (SLN) of efavirenz as lymph targeting drug delivery system: elucidation of mechanism of uptake using chylomicron flow blocking approach. Int J Pharm. 2015;495(1):439–446. | ||
Teeranachaideekul V, Souto EB, Müller RH, Junyaprasert VB. Physicochemical characterization and in vitro release studies of ascorbyl palmitate-loaded semi-solid nanostructured lipid carriers (NLC gels). J Microencapsul. 2008;25(2):111–120. | ||
Kovacevic A, Savic S, Vuleta G, Müller RH, Keck CM. Polyhydroxy surfactants for the formulation of lipid nanoparticles (SLN and NLC): effects on size, physical stability and particle matrix structure. Int J Pharm. 2011;406(1–2):163–172. | ||
Kullavadee KO, Uracha R, Smith SM. Effect of surfactant on characteristics of solid lipid nanoparticles (SLN). Adv Mat Res. 2011;364:313–316. | ||
Mehnert W, Mader K. Solid lipid nanoparticles: production, characterization and applications. Adv Drug Deliv Rev. 2011;47:165–196. | ||
zur Mühlen A, Schwarz C, Mehnert W. Solid lipid nanoparticles (SLN) for controlled drug delivery-drug release and releases mechanism. Eur J Pharm Biopharm. 1998;45:149–155. | ||
Genc L, Dikmen G. Preparation and characterization of nocodazole-loaded solid lipid nanoparticles. Pharm Dev Technol. 2013;19(6):671–676. | ||
Shah RM, Malherbe F, Daniel E, Palombo EA, Harding IH. Physicochemical characterization of solid lipid nanoparticles (SLNs) prepared by a novel microemulsion technique. J Colloid Interface Sci. 2014;428:286–294. | ||
Puglia C, Offerta A, Rizza L, Zingale G, Bonina F, Ronsisvalle S. Optimization of curcumin loaded lipid nanoparticles formulated using high shear homogenization (HSH) and ultrasonication (US) methods. J Nanosci Nanotechnol. 2013;13(10):6888–6893. | ||
Zur Muhlen A, Mehnert W. Drug release and release mechanisms of prednisolone loaded solid lipid nanoparticles. Pharmazie. 1998;53:552–555. | ||
Zhang W, Li X, Ye T, et al. Design, characterization, and in vitro cellular inhibition and uptake of optimized genistein-loaded NLC for the prevention of posteriorcapsular opacification using response surface methodology. Int J Pharm. 2013;454(1):354–366. | ||
Siddiqui A, Alayoubi A, EI-Malah Y, Nazzal S. Modeling the effect of sonication parameters on size and dispersion temperature of solid lipid nanoparticles (SLNs) by response surface methodology (RSM). Pharm Dev Technol. 2014;19(3):342–346. |
 © 2017 The Author(s). This work is published and licensed by Dove Medical Press Limited. The full terms of this license are available at https://www.dovepress.com/terms.php and incorporate the Creative Commons Attribution - Non Commercial (unported, v3.0) License.
By accessing the work you hereby accept the Terms. Non-commercial uses of the work are permitted without any further permission from Dove Medical Press Limited, provided the work is properly attributed. For permission for commercial use of this work, please see paragraphs 4.2 and 5 of our Terms.
© 2017 The Author(s). This work is published and licensed by Dove Medical Press Limited. The full terms of this license are available at https://www.dovepress.com/terms.php and incorporate the Creative Commons Attribution - Non Commercial (unported, v3.0) License.
By accessing the work you hereby accept the Terms. Non-commercial uses of the work are permitted without any further permission from Dove Medical Press Limited, provided the work is properly attributed. For permission for commercial use of this work, please see paragraphs 4.2 and 5 of our Terms.