")
Back to Journals » Drug Design, Development and Therapy » Volume 10
Development of novel HER2 inhibitors against gastric cancer derived from flavonoid source of Syzygium alternifolium through molecular dynamics and pharmacophore-based screening
Authors Babu TMC, Rammohan A, Baki VB, Devi S, Gunasekar D, Rajendra W
Received 3 May 2016
Accepted for publication 8 September 2016
Published 4 November 2016 Volume 2016:10 Pages 3611—3632
DOI https://doi.org/10.2147/DDDT.S111914
Checked for plagiarism Yes
Review by Single anonymous peer review
Peer reviewer comments 2
Editor who approved publication: Prof. Dr. Wei Duan
Tirumalasetty Muni Chandra Babu,1 Aluru Rammohan,2 Vijaya Bhaskar Baki,1 Savita Devi,3 Duvvuru Gunasekar,2 Wudayagiri Rajendra1
1Bioinformatics Center, Division of Molecular Biology, Department of Zoology, 2Natural Products Division, Department of Chemistry, Sri Venkateswara University, Tirupati, Andhra Pradesh, 3Pathogen Biology Laboratory, Department of Biotechnology and Bioinformatics, School of Life Sciences, University of Hyderabad, Hyderabad, India
Abstract: Continuous usage of synthetic chemotherapeutic drugs causes adverse effects, which prompted for the development of alternative therapeutics for gastric cancer from natural source. This study was carried out with a specific aim to screen gastroprotective compounds from the fruits of Syzygium alternifolium (Myrtaceae). Three flavonoids, namely, 1) 5-hydroxy-7,4'-dimethoxy-6,8-di-C-methylflavone, 2) kaempferol-3-O-β-D-glucopyranoside, and 3) kaempferol-3-O-α-L-rhamnopyranoside were isolated from the above medicinal plant by employing silica gel column chromatography and are characterized by NMR techniques. Antigastric cancer activity of these flavonoids was examined on AGS cell lines followed by cell cycle progression assay. In addition, pharmacophore-based screening and molecular dynamics of protein–ligand complex were carried out to identify potent scaffolds. The results showed that compounds 2 and 3 exhibited significant cytotoxic effect, whereas compound 1 showed moderate effect on AGS cells by inhibiting G2/M phase of cell cycle. Molecular docking analysis revealed that compound 2 has higher binding energies on human growth factor receptor-2 (HER2). The constructed pharmacophore models reveal that the compounds have more number of H-bond Acc/Don features which contribute to the inhibition of HER2 activity. By selecting these features, 34 hits were retrieved using the query compound 2. Molecular dynamic simulations (MDS) of protein–ligand complexes demonstrated conspicuous inhibition of HER2 as evidenced by dynamic trajectory analysis. Based on these results, the compound ZINC67903192 was identified as promising HER2 inhibitor against gastric cancer. The present work provides a basis for the discovery a new class of scaffolds from natural products for gastric carcinoma.
Keywords: gastric cancer, cell cycle, pharmacophore, molecular docking, molecular dynamics
Introduction
Gastric cancer (GC) is the major cancer burden worldwide and remains the second leading cause of cancer-related deaths with ~7,000,000 people succumb each year to gastric adenocarcinoma.1 The incidence of gastric cancer is higher in the countries of Far East and South and Central America. In some of the regions of Asian countries, the gastric carcinoma is the most common malignancy. The gastric carcinoma is almost 10-fold higher in Japan than the rate observed in the United States.2
Nowadays, surgery is the most prominent curative treatment, but due to radical excision most of the patients will get reoccurrence at regional or distant sites with 5 years survival rate in only 20%–25%.3,4 Furthermore, chemotherapy with synthetic and nonsteroidal anticancer drugs can cause severe toxic adverse effects leading to functional impairments in gastric cancer patients. With the continuous usage of these chemotherapeutic drugs, the recovery of patients with advanced gastric cancer remains poor.5,6
The comprehensive understanding of molecular pathways of tumor biology has led to the discovery of novel targeted therapies that block the development and progression of gastric cancer. During the past few years, attention has been focused on the new modality of molecular targeted therapy that regulates different signaling pathways involved in gastrointestinal cancers.7 Most of the lead molecules involved in the regulation of cancer growth factors and their receptors, signal transmission, cell cycle, apoptosis, angiogenesis, invasion, and metastasis give rise to a new hope in the treatment strategy for many common malignancies including gastric cancer. In recent years, advances in genomic and molecular profiling studies have led to the exploration of new molecules that regulate different potential targets such as human growth factor receptor-2 (HER2), vascular endothelial growth factor receptor (VEGFR2), P13K/AKT/mTOR, and HGF/MET signaling pathways involved in gastric carcinogenesis.8
The drug compounds that target the receptor molecules such as epidermal growth factor receptor (EGFR), VEGFR, and fibroblast growth factor receptor (FGFR) are promising candidates for target-based therapy for gastric cancer and are now in clinical development.9 Among them, HER2 is a 185 kDa transmembrane tyrosine kinase receptor that is considered to be a significant drug target due to its overexpression in gastric cancer patients with poor prognostic effect.10,11 HER2 belongs to EGFR family, which constitute four members, namely, HER1 (also known as EGFR), HER2, HER3 (ErbB-3), and HER4 (also termed as ErbB-4).12 These receptors share similar molecular structure with extracellular ligand binding domain, short transmembrane domain, and intracellular domain with tyrosine kinase (TK) activity (except in HER3). Binding of the ligands to the extracellular domain initiates signal transduction cascade that can influence many aspects of tumor cell biology.
It is well established that molecular targeted inhibitors, with high selectivity and specificity, effectively modulate the signaling pathways that are closely associated with tumorigenesis. In addition, there is a critical need for the development of more effective agents that can be used for diagnosis, prognosis, and therapy of gastric cancer patients,13 as continuous treatment with synthetic chemotherapeutic agents often cause serious side effects and complications such as fatigue, pain, diarrhea, nausea, vomiting, and hair loss.14
Hence, there is a clear need to screen novel scaffolds, which may be derived from the source of natural herbal medicines that potentially serve as new leads for gastric cancer by blocking the upregulated HER2 signal pathway. The fruits of Syzygium alternifolium (SA) are used for curing stomach ache, ulcers, and management of rheumatic pain; seeds are used as antidiabetic agents; leaves are used to treat dry cough and dysentery; and stem-bark is used as antiseptic. It is also reported that SA possesses hypoglycemic and antihyperglycemic activities.15
Preliminary studies in our laboratory showed gastro-protective activity of phenolic fraction and the aqueous extract of SA fruits against ethanol/HCl-induced ulcerated rat model. In continuation, this study aimed to isolate bioactive compounds from the extracts of SA fruits and evaluate the antigastric cancer activity of these compounds through cytotoxic and cell cycle progression assays and also to identify new leads from the structural source of compounds against pharmacologically potential target (eg, HER2) through pharmacophore-based virtual screening and molecular dynamic simulations of protein–ligand complexes.
Materials and methods
Chemicals and reagents
Methanol (HPLC and analytical grade), ethyl acetate, acetone, chloroform, dimethysulfoxide (DMSO), and n-hexane were purchased from Sigma-Aldrich (Sigma-Aldrich, Missouri, USA) and Merck (New Jersey, USA). Silica gel (100–200 mesh), bovine serum albumin (BSA), fetal calf serum (FCS), MTT (3-[4,5-dimethylthiazol-2-yl]-2,5-diphenyltetrazolium bromide), Hams F12 K media, propidium iodide, and RNase were purchased from Sigma-Aldrich.
Plant materials
The fruits of SA used in the present investigation were collected from Seshachalam Hill ranges of Chittoor District, Andhra Pradesh, South India. A voucher specimen (SA135) has been deposited in the Herbarium, Department of Botany, Sri Venkateswara University, Tirupati.
Extraction and isolation of compounds 1–3
Air-dried and finely powdered fruits (2.1 kg) of SA were successively extracted with n-hexane (3×4 L) and methanol (3×4 L). The concentrated MeOH extract (63 g) was suspended in 10% aqueous methanol and was fractioned with n-hexane and ethyl acetate. The n-hexane soluble fraction (13 g) was further fractioned over a silica gel column (100–200 mesh) using n-hexane-CHCl3 step gradient. The n-hexane-CHCl3 (1:1) elutes yielded a pale yellow solid, namely, compound 1 (25 mg).
The ethyl acetate soluble fraction was chromatographed over a silica gel (100–200 mesh) column using CHCl3-MeOH step gradient. The CHCl3-MeOH elutes (8:2 and 7:3) yielded two yellow solids, namely, compounds 2 (28 mg) and 3 (21 mg), respectively (Figure 1A).
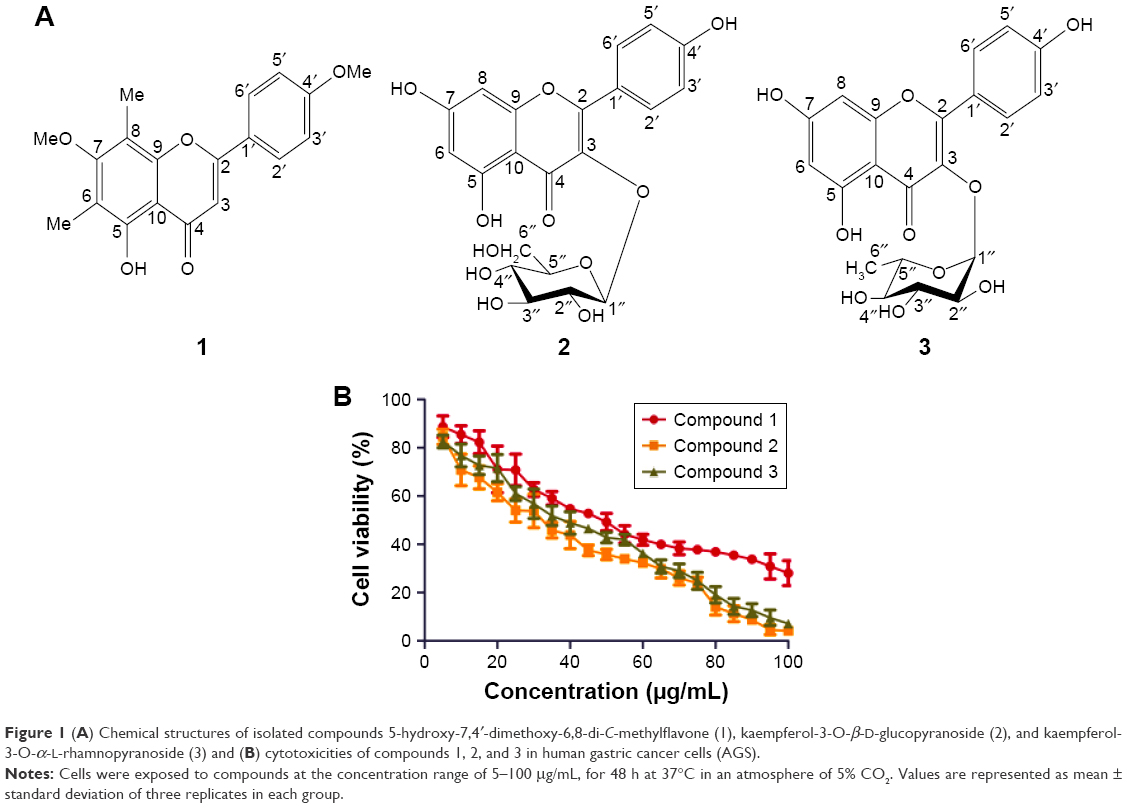 | Figure 1 (A) Chemical structures of isolated compounds 5-hydroxy-7,4′-dimethoxy-6,8-di-C-methylflavone (1), kaempferol-3-O-β-D-glucopyranoside (2), and kaempferol-3-O-α-L-rhamnopyranoside (3) and (B) cytotoxicities of compounds 1, 2, and 3 in human gastric cancer cells (AGS). |
Compound 1: [5-hydroxy-7,4′-dimethoxy-6,8-di-C-methylflavone] (eucalyptin)
Pale yellow needles (MeOH), mp 198°C–200°C; UV λmax (MeOH) (log ε) 268 (4.62), 335 (4.41); +NaOMe: 268, 335; +NaOAc: 268, 335; +AlCl3: 268, 387; +AlCl3/HCl: 268, 387 nm; FTIR νmax 3,332 (−OH), 2,951 (−OMe), 2,838, 1,649 (>C=O), 1,500, 1,445, 1,291, 1,236, 1,016, 859, 746 cm−1; 1H NMR (400 MHz, Me2CO-d6) δ 13.07 (1H, s, OH-5), 8.06 (2H, d, J =8.2 Hz, H-2′,6′), 7.14 (2H, d, J =8.2 Hz, H-3′,5′), 6.75 (1H, s, H-3), 3.92 (3H, s, OMe-4′), 3.81 (3H, s, OMe-7), 2.39 (3H, s, Me-6), 2.14 (3H, s, Me-8); 13C NMR (75 MHz, Me2CO-d6), δ 183.0 (C-4), 162.2 (C-7), 161.7 (C-2), 157.7 (C-4′), 157.0 (C-5), 152.7 (C-8a), 129.1 (C-2′,6′), 117.2 (C-1′), 115.5 (C-3′,5′), 113.0 (C-6), 109.1 (C-3), 108.6 (C-4a), 104.5 (C-8), 60.8 (OMe-7), 56.0 (OMe-4′), 8.6 (Me-6), 8.3 (Me-8); electrospray ionization mass spectrometry (positive mode) m/z (rel. int.%) 327 [M + H]+ (100), 311 (91), 296 (42), 194 (7), 151 (22), 141 (21), 132 (9), 105 (19).
Compound 2: [kaempferol 3-O-β-D-glucopyranoside]
Yellow amorphous solid (MeOH), mp 176°C–78°C; UV λmax (MeOH) (log ε) 266 (4.73), 350 (4.68); +NaOMe: 274, 325, 402; +NaOAc: 274, 312, 284; +NaOAc/H3BO3: 266, 357; + AlCl3: 276, 306, 350, 398; +AlCl3/HCl: 277, 304, 358, 398 nm; FTIR νmax 3,339 (−OH), 1,648 (>C=O), 1,607, 1,499, 1,361, 1,282, 1,191, 1,069, 1,009, 887, 810, 703, 637 cm−1; 1H NMR (400 MHz, DMSO-d6) δ 12.60 (1H, s, OH-5), 10.40 (2H, br s, OH-7, 4′), 8.03 (2H, d, J =8.9 Hz, H-2′, 6′), 6.87 (2H, d, J =8.9 Hz, H-3′, 5′), 6.42 (1H, d, J =2.0 Hz, H-8), 6.19 (1H, d, J =2.0 Hz, H-6), 5.45 (1H, d, J =7.3 Hz, H-1″), 2.90–3.57 (6H, m, H-2″, 3″, 4″, 5″, CH2-6″); 13C NMR (100 MHz, DMSO-d6) δ 177.5 (C-4), 164.3 (C-7), 161.2 (C-5), 160.0 (C-4′), 156.4 (C-9), 156.2 (C-2), 133.2 (C-3), 130.9 (C-2′, 6′), 120.9 (C-1′), 115.1 (C-3′, 5′), 104.0 (C-10), 100.9 (C-1″), 98.7 (C-6), 93.7 (C-8), 77.5 (C-3″), 76.4 (C-5″), 74.2 (C-2″), 69.9 (C-4″), 60.9 (C-6″); electrospray ionization mass spectrometry (70 eV, DI) m/z (rel. int.%) 286 [M − glucosyl]+ (100), 258 (7), 229 (6), 213 (4), 153 (A1 + H)+ (5), 121 (B2)+ (13), 97 (8), 69 (30).
Compound 3: [kaempferol 3-O-α-L-rhamnopyranoside]
Yellow needles (MeOH), mp 225°C–27°C; UV λmax (MeOH) (log ε) 266 (4.52), 297 (4.36) (sh), 347 (4.46); +NaOMe: 284, 327, 408; +NaOAc: 279, 318, 390; +NaOAc/H3BO3: 269, 305 (sh), 351; +AlCl3: 279, 306 (sh), 361 (sh), 412; +AlCl3/HCl: 277, 306 (sh), 361 (sh), 412 nm; FTIR νmax 3,243 (−OH), 1,649 (>C=O), 1,600, 1,500, 1,450, 1,359, 1,268, 1,176, 1,068, 1,023, 888, 814, 637, 576, 513 cm−1; 1H NMR (400 MHz, Me2CO-d6) δ 12.68 (1H, s, OH-5), 9.40 (2H, br s, OH-7, 4′), 7.84 (2H, d, J=8.9 Hz, H-2′, 6′), 7.00 (2H, d, J =8.9 Hz, H-3′, 5′), 6.45 (1H, d, J =2.1 Hz, H-8), 6.25 (1H, d, J =2.1 Hz, H-6), 5.53 (1H, d, J =1.0 Hz, H-1″), 3.10–4.23 (4H, m, H-2″, 3″, 4″, 5″), 0.89 (3H, d, J =6.0 Hz, rhamnosyl CH3); 13C NMR (100 MHz, Me2CO-d6) δ 179.2 (C-4), 165.2 (C-7), 163.1 (C-5), 160.9 (C-4′), 158.3 (C-8a), 157.9 (C-2), 135.6 (C-3), 131.6 (C-2′, 6′), 122.4 (C-1′), 116.3 (C-3′, 5′), 105.6 (C-4a), 102.6 (C-1″), 99.6 (C-6), 94.5 (C-8), 72.9 (C-4″), 72.1 (C-3″), 71.4 (C-2″), 71.2 (C-5″), 17.7 (CH3-6″); ESITOFMS (positive mode) m/z (rel. int.%) 455.0932 [M + Na]+ (70), 433.1138 [M + H]+ (100) (C21H20O10 + H requires 433.1142).
Cell culture
AGS (human gastric adenocarcinoma) cell line was procured from National Center for Cell Sciences, Pune, India. The cells were maintained as a monolayer culture at sub-confluence in a 95% air and 5% CO2 humidified atmosphere at 37°C. Hams F12 K media supplemented with 10% fetal calf serum and 1% penicillin-streptomycin were used for routine sub culturing and for all in vitro experiments.16
Cytotoxicity assay
To evaluate the cytotoxic ability of the flavonoid compounds 1–3, the cells were seeded in 96-well microtiter plate at ~104 cells per well, cultured at 37°C for 24 h. After incubation, the compounds 1–3 were added individually in a concentration range of 5–100 μg/mL and further incubated for 48 h.17 At the end of the incubation period, MTT reagent, dissolved in DMSO, was added into each well at 0.2 mg/mL, followed by incubation at 37°C for 4 h in dark conditions.18 The culture medium containing MTT was aspirated off, and the dye crystals were dissolved in 100 μL of 5% DMSO. The viable cells were detected by reading the absorbance of formazan at 570 nm using microplate reader. Fifty percent inhibitory concentration (IC50), the dose capable of killing 50% of the cells compared to the negative control (without treatment), was calculated.
Cell cycle analysis by flow cytometry
To analyze the cell cycle progression, the AGS (human gastric adenocarcinoma cells) (7×10⁵) were plated in a 6-well cell culture plate and then treated with different concentrations (0, 25, 50, and 75 μg/mL) of compounds 1–3 individually and incubated for 48 h in CO2 incubator. After treatment with the compounds, the cells were harvested and washed with phosphate-buffered saline (PBS), followed by fixation with 70% ethanol and incubated at −20°C overnight. The cells were collected by centrifugation and washed with PBS, and the collected cells were suspended in PBS and incubated with RNase (20 μg/mL) for 30 min at room temperature. The cells were stained with propidium iodide (50 μg/mL) and incubated for 30 min in dark. The cell cycle distribution was determined using FACSAria flow cytometer (FACS Diva v. 6.1.3, BD Biosciences, San Jose, CA, USA), and the fluorescence of the cells was measured at 536 and 617 nm as excitation and emission wavelengths, respectively.19 The percentage of cells at different cell cycle phases was analyzed using BD FACS Array software. The percentage of cells in each treated group was calculated with percentage of cells = (number of total cells in treated group/number of total cells in negative control group) ×100.
Molecular docking analysis
Protein–ligand docking studies were performed with the compounds 1–3 against various therapeutic targets, that is, VEGFR2, HER2, EGFR, caspase 3, caspase 6, caspase 8, and cyclin A (involved in gastric cancer cell proliferation) using docking module implemented in molecular operating environment (MOE).20 All the co-crystal structures were retrieved from the protein data bank (www.rcsb.org). Initially, all crystal structures were protonated with the addition of polar hydrogens followed by energy minimization with MMFF94x force field in order to get stable conformer of the proteins. The inhibitor binding site residues were collected from literature, which are selected and highlighted through “Site Finder” module implemented in MOE software, and docking was carried out with default parameters, that is, placement: triangle matcher, Recording 1: London dG, Refinement: Force field, and a maximum of 10 conformations of each compound were allowed to save in a separate database file in mdb format.
Binding energy and binding affinity calculations
The binding energy and binding affinity of protein–ligand complexes were calculated using molecular mechanics generalized Born interactions/volume integral (MM-GB/VI) implicit solvent method in MOE.21 Nonbonded interaction energies between the receptor protein and ligand molecule include Van der Waals, Coulomb, and Generalized Born implicit solvent interactions energies are categorized as Born interaction energy. The binding energy and affinity were calculated for each compound against various target proteins and reported in unit of kcal/mol.
Pharmacophore mapping
The best protein target, which shows significant docking score and binding affinity (kcal/mol) toward compounds 1–3, was chosen for further investigations such as pharmacophore mapping and screening. Pharmacophore is the three-dimensional arrangement of essential atomic feature that enables a molecule to exert biological effect and ensures the molecular interaction with specific binding pocket residues and blocks its biological response.22
The complex-based pharmacophore mapping was performed to study the docking poses of compounds 1–3 with inhibitor binding site of target protein using pharmacophore searching tool implemented in MOE software. The identified pharmacophore colored spots in 3D molecules were highlighted with circles of specified colors for each pharmacophore feature (eg, cyan, brown, purple, and green colors represent hydrogen bond acceptor, heavy atom, active hydrogen, and hydrophobic features, respectively) with the default parameters in the tool.
The pharmacophore features interacting with functional groups of key residues in the protein are selected for the screening of new potent molecular scaffolds from the preexisted local data set of flavonoid compounds, which share features similar to compound 2.
Molecular dynamic simulations
A 20-ns molecular dynamics simulation was performed using GROMACS 5.0.223 with AMBER 99SB-ILDN force field24 to simulate unliganded HER2 and HER2 in complexes with compounds 1, 2, and 3. MDS of the protein–ligand complexes were performed to enumerate the effectiveness of these compounds in the inhibition of HER2. The protein topology for HER2 was created in Gromacs program, the ligand topology parameterization of compounds 1–3, and selected hits were performed using PRODRG2 server.25 The unliganded HER2 as well as HER2 liganded with compounds 1–3 was immersed in the center of cubic box of simple point charge water model,26 and minimum distance of 1.0 nm between the wall and any part of the protein was set up at initial stage of the simulation. The solvated system was neutralized with an aqueous environment of 0.1 M ionic strength by the addition of Na+ (sodium) and Cl− (chloride) ions. The minimized system was then heated to desired temperatures for 1 ns under isothermal ensemble by soft coupling with Berendsen thermostat (constant number, volume and temperature).27 The Van der Waals cutoff was 14 Å. The integration time step was 1 femtosecond (fs), with the neighbor list being updated every fifth step by using the grid option and a cutoff distance of 12 Å. Periodic boundary condition was used with a constant number of particles in the systems, constant pressure, and constant temperature simulation criteria (constant number, pressure and temperature). In this simulation, the systems were coupled with Parrinello–Rahmanbarostat28 to equilibrate at 1 bar pressure for 1 ns. Production simulations for 20 ns were performed. The following 5 simulations were performed:
- HER2a: crystal structure of HER2 without ligand (protein alone)
- HER2b: crystal structure of HER2 complexes with compound 1
- HER2c: crystal structure of HER2 complexes with compound 2
- HER2d: crystal structure of HER2 complexes with compound 3
- HER2e: crystal structure of HER2 complexes with best pharmacophore hit.
All the MDS and the analysis of results were performed on Intel Xenon processor with 8 GB RAM, running Ubuntu v.14.041 Linux operating system, in HP Z230 workstation at Bioinformatics Infrastructure Facility, Department of Zoology, Sri Venkateswara University, Tirupati, India.
Bioavailability
The bioavailability of isolated flavonoid compounds 1, 2, and 3 and their similar ZINC hits were assessed by adsorption, distribution, metabolism, excretion, and toxicity prediction methods and screened for Lipinski’s rule29 of five using QSAR descriptors and OSIRIS server. The risks of toxicities, that is, irritant, mutagenic, tumorigenic, and reproductive effects, were evaluated for these compounds using OSIRIS server, based on a list of about 5,300 distinct substructure fragments created by 3,300 treated drugs as well as 15,000 commercially available fragments with associated drug likeness, CLogP, molecular weight, and toxicity risks as a total value that may be used to judge the overall potential to qualify for drug.
Results and discussion
In vitro cytotoxicity evaluation
Naturally occurring flavonoid compounds, namely, eucalyptin (compound 1), kaempferol-3-O-β-D-glucopyranoside (compound 2), and kaempferol-3-O-α-L-rhamnopyranoside (compound 3), have exhibited strong growth inhibition on human gastric cancer cell line, AGS. The cytotoxicity of the compounds was evaluated in the concentration range of 5–100 μg/mL through MTT assay as shown in the Figure 1B. Compounds 2 and 3 have shown significant inhibition on cell proliferation with IC50 of 30.37±4.10 and 35.53±5.03 μg/mL, respectively. Compound 1 has moderate inhibition with IC50 of 57.09±2.96 μg/mL against human gastric cancer cells.
The cell morphologies were observed at different concentrations of 25, 50, 75, and 100 μg/mL of compounds 1–3 treated for 48 h. The assay results demonstrated that the compounds induced large vacuoles within the cells; while increasing the concentration, the compound triggered massive cell rounding, shrinkage, and detachment from the surface of the culture plates (Figure 2).
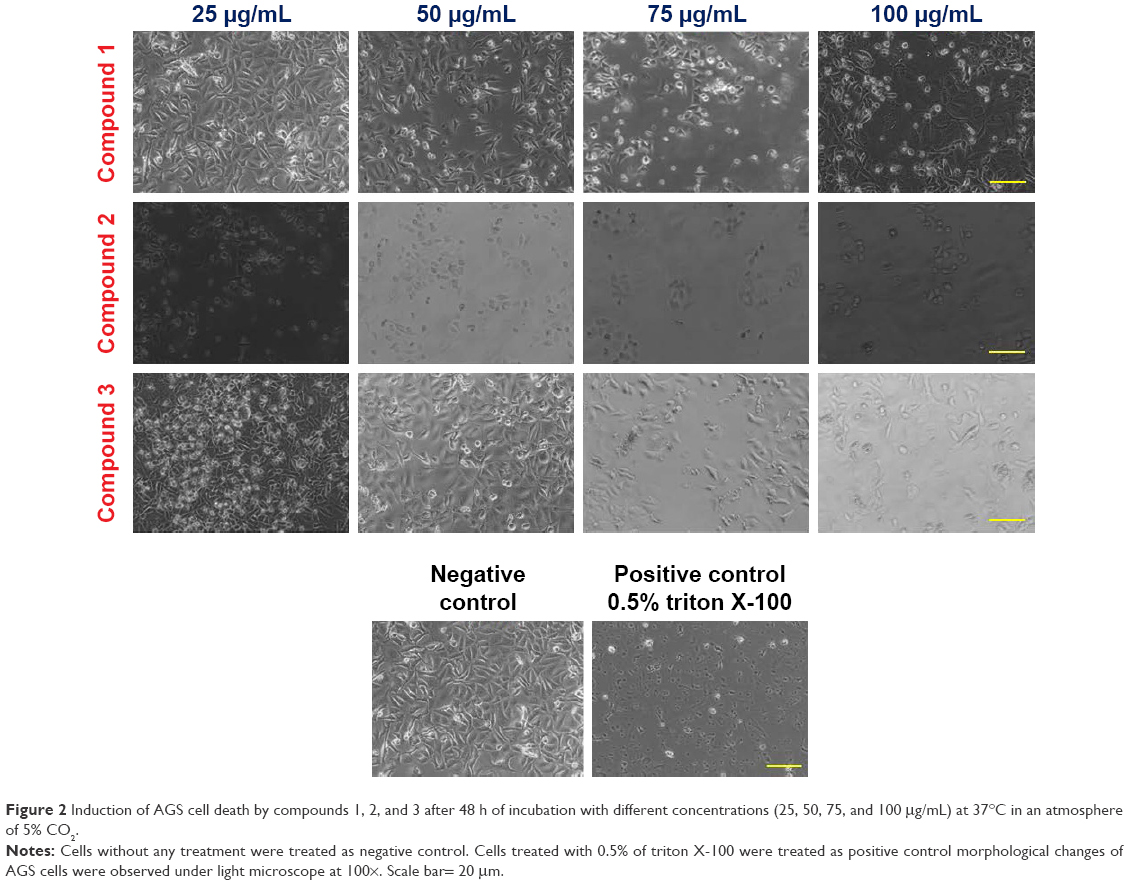 | Figure 2 Induction of AGS cell death by compounds 1, 2, and 3 after 48 h of incubation with different concentrations (25, 50, 75, and 100 μg/mL) at 37°C in an atmosphere of 5% CO2. |
Cell cycle progression assay
To investigate the possible involvement of flavonoid compounds 1–3 on various cell cycle phases of cancer cell proliferation, the effects of different concentrations (0, 25, 50, and 75) of compounds 1, 2, and 3 on cell cycle progression through flow cytometric analysis were evaluated.
The results clearly demonstrated that all the three compounds target G2/M phase of cells (Figure 3A). The cells treated with compounds 1, 2, and 3 at 75 μg/mL have shown significant reduction of viable cell count at G2/M phase with 7.13%±1.81%, 4.93%±1.10%, and 4.7%±0.5%, respectively (Figure 3B).
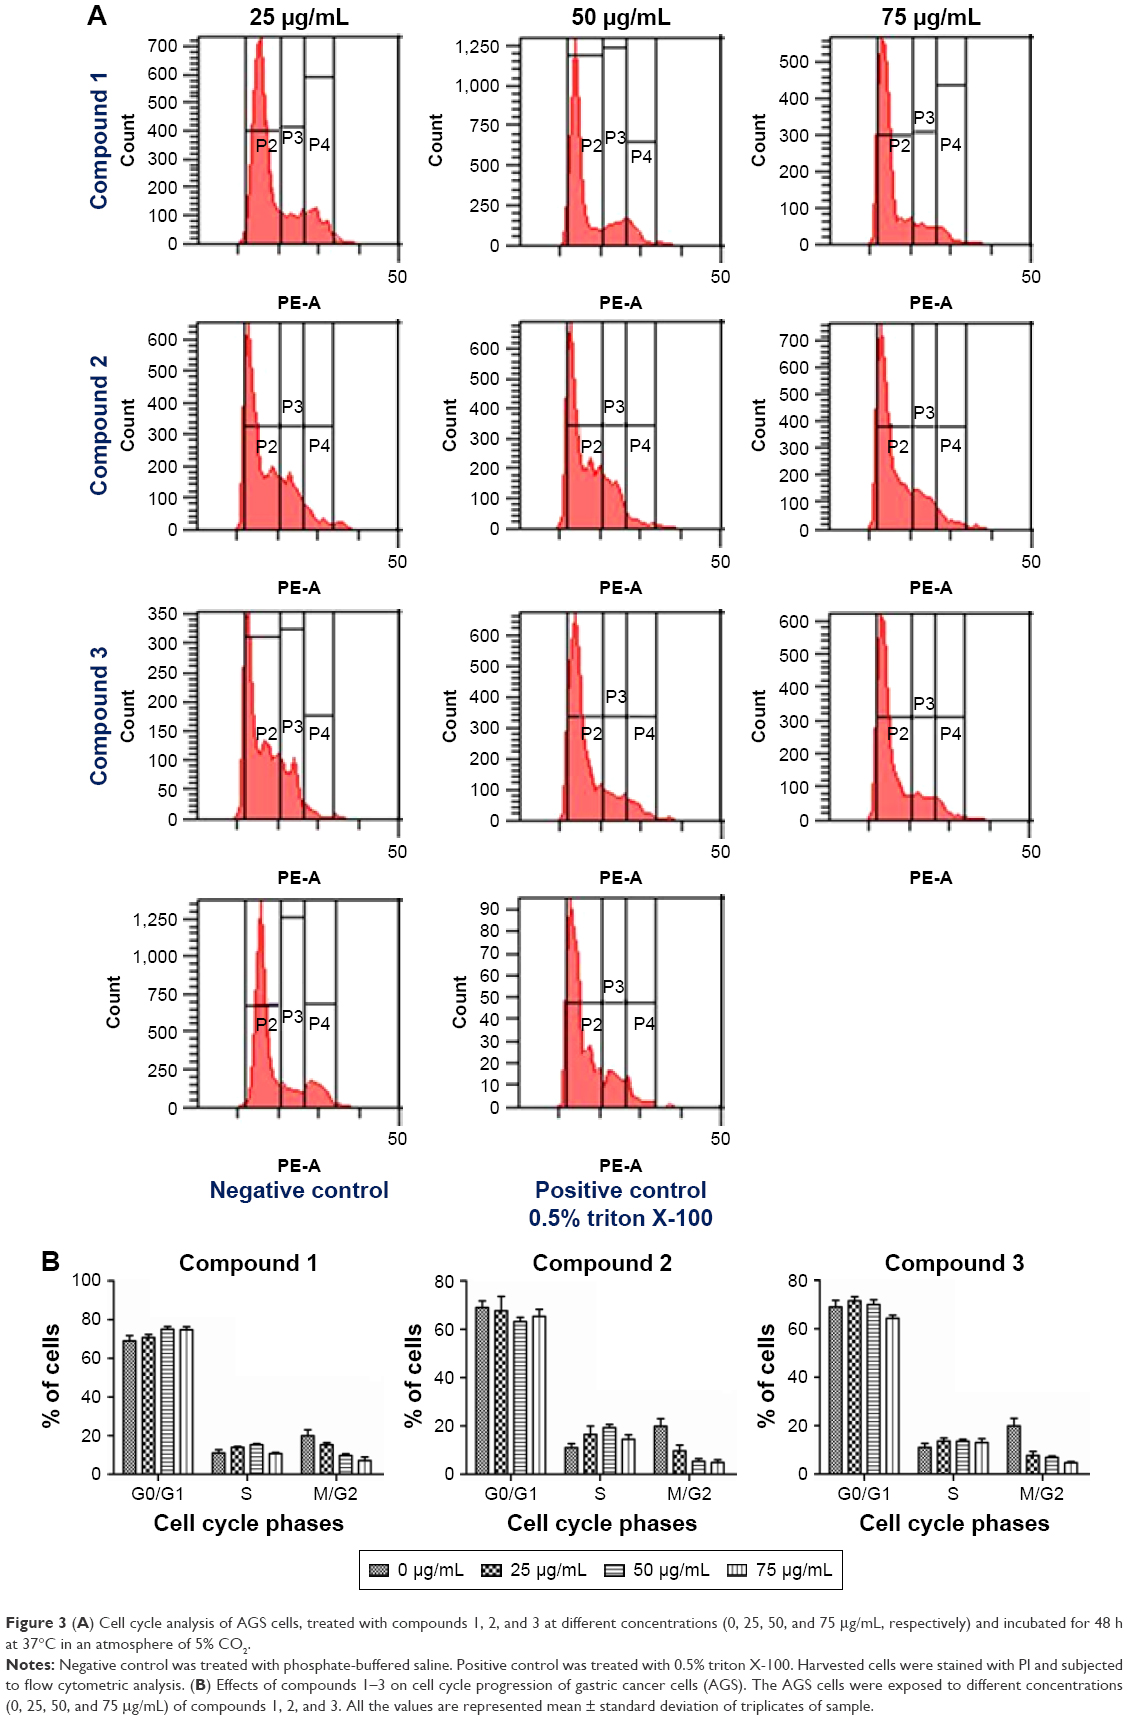 | Figure 3 (A) Cell cycle analysis of AGS cells, treated with compounds 1, 2, and 3 at different concentrations (0, 25, 50, and 75 μg/mL, respectively) and incubated for 48 h at 37°C in an atmosphere of 5% CO2. |
These data suggest that compounds 1–3 have the ability to reduce cell proliferation by inhibiting the enzymes or receptors or factors involved in mitotic phase/Gap 2 phase of cell division. Hence, it is presumed that compounds 1–3 might have shown a conspicuous effect on any one of the receptors or target proteins involved in the gastric cancer cell proliferation. Furthermore, the computational target/ligand-based screening was carried out to propose ideal target for compounds 1–3 and to identify potent molecular scaffolds.
Molecular docking
Docking analysis of compounds 1–3 was performed with various pharmacologically potential targets involved in various stages of cell proliferation. The docking results have shown that intracellular TK domain of HER2 and VEGFR2 have highest dock score (S), whereas EGFR has shown significant dock score with all the compounds (1–3). In addition, FGFR, cyclin A, and caspases 3, 6, and 8 have shown moderate inhibition with these compounds.
The binding energies and binding affinity values for compounds 1–3 against these target proteins were calculated using MM-GB/VI solvent implicit function in MOE after energy minimization of protein–ligand complex, which are summarized in Table 1. It is well documented that human EGFR 2 (HER2) on the cell surface was found to regulate cell proliferation, differentiation, and migration after binding with EGF in the extracellular ligand-binding domain.
 | Table 1 Bonding characterization and binding energies in kcal/mol with various molecular therapeutic targets involved in gastric cancer |
In this study, HER2 was selected as a target protein for further comprehensive analysis. The results showed that compounds 2 and 3 have exhibited good dock score, and compound 1 has shown moderate dock scores of −28.2, −22.8, and −15.2, respectively.
Molecular modeling of DGA loop region to HER2
It is reported that the DGA 877–879 regions of these amino acids in the loop were found to play a significant role in the catalytic site of HER2. As these three residues are not found in the experimentally resolved HER2 (PDB id: 3PP0) structure in the open form, modeling of this missing loop region (DGA) was carried out in crystallographic model (3PP0)30 through homology modeling using MODELLER 9.13v31 and reconstructed the stable model of HER2 with missing residues. The low dope scorer basic model was used for docking and MDS.
Pharmacophore elucidation
To strengthen the in vitro bioassays with these compounds, the complex-based pharmacophore model was generated for docking poses of compounds 1–3 to understand the structural features involved in binding with TK domain of HER2. The complex-based pharmacophore modeling is a technique to determine the features of interacting points in ligand molecule so as to improve the binding affinity and selectivity.
The interactions in the complexes formed between compounds 1–3 and tyrosine kinase domain of HER2 (protein–ligand complexes) were analyzed through Ligplot module implemented in MOE software. Totally, 14 key features were found for compound 1, which include five hydrophobic centers (Hyd), three H-bond acceptors (Acc), three Aromatic centers (Aro), one H-bond donor, and one Pi ring center (Pir); for compound 2, totally 16 pharmacophoric features were observed which include seven H-bond donors and acceptors (Don & Acc), three Hyd, two Aro, one Hyd/Aro, whereas for compound 3, totally 14 features including five H-bond Don & Acc, four Hyd, three H-bond Acc, one Aro, and one Hyd/Aro were identified in the resultant pharmacophore model of compounds 1–3 using pharmacophore query editor implemented in MOE. These features play a crucial role in the formation of interactions (hydrogen bond, hydrophobic bond, hydrophilic, and ionic bond interactions) with functional groups of inhibitor binding site residues leading to inactivation of kinase domain of HER2 (Figure 4A).
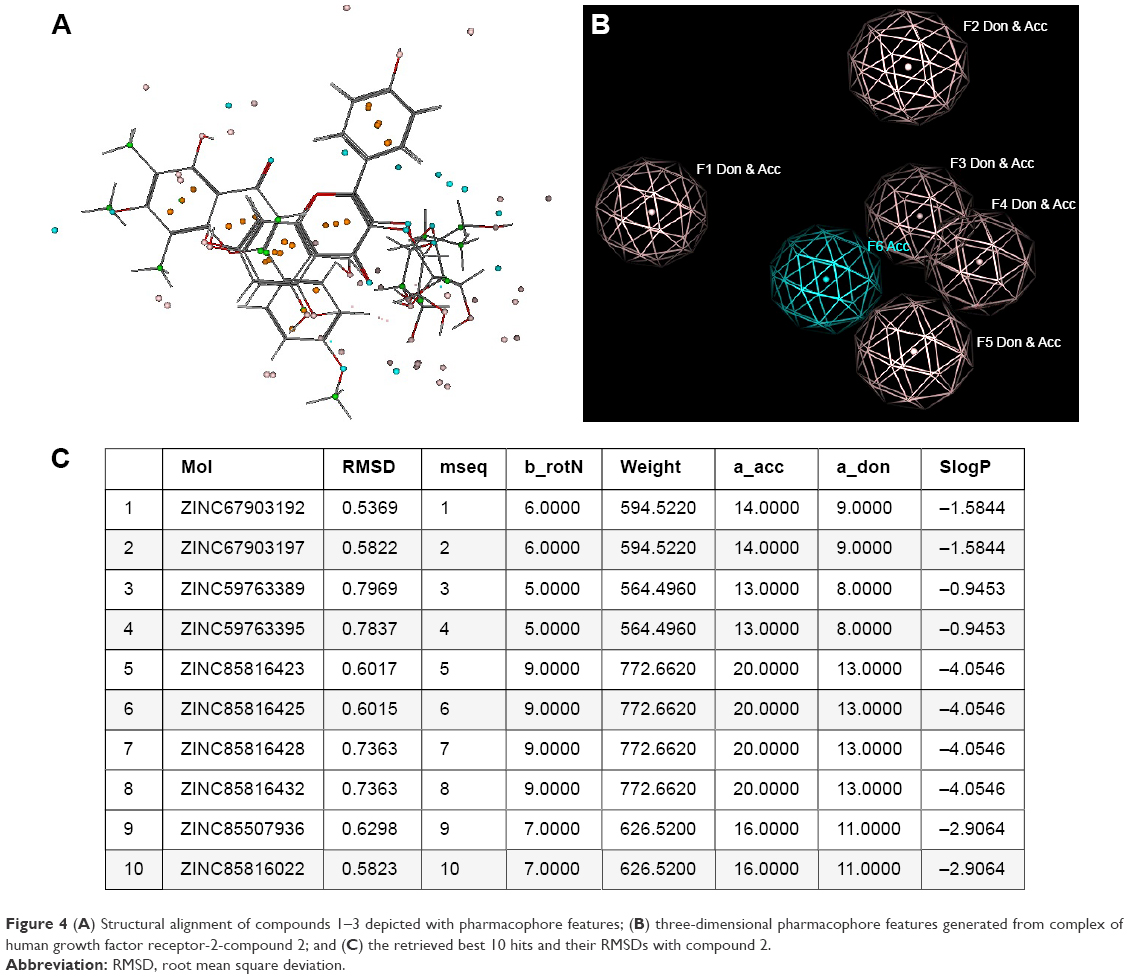 | Figure 4 (A) Structural alignment of compounds 1–3 depicted with pharmacophore features; (B) three-dimensional pharmacophore features generated from complex of human growth factor receptor-2-compound 2; and (C) the retrieved best 10 hits and their RMSDs with compound 2. |
Pharmacophore-based virtual screening
The mapped pharmacophore features in the structures of compounds 1–3 have played a significant role in the inhibition of HER2 activity. Both compounds 2 and 3 have exhibited significant binding score, good H-bond interactions with catalytic site of HER2. Compound 1 has formed only one H-bond between hydrogen of 5-OH and oxygen at C=O group of Met801 by donating an electron pair. Compound 2 has formed two H-bonds one between hydrogen atom of 4′-OH group and oxygen atom at C=O group of Ser728 by donating an electron pair, second one between oxygen atom of 4′-OH group and nitrogen atom of Gly729 by accepting an electron pair. The 6″-OH of glucose moiety of compound 2 has formed one hydrogen bond with NZ atom of Lys736 by accepting an electron pair. The oxygen atom of 2″ and 3″-OH groups of glucose moiety has formed two H-bonds one with NE and another one with NH of Arg849 by accepting an electron pair. The oxygen atom of 7-OH group has formed one hydrogen bond with OG of Thr798 by accepting an electron pair, whereas compound 3 has formed one hydrogen bond between hydrogen atom of 4′-OH group and OD of Asp808 by donating an electron pair. The 5-OH of compound 3 has formed one H-bond with OD of Asp863 by donating an electron pair.
Based on the significant cytotoxic profile of compound 2 on human gastric cancer cells with highest dock score and good binding affinity to HER2, the constructed pharmacophore model of compound 2 from docked complex of HER2-compound 2 was chosen as a query by selecting seven pharmacophore features, that is, F1-6 Don & Acc and F7 Acc (Figure 4B) to screen similar featured hits in the local data set of flavonoids (2,890 compounds), which have been retrieved from ZINC database with 90% similarity to compound 2. As a result of the pharmacophore-based virtual screening with respective database, 34 hits have been retrieved, which share similar type of pharmacophore features as compound 2 without losing the backbone structure (Table S1). The identified new flavonoid hits from the local data set possesses many more features than compound 2, which might increase the specificity and selectivity of lead molecule toward HER2 inhibition (Figure 4C). The collected hits were further validated to know the drug ability of retrieved hit (ligand) using Lipinski rule of five and adsorption, distribution, metabolism, excretion, and toxicity properties through OSIRIS property explorer and molinspiration (Table 2).
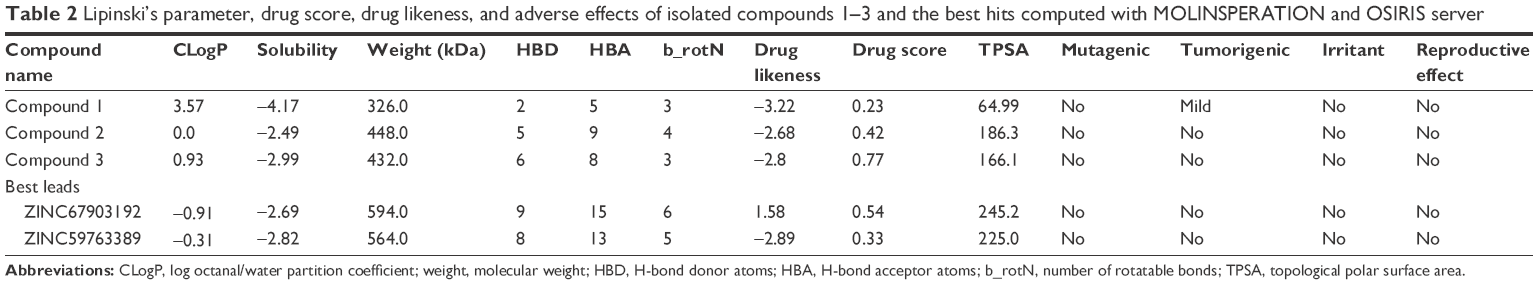 | Table 2 Lipinski’s parameter, drug score, drug likeness, and adverse effects of isolated compounds 1–3 and the best hits computed with MOLINSPERATION and OSIRIS server |
All the validated hits were docked into the inhibitor binding site of TK domain of HER2 using docking protocol implemented in MOE, with a maximum of 10 conformations to save for each ligand. Three best similar hits were identified, namely, ZINC67903192, ZINC59763389, and ZINC85816423, with the highest docking scores of −32.2, −28.4, and −27.2, respectively, than compound 2 (Table 3).
 | Table 3 Bonding characterization of similar pharmacophore hits for compound 2 from ZINC database against HER2 |
Molecular dynamic simulations
The MDS were carried out to investigate the mode of inhibition of HER2 and stability of protein and protein–ligand complexes by means of dynamic trajectories, that is, root mean square deviation (RMSD), RMS fluctuations (RMSFs), radius of gyration (Rg), and solvent access for surface area (SASA).
The result of calculated RMSDs of liganded and unliganded HER2 with respect to initial model and during 20 ns of MDS was plotted (Figure 5A). With the evidence of RMSD graph, the structure showed a sharp increase in the first 2.5 ns followed by equilibrium at ~7.5 ns, a short increase up to 8 ns and then followed by short increase up to 13 ns; afterward the structure gets equilibrated throughout 20 ns.
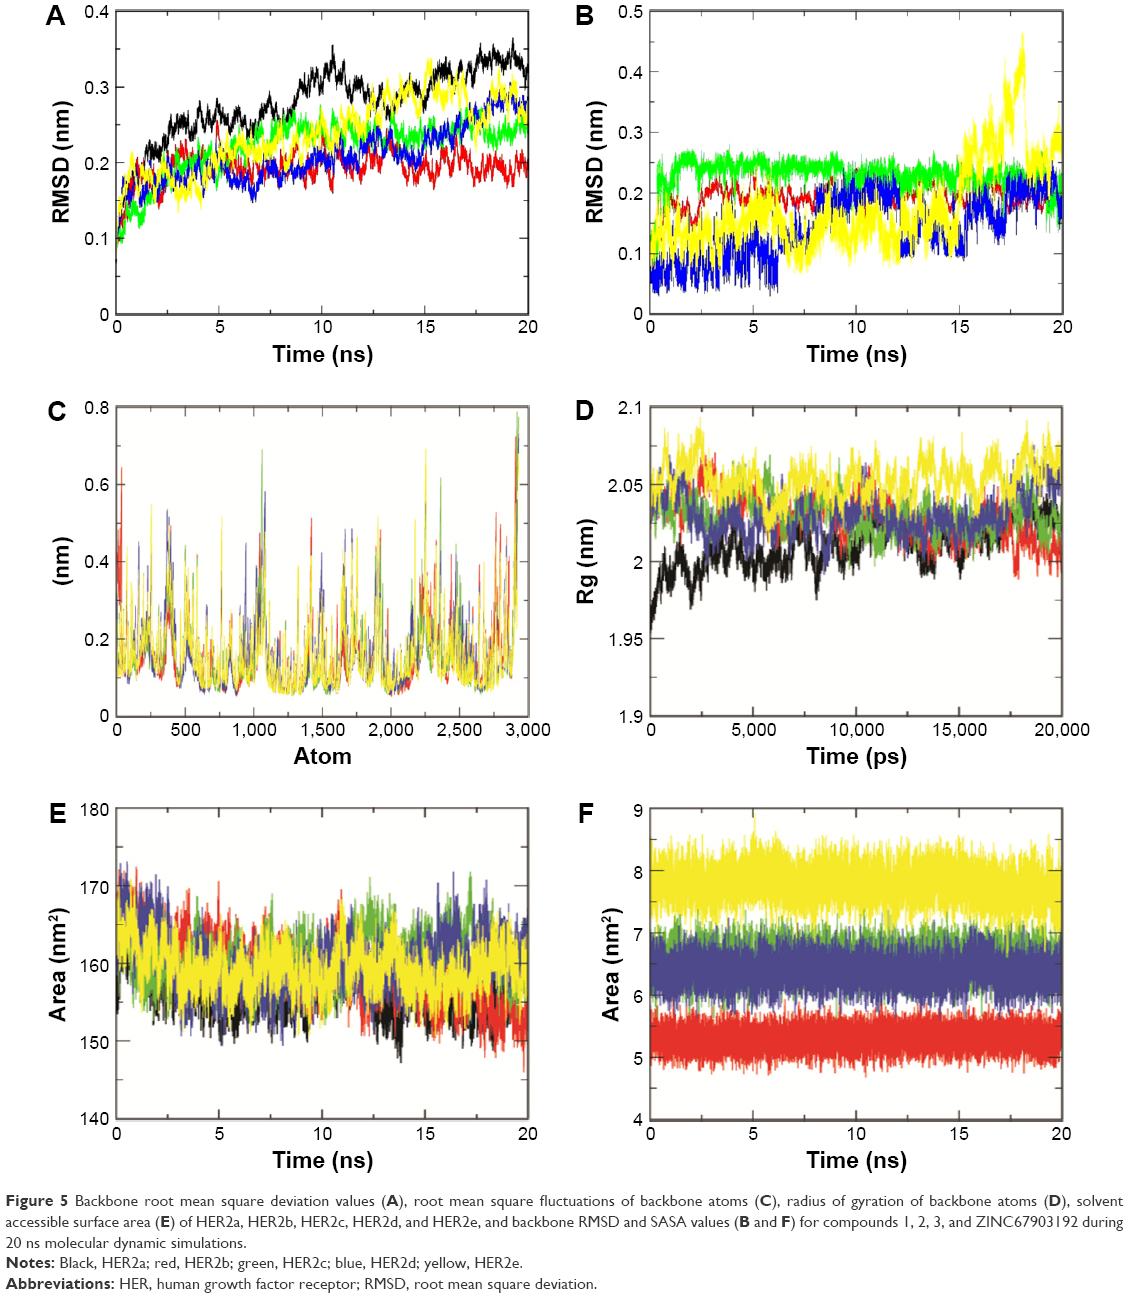 | Figure 5 Backbone root mean square deviation values (A), root mean square fluctuations of backbone atoms (C), radius of gyration of backbone atoms (D), solvent accessible surface area (E) of HER2a, HER2b, HER2c, HER2d, and HER2e, and backbone RMSD and SASA values (B and F) for compounds 1, 2, 3, and ZINC67903192 during 20 ns molecular dynamic simulations. |
The RMSD values of each liganded HER2, namely, HER2b, HER2c, HER2d, and HER2e complexes with compounds 1, 2, 3, and ZINC67903192 were plotted from 0 to 20 ns as shown in the Figure 5B. From the RMSD values, the HER2b complex structure showed a sharp increase up to 5 ns, followed by stabilization and equilibrium up to 20 ns where the data points fluctuated with an average RMSD of 0.82 nm. The HER2c showed a sharp increase of RMSD and reached 0.25 nm at 7.5 ns. Subsequently, the complex acquired stability and equilibrated up to 20 ns with small fluctuation having average RMSD of 0.22 nm, whereas the HER2d showed a sharp increase of RMSD up to 0.192 nm at 5 ns with a sudden decrease toward 0.15 nm at 7.5 ns. The complex acquired stability and equilibrium with the fluctuation of RMSD in an average of 0.195 nm toward 14 ns of time, followed by a slight increase up to 17 ns; the complex was stabilized and equilibrated up to 20 ns of simulations.
In addition to the above complexes, the protein with the best lead molecule, that is, ZINC67903192, namely, HER2e, was subjected for 20 ns MDS in order to validate its efficiency of binding with HER2 when compared to compounds 1–3. The HER2e showed sharp increase of RMSD up to 0.21 nm at 1.25 ns. After the complex maintained equilibrium up to 4.0 ns, a sudden increase of RMSD was observed up to 0.25 nm at 6 ns. After the structure was equilibrated at 12 ns, further sudden increase was observed, which reached RMSD of 0.3 nm at 15 ns. A sudden decrease of RMSD started at 17 ns and RMSD decreased to 0.2 nm at 17.5 ns (Figure 5A).
The conformational changes with the RMSD of docked poses of compounds 1, 2, and 3 and lead molecule in the binding pocket of HER2 were also evaluated, during 20 ns of MDS (Figure 5B). The compounds 1 and 2 showed sharp increase of RMSD up to 0.2 and 0.25 nm, respectively, at 1.25 ns followed by equilibrium of the structure up to 20 ns. Compound 3 showed slow increase of RMSD at 8 ns and the structure maintained equilibrium. Again it showed decreased RMSD at 12.5 ns followed by equilibrium toward 20 ns with small fluctuations. Whereas the lead molecule identified in pharmacophore-based virtual screening maintained equilibrium with the average RMSD of 1.5 nm up to 15 ns followed by a sudden increase of RMSD, which reached up to 0.45 nm at 17.5 ns. Subsequently, the lead molecule showed a sudden decrease and reached 0.25 nm followed by an equilibrium of the structure up to 20 ns MDS.
The comparative analysis of RMSF profile of unliganded protein and protein bound with ligand molecules demonstrated fluctuations in a range of 0–1.5 nm at the catalytic site of HER2 (Figure 5C). Whereas no significant fluctuations were observed at the same catalytic site in docked complexes of HER2-compound 1, HER2-compound 2, HER2-compound 3, and HER2-ZINC67903192. Although some of the regions in the protein and protein–ligand complexes have shown high level of mobility with the fluctuations ranging between 0.3 and 0.45 nm, they are not being considered as significant for this study as the major focus is on the dynamic behavior of catalytic site of protein and protein–ligand complexes (Figure 6A and B).
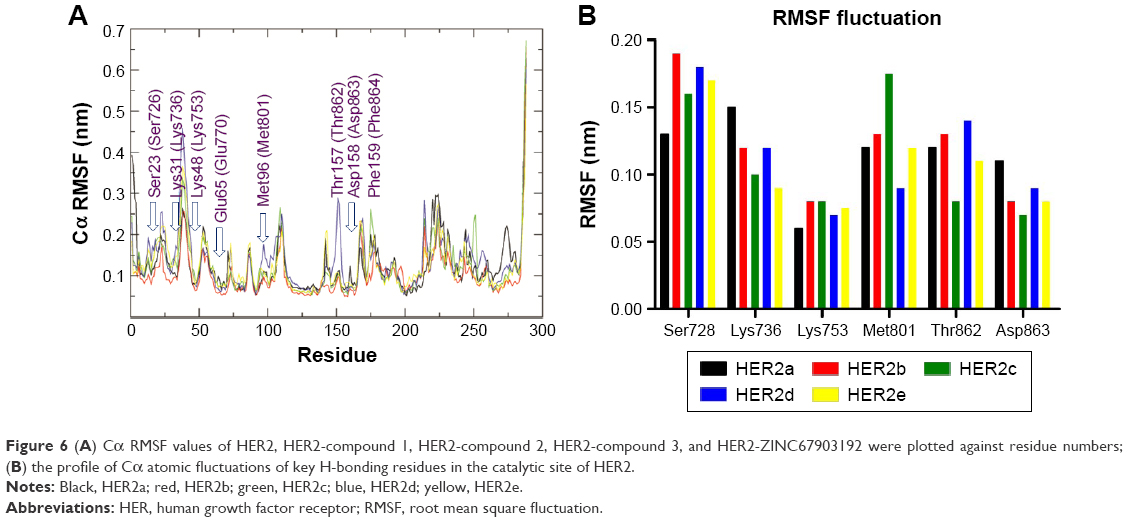 | Figure 6 (A) Cα RMSF values of HER2, HER2-compound 1, HER2-compound 2, HER2-compound 3, and HER2-ZINC67903192 were plotted against residue numbers; (B) the profile of Cα atomic fluctuations of key H-bonding residues in the catalytic site of HER2. |
The changes of secondary structure pattern in HER2 and its inhibition by compounds were also analyzed using DSSP (Database of Secondary Structure of Proteins) software tool.32 The analysis demonstrates the fluctuation of secondary structure elements up to 20 ns of MDS and showed one significant conformational drift from α-helices to turns between the residues of 890–897 in the HER2a at the range of 7–12 ns period of MDS (Figure 7A). Therefore, DSSP analysis was taken up to enumerate the effect of these compounds on the secondary structure components in HER2 during 20 ns of MDS. The conformational changes of secondary structure in HER2 during treatment with compounds 1, 2, 3, and ZINC67903192 and their comparison with unliganded HER2 were plotted.
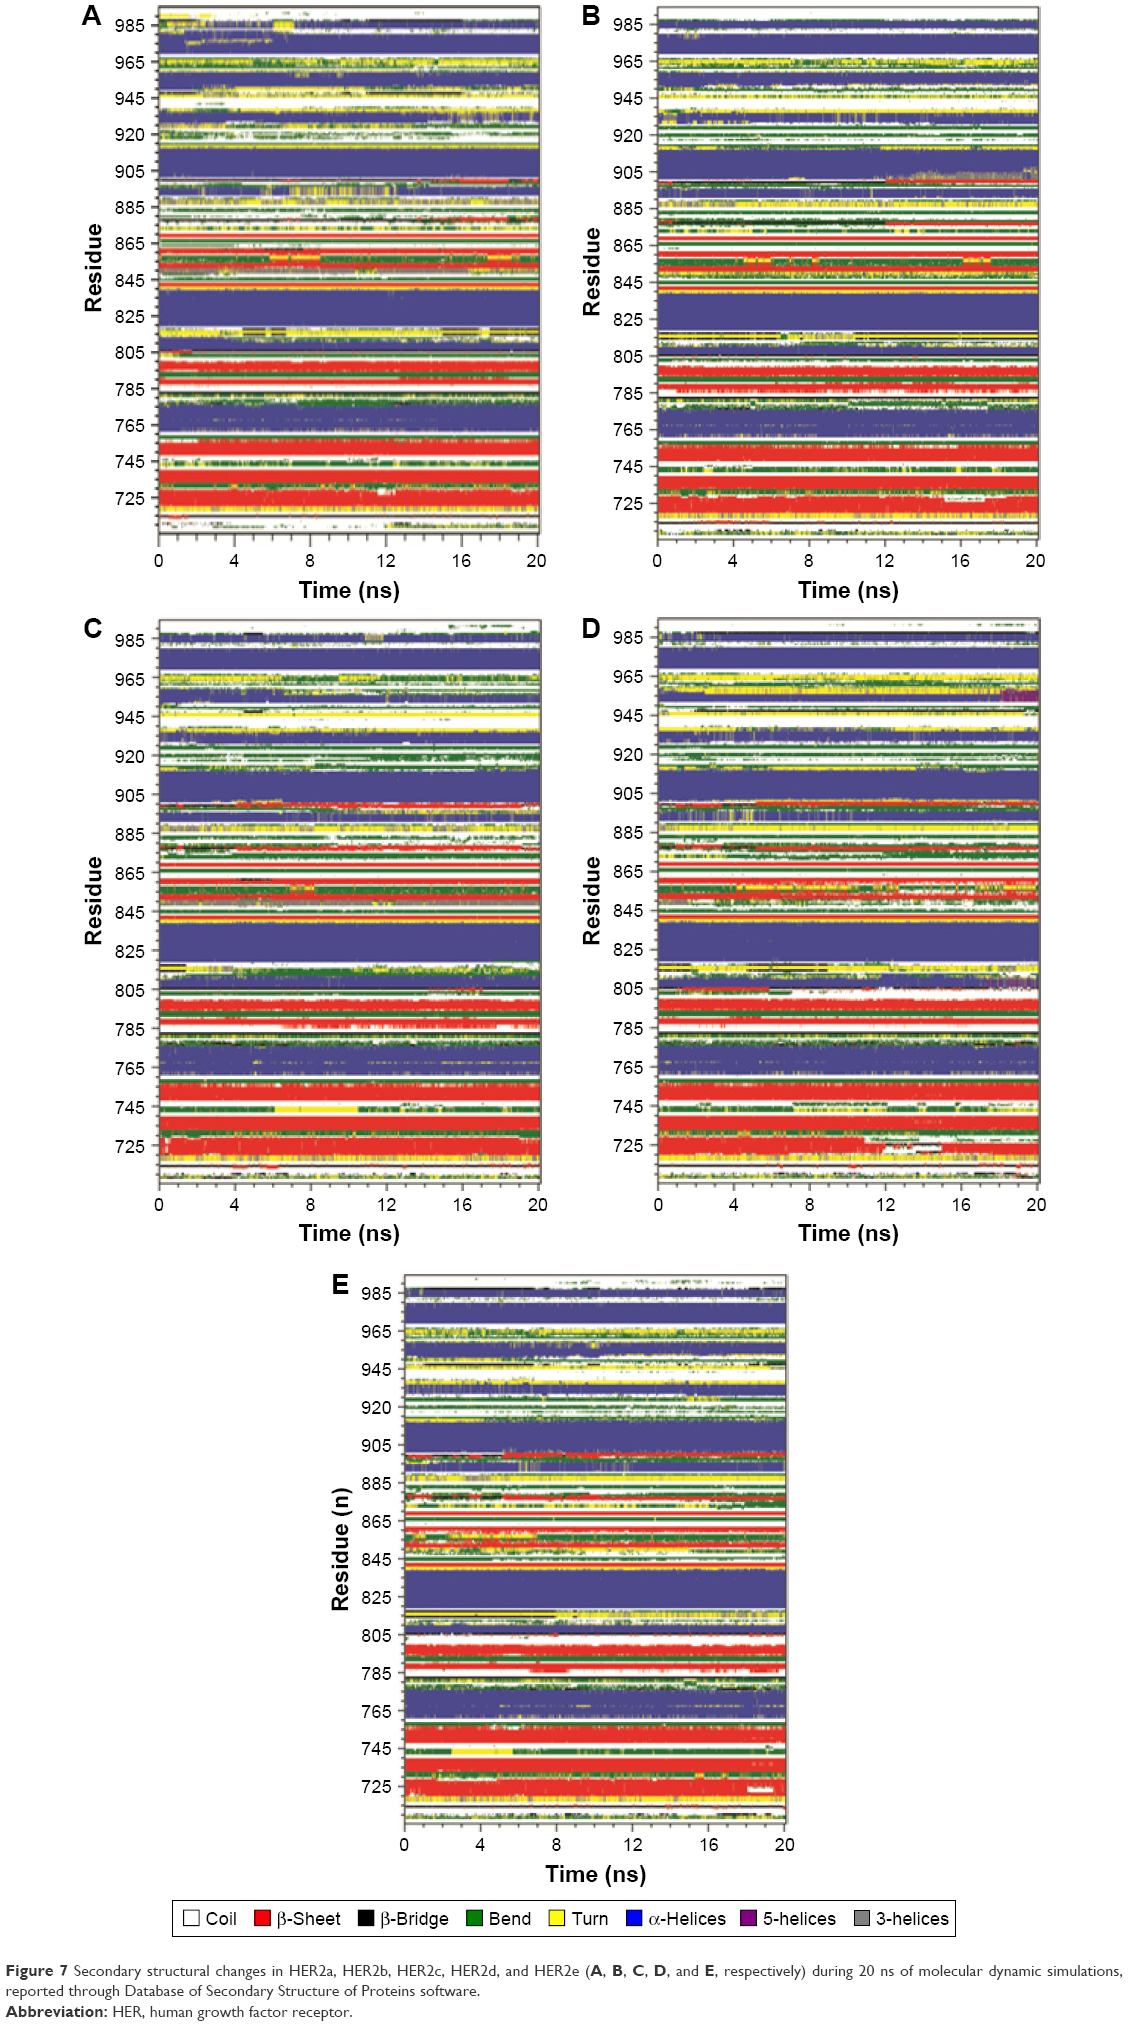 | Figure 7 Secondary structural changes in HER2a, HER2b, HER2c, HER2d, and HER2e (A, B, C, D, and E, respectively) during 20 ns of molecular dynamic simulations, reported through Database of Secondary Structure of Proteins software. |
The results of DSSP analysis showed a higher range of conformational drift of secondary structure components in HER2 during treatment with the compounds. In the structure of HER2b, a conformational change with the replacement of α-helices to three helices was found in the region of 900–905 amino acid residues from 13 ns time interval of MDS. Another conformational drift of three helices to bends and turns was observed in the region of 845–850 amino acid residues (Figure 7B). One conformational drift of bends to turns was found in the region of 740–745 amino acids in HER2c (Figure 7C). The structure of HER2d has shown structural changes of α-helices to 5-helices in the region of 805–810 and 950–955 amino acid residues at the end of 15–20 ns time scale of MDS. A transition of β-sheets to coils was found in the 720–730 amino acid residues in the time scale of 11–15 ns period of MDS and another conformational drift of bends to coils was found in the 800–805 amino acid residues from the time scale of 7 ns (Figure 7D).
Whereas the conformational drifts of bends to turns and bends to β-bridges were found in the region of 740–745 and 812–820 amino acid residues, respectively, in the structure of HER2e. Another conformational drift of bends to coils was observed in the regions of 800–805 and 860–865 amino acids residues, respectively (Figure 7E). Hence, it is obvious from the results that the compounds might inhibit the activity of HER2 in the gastric cancer cell proliferation with no significant structural change in the core region, that is, α-helices and β-sheets of HER2.
Radius of gyration (Rg) is a parameter that defines the equilibrium of conformations in a total system in terms of compaction of protein structure with protein folding and unfolding.33 In the present MD analysis, Rg values for unliganded protein and protein–ligand complexes were determined as shown in Figure 5D. Among them unliganded HER2 showed large deviation in Rg value from protein–ligand complexes. Initially the Rg value of unliganded HER2 started from 1.96 nm which reached 2 nm at 1 ns, and the Rg values were stabilized with low level of fluctuation and maintained equilibrium toward 20 ns of MDS. All the protein–ligand complexes including the lead molecule, ZINC67903192, have maintained equilibrium with the average Rg value of 2.02 nm throughout 20 ns of MDS. The above results demonstrate that the radius of gyration values were higher for protein–ligand complexes when compared to unliganded protein. It clearly indicates that these compounds when interacted with HER2 alter the microenvironment of protein causing conformational changes in protein structure with higher Rg values. The lead molecule, ZINC67903192, has shown significant inhibition on HER2 with higher Rg value of 2.07 nm during 20 ns of MD simulations.
SASA is a geometric measure of protein surface interactions and spread around with outer environment of solvent. The SASA value area (nm2) is directly proportional to the rate of amino acid in the protein that is exposed to solvent environment.34 Perturbations of SASA value will change the amino acids exposed to the solvent, as a result affecting the overall conformation of the protein. The results from SASA analysis of protein and protein–ligand complexes during 20 ns MDS showed variation among the unliganded protein and protein–ligand complexes. The unliganded HER2 has shown an average area of 154 nm2 of SASA value, whereas the liganded HER2, namely, HER2b, HER2c, HER2d, and HER2e, have exposed to solvent environment with an average areas of 158, 163, 164, and 160 nm2, respectively. The compounds in the binding pockets have been exposed to solvent in the order of “compound 1 > compounds 2 and 3 > ZINC67903192,” which is based on the molecular weight and complexity of the molecule (Figure 5F).
Protein–ligand interaction during MDS
The docked complexes such as HER2–compound 1, HER2–compound 2, HER2–compound 3, and complex of identified pharmacophore hit ZINC67903192 and HER2 were subjected to MDS in order to study the stability of the complex, H-bonding profile of ligand molecule with catalytic site residues.
The results of H-bonding profile demonstrate that compound 1 exhibits two H-bonds: one is stable and the other is weak throughout the 20 ns MDS. Compound 1 formed H-bonds with hydrophobic amino acid (Alanine), polar amino acids (Serine and Methionine), and charged amino acid (Arginine). Among these, Ser728 and Ala730 of phosphate-binding loop formed two H-bonds, Arg849 of catalytic loop formed one H-bond, and Met801 formed one weak H-bond with compound 1 (Figures 8A and S1A). The bonding profiles and their intensity throughout the simulation period are reported in Figure S1B. Ala730 and Arg849 maintained an average distance of 0.25 nm, and Ser728 and Met801 maintained average distances of 0.55 and 0.4 nm, respectively, with the compound 1 in the entire period of 20 ns MDS (Figure S2).
 | Figure 8 Molecular interactions of compounds 1, 2, 3 and structural hit ZINC67903192 with tyrosine kinase domain of human growth factor receptor-2 (A, B, C, and D, respectively). |
Compound 2 formed four H-bonds, among them two bonds were strong and the other two bonds were weak throughout the simulation of 20 ns with the dock score of −28.2. Compound 2 was buried with glycine-rich nucleotide phosphate-binding loop of active site of TK domain in HER2 (Figures 8B and 9A). Among these three hydrophobic amino acids, Leu726, Gly727, and Gly729 formed three H-bonds and one polar amino acid, Met801, formed one H-bond with compound 2 (Figure 9B). The average distances between compound 2 and active site H-bond forming residues, namely, Leu726, Gly727, Ser728, Gly729, and Met801, were found to be 0.3, 0.32, 0.3, 0.33, and 0.38 nm, respectively, in the entire 20 ns simulation period (Figure S3).
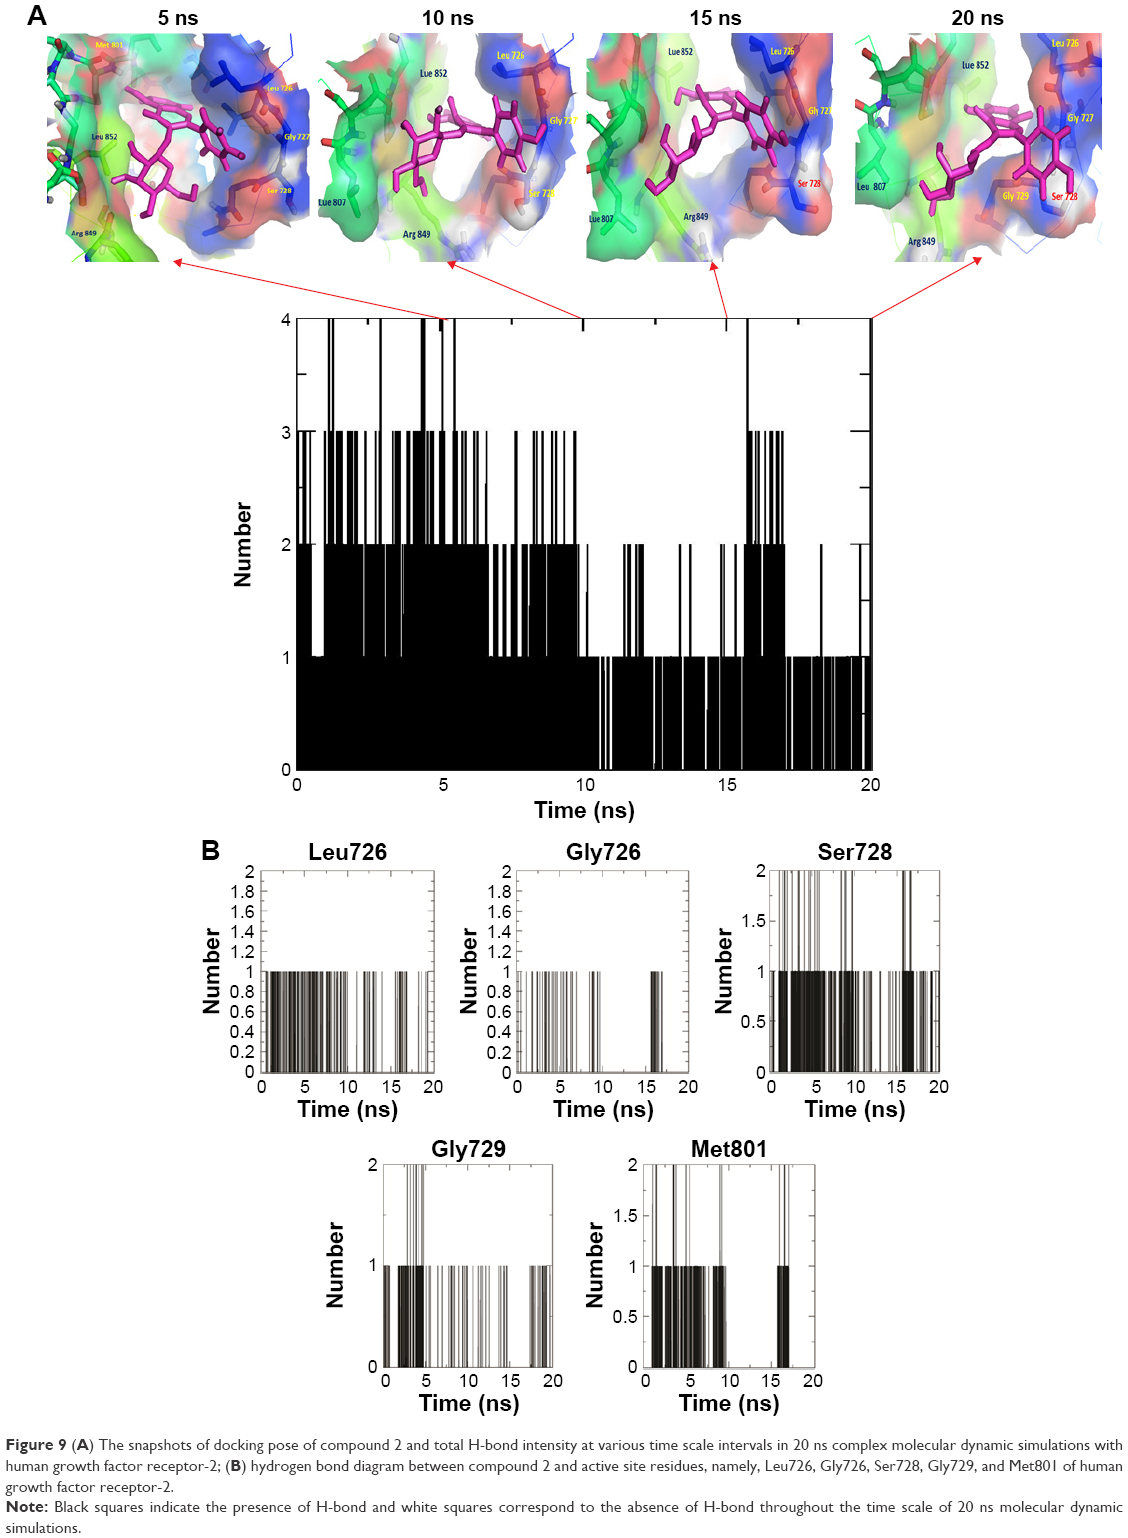 | Figure 9 (A) The snapshots of docking pose of compound 2 and total H-bond intensity at various time scale intervals in 20 ns complex molecular dynamic simulations with human growth factor receptor-2; (B) hydrogen bond diagram between compound 2 and active site residues, namely, Leu726, Gly726, Ser728, Gly729, and Met801 of human growth factor receptor-2. |
Compound 3 formed four H-bonds, among them three were more stable and one was weak bond throughout the simulation of 20 ns with dock score of −22.8 (Figures 8C and S4A). Compound 3 also occupied the same site, located in between the phosphate-binding loop and DGF (aspartic acid–glycine–phenylalanine) motif region of catalytic site. The amino acids, that is, Leu726, Gly727, Ser728, and Gly729, in the glycine-rich, phosphate-binding loop or C-terminal lobe of kinase and Met801 in the polar region made significant H-bond interactions with compound 3. In addition, Lys736 and Thr862 formed H-bond interactions. The bonding profile of compound 3 with the bond intensity in the various time intervals of 20 ns MDS is reported in Figure S4B. The flexibility of these residues was investigated by measuring the distance with compound 3 at various time intervals of 20 ns simulation period. Compound 3 maintained the average distance to key H-bond forming residues, namely, Leu726, Gly727, Ser728, Gly729, Lys736, Met801, Thr862, and Asp863, with 0.32, 0.35, 0.37, 0.36, 0.52, 0.30, 0.33, and 0.42 nm, respectively, throughout the simulation period (Figure S5).
The compound ZINC67903192 that was identified as a lead molecule formed the highest number of 5–6 H-bonds, among them three were more stable and the remaining three were weak bonds throughout the 20 ns MDS. The proposed pharmacophore hit showed RMSD of 0.536 Å with compound 2. It is also conspicuous that ZINC67903192 differs from compound 2 with additional rhamnosyl sugar moiety that was linked to 2″-OH of glucose moiety. Obviously, ZINC67903192 occupied the same binding pocket and similar pattern of H-bonding profile as observed in compound 2 with high affinity and specificity (Figures 8D and 10A). ZINC67903192 showed significant H-bonding residues of Leu726, Gly727, and Ser728 in the glycine-rich nucleotide phosphate-binding loop at ATP binding pocket of TK domain. In addition, Thr862, Asp863 in the DFG motif region and Met801 have participated in the formation of H-bonds (Figures 8D and 10B). The distance between these amino acid residues and ZINC67903192 was measured by analyzing distance plot calculations throughout the timescale of 20 ns MDS. The compound ZINC67903192 maintained an average distance with the H-bond-forming residues, namely, Leu726, Gly727, Ser728, Met801, Thr862, and Asp863, with 0.3, 0.25, 0.28, 0.52, 0.54, and 0.32 nm, respectively, throughout the simulation period (Figure S6).
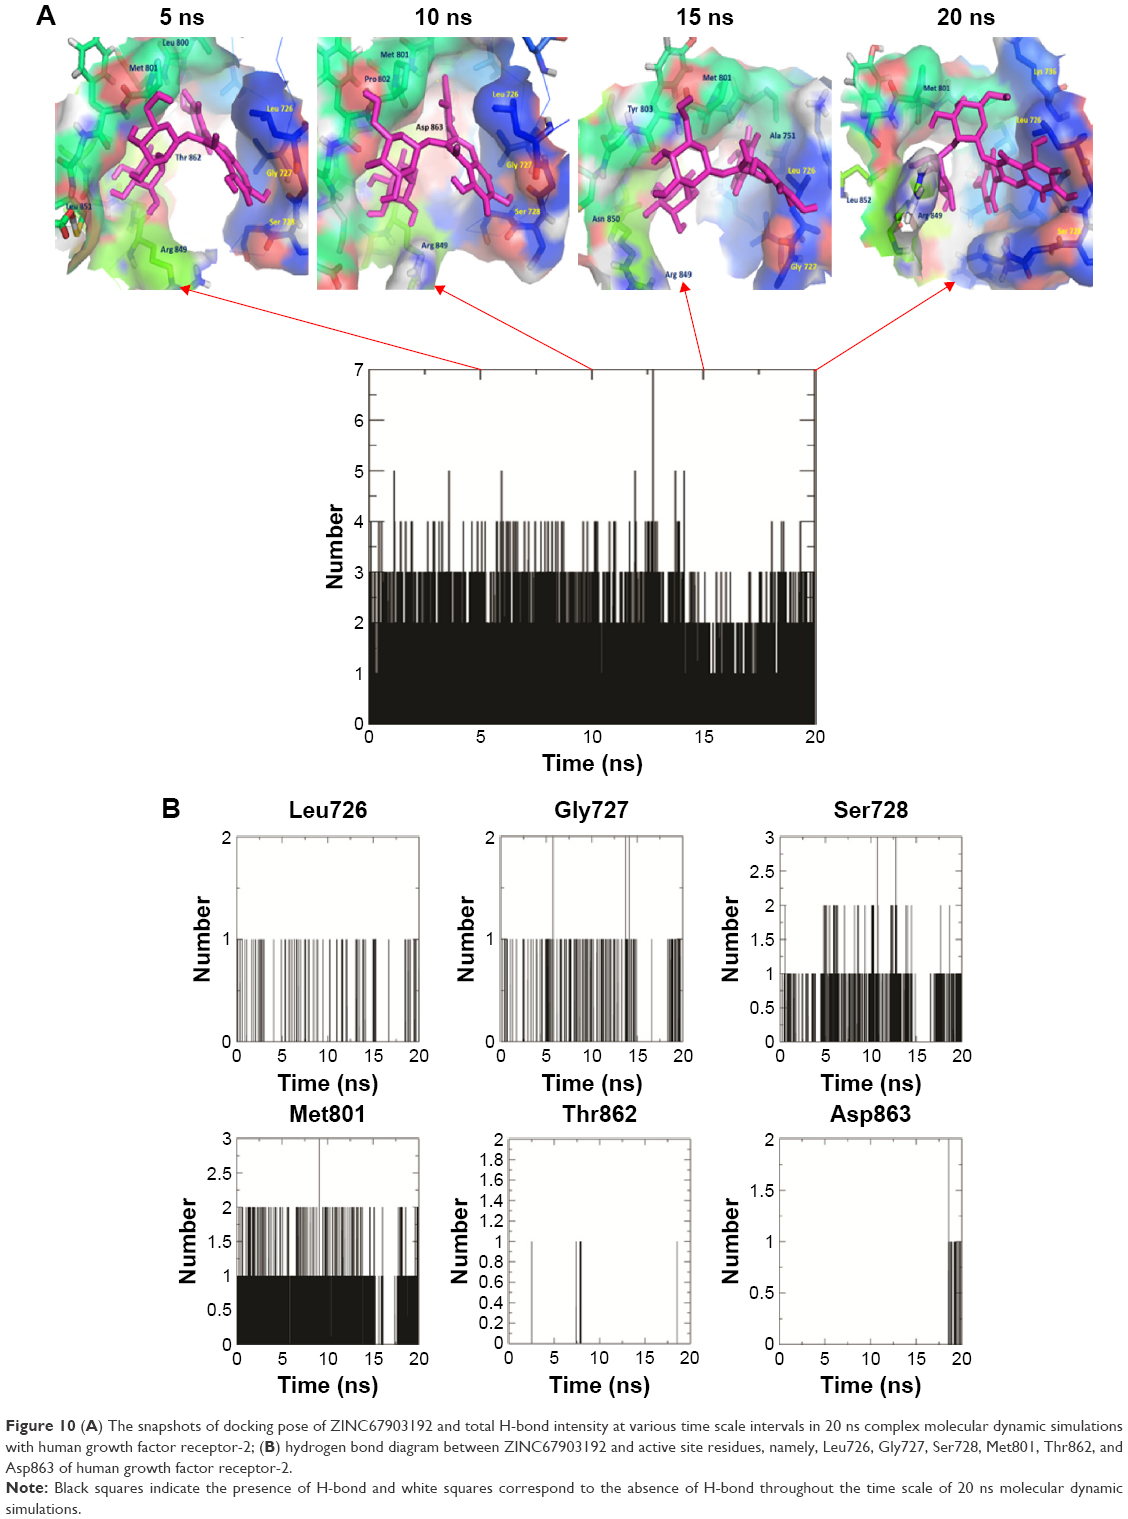 | Figure 10 (A) The snapshots of docking pose of ZINC67903192 and total H-bond intensity at various time scale intervals in 20 ns complex molecular dynamic simulations with human growth factor receptor-2; (B) hydrogen bond diagram between ZINC67903192 and active site residues, namely, Leu726, Gly727, Ser728, Met801, Thr862, and Asp863 of human growth factor receptor-2. |
From the point of gastric cancer metabolic pathways, many enzymes and factors are involved in the regulation of cell proliferation and differentiation, among those HER2 is pharmacologically important. Based on the present in silico investigation on gastric cancer cell proliferation, it was found that the observed binding energies of compounds 1–3 toward HER2 showed significant correlation with the inhibitory concentrations obtained through bioassays. The retrieved pharmacophore hits shared structural features similar to compound 2, with higher binding energy and affinity toward HER2.
The best hits for compound 2 were found to be mostly beyond the Lipinski rule of five with >500 kDa molecular weight, five H-bond acceptor, 10 H-bond donors, and without any significant adverse effects (namely, irritant, mutant, and effect on reproductive system). However, they show good binding affinity toward HER2, as natural products and their derivatives are structurally complex and cover much larger space and also have a large number of chiral centers, rings, and functional groups, which allow for higher ligand affinity. These features are not satisfied by combinatorial and synthetic compounds, even though they are satisfied by the Lipinski rule of five.
Hence, it is recommended that these hits may be considered eligible leads for gastric cancer drug discovery. The present in silico investigation has demonstrated that docked conformers of selected hits are able to adapt suitable orientation with the binding pocket of HER2 similar to known inhibitor, Lapatinib,35 which made interactions with the active site amino acid residues, namely, Ser726, Lys736, Lys753, Glu770, Met801, Thr862, Asp863, and Phe864, that are principally conserved in all EGFR. Keeping in view the pivotal activity of selected hits in the in silico observations, the chemical synthesis of these hits and related molecular scaffolds may have clinical relevance for effective modulation of HER2/EGFR activity in gastric cancer.
Conclusion
This study demonstrated that the isolated flavonoid compounds 1, 2, and 3 isolated from the fruit extract of SA significantly inhibited the cell proliferation of human gastric cancer cells by arresting G2/M phase of cell cycle. Furthermore, computational molecular docking and complex-based pharmacophore mapping of these compounds were performed with molecular therapeutic targets of gastric cancer, that is, HER2.
MDS of protein–ligand complex were employed in order to decipher the stability and mode of inhibition of HER2 associated with gastric cancer cell proliferation. In addition, pharmacophore-based virtual screening was taken up with a query of compound 2, due to its significant inhibition on human gastric cancer cell proliferation and also has shown significant activity in in silico approach in terms of binding affinity toward HER2. These approaches successfully screened out three novel flavonoid analogs for compound 2 from ZINC database, namely, ZINC67903192, ZINC59763389, and ZINC85816423, which have shown docking scores of −32.2, −28.4, and −27.2, respectively. These hits have more number of H-bond acceptor/donor features than compound 2, which improved the specificity and selectivity with high binding affinity toward HER2. Furthermore, the MD analysis of all the docked complexes revealed that these compounds might have caused significant interruption of signaling pathway by inhibiting HER2 as evidenced by the comprehensive analysis of RMSD, RMSF, Rg, SASA, and distance plot calculations. All the compounds docked deeply with the binding pocket region and established interactions with the active site amino acid residues, namely, Ser726, Lys736, Lys753, Glu770, Met801, Thr862, Asp863, and Phe864 of HER2. Consequently, the chemical synthesis of these flavonoid hits is underway in our laboratory to explore the effective modulation of HER2 signaling.
Hence, our investigation serves as a starting point to develop novel HER2 inhibitors against gastric cancer from natural herbal sources, with improved efficacy, specificity, and fewer side effects.
Acknowledgments
The authors are grateful to Dr Niyaz Ahmed, University of Hyderabad, for providing cell culture facility. They are also thankful to Dr T Sivaraman and S Siva Rajesh (SASTRA University, Thanjavur, India) for their technical help in running MDS.
Disclosure
The authors report no conflicts of interest in this work.
References
Parkin DM, Bray F, Ferlay J, Pisani P. Global cancer statistics, 2002. CA Cancer J Clin. 2005;55(2):74–108. | ||
Crew KD, Neugut AI. Epidemiology of gastric cancer. World J Gastroenterol. 2006;12(3):354–362. | ||
Arak A, Kull K. Factors influencing survival of patients after radical surgery for gastric cancer. A regional study of 406 patients over a 10-year period. Ann Oncol. 1994;33(8):913–920. | ||
Cunningham D, Allum WH, Stenning SP, et al. Perioperative chemotherapy versus surgery alone for respectable gastroesophageal cancer. N Engl J Med. 2006;355(1):11–20. | ||
Sikora K. Personalized cancer therapy-the key to the future. Pharmacogenomics. 2004;5(4):225–228. | ||
Wang X, Yan SK, Dai WX, Liu XR, Zhang WD, Wang JJ. A metabolomics approach to chemosensitivity prediction of cisplatin plus 5-fluorouracil in a human xenograft model of gastric cancer. Int J Cancer. 2010;127(12):2841–2850. | ||
Bang YJ, van Cutsem E, Feyereislova A, et al. Trastuzumab in combination with chemotheraphy versus chemotheraphy alone for treatment of Her2-positive advanced gastric or gastric or gastro-oesophageal junction cancer (ToGA): a phase 3, open-label, randomized controlled trail. Lancet. 2010;376(9742):687–697. | ||
Hynes NE, Ingham PW, Lim WA, Marshall CJ, Massagué J, Pawson T. Signalling change: signal transduction through the decades. Nat Rev Mol Cell Biol. 2013;14(6):393–398. | ||
Cidon EU, Ellis SG, Inam Y, Adeleke S, Zarif S, Geldart T. Molecular targeted agents for gastric cancer: a step forward towards personalized therapy. Cancers. 2013;5(1):64–91. | ||
Garcia F, Vizoso A, Martin L, et al. Clinical significance of the epidermal growth factor receptor and HER2 receptor in resectable gastric cancer. Ann Surg Oncol. 2003;10(3):234–241. | ||
Hayashi M, Inokuchi M, Takagi Y, et al. High expression of HER3 is associated with a decreased survival in gastric cancer. Clin Cancer Res. 2008;14(23):7843–7849. | ||
Burgess AW, Cho HS, Eigenbrot C, et al. An open-and-shut case? Recent insights into the activation of EGF/ErbB receptors. Mol Cell. 2003;12(3):541–552. | ||
Riquelme I, Saavedra K, Espinoza JA, et al. Molecular classification of gastric cancer: towards a pathway-driven targeted therapy. Oncotarget. 2015;6(28):24750–24779. | ||
Qi F, Li A, Inagaki Y, et al. Chinese herbal medicines as adjuvant treatment during chemo-or radio-therapy for cancer. Biosci Trends. 2010;4(6):297–307. | ||
Kasetti RB, Nabi SA, Swapna S, Apparao C. Cinnamic acid as one of the antidiabetic active principle(s) from the seeds of Syzygium alternifolium. Food Chem Toxicol. 2012;50(5):1425–1431. | ||
Devi S, Ansari SA, Vadivelu J, Mégraud F, Tenguria S, Ahmed N. Helicobacter pylori antigen HP0986 (TieA) interacts with cultured gastric epithelial cells and induces IL8 secretion via NF-κB mediated pathway. Helicobacter. 2014;19(1):26–36. | ||
Bai Y, Zhao F, Li Y, Wang L, Fang XJ, Wang CY. Ginkgo biloba extract induce cell apoptosis and G0/G1 cycle arrest in gastric cancer cells. Int J Clin Exp Med. 2015;8(11):20977–20982. | ||
Mosmann T. Rapid colorimetric assay for cellular growth and survival: application to proliferation cytotoxicity assays. J Immunol Methods. 1983;65(1–2):55–63. | ||
Pozarowski P, Darzynkiewicz Z. Analysis of cell cycle by flow cytometry. Methods Mol Biol. 2004;281:301–311. | ||
MOE. 2011. Molecular Operating Environment 2011.10. Chemical Computing Group Inc., Montreal, QC, Canada. | ||
Labute P. The generalized born/volume integral (GB/VI) implicit solvent model: estimation of free energy of hydration using London dispersion instead of atomic surface area. J Comput Chem. 2008;29(10):1693–1698. | ||
Yang S. Pharmacophore modeling and applications in drug discovery: challenges and recent advances. Drug Discov Today. 2010;15(11–12):444–450. | ||
Berendsen HJC, van der Spoel D, van Drunen R. GROMACS: a message-passing parallel molecular dynamics implementation. Comput Phys Commun. 1995;91(1–3):43–56. | ||
Lindorff-Larsen K, Piana S, Palmo K, et al. Improved side-chain torsion potentials for the Amber ff99SB protein force field. Proteins. 2010;78(8):1950–1958. | ||
Schüttelkopf AW, van Aalten DMF. PRODRG: a tool for high-throughput crystallography of protein-ligand complexes. Acta Crystallogr D Biol Crystallogr. 2004;60(Pt 8):1355–1363. | ||
Berendsen HJC, Grigera JR, Straatsma TP. The missing term in effective pair potentials. J Phys Chem. 1987;91(24):6269–6271. | ||
Berendsen HJC, Postma JPM, Van Gunsteren WF, Dinola A, Haak JR. Molecular dynamics with coupling to an external bath. J Chem Phys. 1984;81(8):3684–3690. | ||
Parrinello M, Rahman A. Polymorphic transitions in single crystals: a new molecular dynamics method. J Appl Phys. 1981;52(12):7182–7190. | ||
Lipinski CA, Lomdardo F, Dominy BW, Feeneey PJ. Experimental and computational approaches to estimate solubility and permeability in drug discovery and development setting. Adv Drug Deliv Rev. 1997;23(1–3):3–25. | ||
Aertgeerts K, Skene R, Yano J, et al. Structural analysis of the mechanism of inhibition and allosteric activation of the kinase domain of HER2 protein. J Biol Chem. 2011;286(21):18756–18765. | ||
Sali A, Blundell TL. Comparative protein modeling by satisfaction of spatial restraints. J Mol Biol. 1993;234(3):779–815. | ||
Kabsch W, Sander C. Dictionary of protein secondary structure pattern recognition hydrogen-bonded geometrical lectures. Biopolymers. 1983;22(12):2577–2637. | ||
Lobanow M, Bogatyrev NS, Galzitskaia OV. Radius of gyration is an indicator of compactness of protein structure. Mol Biol (Mosk). 2008;42(4):701–706. | ||
Durham E, Dorr B, Woetzel N, Staritzbichler R, Meiler J. Solvent accessible surface area approximations for rapid and accurate protein structure prediction. J Mol Model. 2009;15(9):1093–1108. | ||
Ishikawa T, Seto M, Banno H, et al. Design and synthesis of novel human epidermal growth factor receptor 2 (HER2)/epidermal growth factor receptor (EGFR) dual inhibitors bearing a pyrrolo [3,2-d] pyrimidine scaffold. J Med Chem. 2011;54(23):8030–8050. |
 © 2016 The Author(s). This work is published and licensed by Dove Medical Press Limited. The full terms of this license are available at https://www.dovepress.com/terms.php and incorporate the Creative Commons Attribution - Non Commercial (unported, v3.0) License.
By accessing the work you hereby accept the Terms. Non-commercial uses of the work are permitted without any further permission from Dove Medical Press Limited, provided the work is properly attributed. For permission for commercial use of this work, please see paragraphs 4.2 and 5 of our Terms.
© 2016 The Author(s). This work is published and licensed by Dove Medical Press Limited. The full terms of this license are available at https://www.dovepress.com/terms.php and incorporate the Creative Commons Attribution - Non Commercial (unported, v3.0) License.
By accessing the work you hereby accept the Terms. Non-commercial uses of the work are permitted without any further permission from Dove Medical Press Limited, provided the work is properly attributed. For permission for commercial use of this work, please see paragraphs 4.2 and 5 of our Terms.