")
Back to Journals » Diabetes, Metabolic Syndrome and Obesity » Volume 8
Development of non-alcoholic fatty liver disease scoring system among adult medical check-up patients: a large cross-sectional and prospective validation study
Authors Lesmana C , Pakasi L, Inggriani S, Aidawati M, Lesmana L
Received 5 January 2015
Accepted for publication 10 March 2015
Published 23 April 2015 Volume 2015:8 Pages 213—218
DOI https://doi.org/10.2147/DMSO.S80364
Checked for plagiarism Yes
Review by Single anonymous peer review
Peer reviewer comments 4
Editor who approved publication: Professor Ming-Hui Zou
Cosmas Rinaldi A Lesmana,1,2 Levina S Pakasi,1 Sri Inggriani,3 Maria L Aidawati,3 Laurentius A Lesmana1
1Digestive Disease and GI Oncology Centre, Medistra Hospital, 2Department of Internal Medicine, Hepatobiliary Division, Cipto Mangunkusumo Hospital, University of Indonesia, 3Radiology Department, Medistra Hospital, Jakarta, Indonesia
Background: Non-alcoholic fatty liver disease (NAFLD) is the most common liver disease in the community. However, NAFLD remains undiagnosed in most people with limited access to imaging facilities in most developing countries.
Objective: To examine the prevalence of NAFLD and to develop the risk scoring model for predicting the presence of NAFLD among adult medical check-up patients.
Method: A large prospective cross-sectional study was conducted among medical check-up patients who underwent transabdominal ultrasound examination between January and December 2013 in Medistra Hospital, Jakarta. Data were obtained from the patients' medical records. Logistic regression analyses were undertaken to identify the best combination of risk factors for predicting fatty liver using the backward (likelihood ratio) approach. The adjusted odds ratio and 95% confidence interval were estimated using the logistic regression coefficient. The prediction model was assessed using the receiver operating characteristic curve and the Hosmer–Lemeshow goodness-of-fit test and was validated on a new, prospective cohort. Statistical analysis was done using SPSS version 17.
Results: A total of 1,054 cases was included in this study. Fatty liver was present in 538 (51.0%) patients. Bivariate analyses found associations among fatty liver and several risk factors. Six risk factors were incorporated to build the final prediction model. All scores were summed up to obtain the total score. A probability equation was developed by applying linear regression analysis on the total score. The prediction model had good diagnostic performance with an area under the receiver operating characteristic curve =0.833 (95% confidence interval =0.809–0.857). The Hosmer–Lemeshow goodness-of-fit P-value was 0.232, which indicated the appropriateness of the logistic regression model to predict fatty liver. On the validation set, the scoring system proved to be moderately accurate and can potentially be applied to larger population setting.
Conclusion: The presence of fatty liver in NAFLD patients can be predicted using our proposed fatty liver scoring system.
Keywords: fatty liver, scoring model, ultrasound, community, developing countries, diagnostic performance
Background
Non-alcoholic fatty liver disease (NAFLD) is a spectrum of liver disease that may progress to liver cirrhosis and hepatocellular carcinoma. In Asia Pacific the prevalence of NAFLD ranges from 5%–30%, and Indonesia is one of the high prevalence countries of NAFLD.1,2 The risk factors of NAFLD in Asian population might be similar with the Western countries because of the food habit and lifestyle changes over the recent years. Theoretically, NAFLD is associated with insulin resistance condition and can represent the hepatic manifestation3 of the metabolic syndrome (MS) which comprises obesity, dyslipidemia, hypertension, and glucose intolerance.4,5
Most NAFLD patients are asymptomatic and might be diagnosed incidentally during imaging study. The use of liver parameters such as AST or ALT is not always reliable. However, NAFLD could also be suspected in patients with the presence of MS. Studies in the United States revealed good associations between metabolic parameters and the presence of NAFLD.6,7
Transabdominal ultrasonography is a simple, widely available, and acceptable tool for first-line screening for the presence of fatty liver in clinical practice. It has high diagnostic accuracy for the diagnosis of fatty liver.8,9 However, transabdominal ultrasound is not routinely done for medical check-up (MCU) in most primary health care centers or peripheral hospitals. Therefore, it is tempting to know whether the presence of fatty liver can be predicted with all metabolic risk factors.
The aim of this study was to know the prevalence of fatty liver among MCU patients and to develop a scoring system to predict the presence of fatty liver.
Method
Study design and subjects
The study design was a prospective analytical cross-sectional study among MCU patients in Medistra Hospital between January and December 2013. These subjects mostly include employees of private companies in Jakarta or middle-class income people who would like a comprehensive MCU, which includes transabdominal ultrasound and blood chemistry testing for major cardiovascular risk factors. Medistra Hospital is one of the top private hospitals in Jakarta which shares the same patient economic profiles with other private hospitals.
The minimum sample size for estimating one population proportion at an anticipated proportion of 50%, 99% level of confidence, and 5% confidence interval (CI) was 664 subjects.
The study protocol was approved by the Internal Review Board of the hospital. Inclusion criteria were adult patient aged more than 18 years, having routine laboratory check-up including liver function test, fasting blood glucose (FBG) levels, lipid profile, alcohol consumption less than 20 g/day, and underwent transabdominal ultrasound assessment. Patients were excluded from analyses if laboratory data were incomplete based on medical records. Predictors of NAFLD tested were sex, age, smoking history, history of hypertension, history of diabetes, body mass index (BMI), systolic and diastolic blood pressures, FBG, triglycerides, total cholesterol, low-density lipoprotein-cholesterol, high-density lipoprotein (HDL)-cholesterol, serum AST, and ALT levels.
Diagnosis of fatty liver
Fatty liver was diagnosed by transabdominal ultrasound. Ultrasound assessment was performed by two senior radiologists in Medistra Hospital. Ultrasound was done using a 3.5 MHz convex-array transducer (LOGIC S6 and LOGIC 7, GE Health Care). Both radiologists who performed the ultrasound evaluation were blinded to the laboratory data. The diagnosis of NAFLD was established if the ultrasonogram showed increased echogenicity when compared to the renal parenchyma.9 Grading of liver steatosis was done semi-quantitatively as: mild (minimal diffuse increase in hepatic echogenicity, normal visualization of diaphragm and intrahepatic vessel borders), moderate (moderate diffuse increase in hepatic echogenicity, slightly impaired visualization of intrahepatic vessels and diaphragm), and severe (marked increase in echogenicity; poor penetration of the posterior segment of the right lobe of the liver and poor or non-visualization of the hepatic vessels and diaphragm).10 For statistical analyses, the ultrasound appearance of the liver was grouped into “fatty liver” and “no fatty liver”.
Data management and statistical analyses
Data were obtained by retrieving the medical records of the full 1-year entries of MCU patients. These data include comprehensive interview of the patients’ medical history, physical examination, laboratory data, and abdominal ultrasound results.
Logistic regression analyses were undertaken to identify the best combination of risk factors for predicting fatty liver using the backward (likelihood ratio) approach. The adjusted odds ratio and 95% CI were estimated using the logistic regression coefficient. The diagnostic performance of prediction model was evaluated using the receiver operating characteristic curve with 95% CI, whereas the goodness-of-fit of the model was assessed by the Hosmer–Lemeshow statistics and pseudo-R-squares (Cox and Snell R-square and Nagelkerke R-square). Statistical analysis was done using SPSS version 17.0.
Validation study
The new fatty liver prediction model was also tested using a prospective data set from MCU patients between July and December 2014. Clinical and laboratory data were recorded and scored accordingly. Diagnostic performance test was applied on the total score results.
Result
Characteristics of the study subjects
A total of 1,057 patients were recorded during the study period; three of them did not provide complete laboratory data leaving a final number of 1,054 cases for statistical analyses. Fatty liver was present in 538 (51.0%) patients, most of them were mild. There were 13 (1.2%) who already had a chronic parenchymal liver disease based on ultrasound imaging (Table 1).
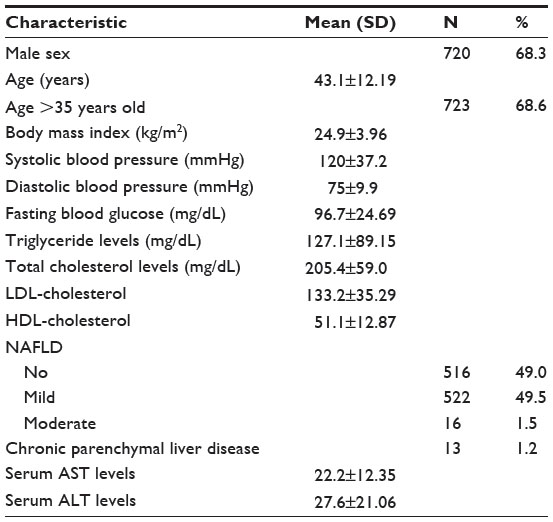 | Table 1 Characteristics of the study subject (N=1,054) |
Bivariate and multivariate analyses
Bivariate analyses found associations among NAFLD and several predictors, ie, male sex, age >35 years, BMI >25 kg/m2, FBG >100 mg/dL, systolic blood pressure ≥130 mmHg, diastolic blood pressure ≥85 mmHg, triglyceride levels ≥150 mg/dL, total cholesterol ≥200 mg/dL; HDL-cholesterol ≤40 (for men) or ≤50 mg/dL (for women), and serum aminotransferase levels ≥35 U/L. All variables showed significant association with the presence of NAFLD (Table 2) and were entered into subsequent multivariate analysis. The resulting independent predictors for NAFLD were male sex, age >35 years, BMI ≥25 kg/m2, triglyceride levels ≥150 mg/dL; HDL-cholesterol <40 mg/dL (for men) or <50 mg/dL (for women), and serum ALT levels ≥35 U/L (Table 3).
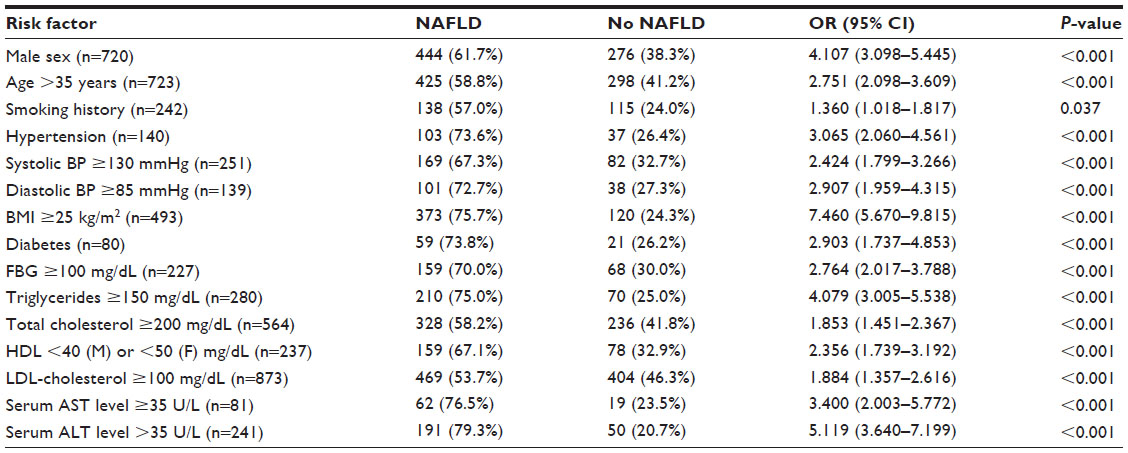 | Table 2 Associations among risk factors and the presence of fatty liver (N=1,054) |
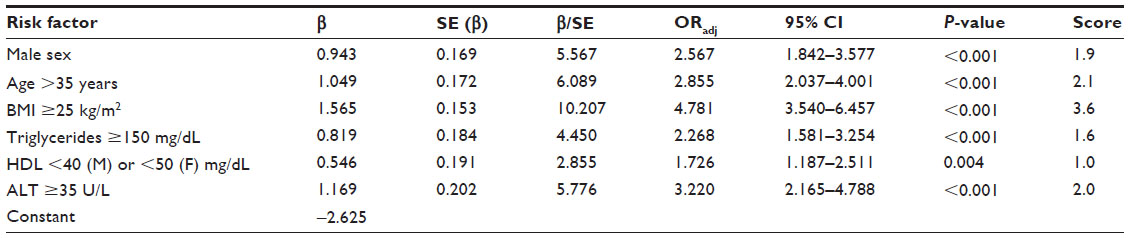 | Table 3 Independent risk factors to predict fatty liver (N=1,054) |
Development of fatty liver index
Variables for fatty liver index development were chosen from independent predictors which have adjusted odds ratio more than 1.5 on multivariate analyses. Scoring was calculated by first dividing each of β value to its standard error which resulted in standardized β (β/standard error) values. The lowest value of standardized β was then marked and divided by itself to yield a score of 1.0. Other standardized β values were then divided to that lowest values and resulted as score for each variable. Each score was rounded to one decimal digit (Table 3).
There were six predictors included in the scoring system, ie, sex, age, BMI, triglyceride level, HDL-cholesterol level, and serum ALT level (Table 3). To simplify the probability calculation, all scores were summed up to yield a total score. The linear regression equation was:

(Table 4), and probability of having fatty liver can be calculated as follows:
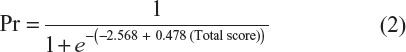
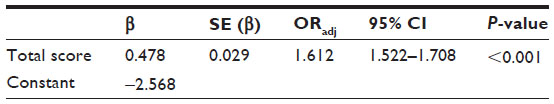 | Table 4 Linear regression model of the total score to predict fatty liver |
Diagnostic accuracy of the equation showed that the area under the receiver operating characteristic curve of the prediction model was 0.833 (95% CI =0.809–0.857; P<0.001) (Figure 1). The Hosmer–Lemeshow goodness-of-fit P-value was 0.232, which indicated the appropriateness of the logistic regression model to predict fatty liver. However, the extent of this model to predict fatty liver in the study population was moderate (Cox and Snell R-square =0.317; Nagelkerke R-square =0.422). Diagnostic performance of the prediction model was good (Table 5).
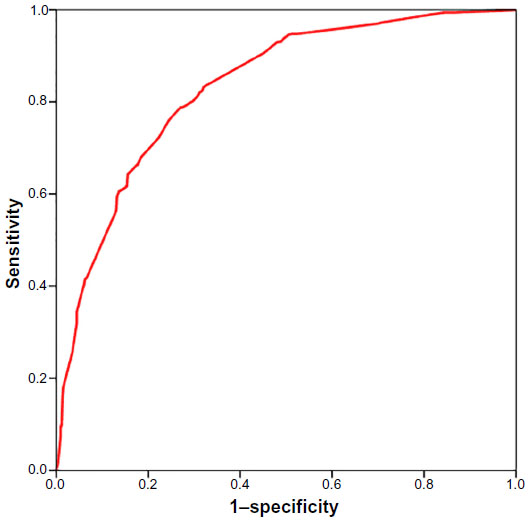 | Figure 1 ROC curve of predicted total score for fatty liver (AUC =0.833; 95% CI: 0.809–0.857; P<0.001). |
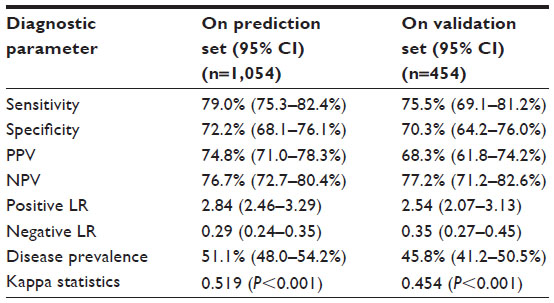 | Table 5 Diagnostic performance of total score for fatty liver at a cutoff of 5.0 |
Validation study
There were 454 patients (258 men and 196 women) enrolled in this validation phase. Fatty liver was diagnosed in 208 (45.8%) of them. By using our prediction model, the AUC to detect fatty liver was 0.822 (95% CI: 0.784–0.860; P<0.001). Diagnostic performance was comparable with the prediction set with moderate sensitivity and specificity (Table 5).
Discussion
To our knowledge, this is the first study in Indonesia to develop a scoring system to predict NAFLD in adults. Large sample size on the prediction set is a strength of this study which was further validated on a new, prospective cohort. Subjects enrolled in this study were mostly healthy clients from private companies who were looking for cardiovascular risk profiles and may represent the middle-class income people in a metropolitan city of Jakarta. This particular population could be assumed to have modern lifestyle similar with other urban communities in well-developed cities.
Increasing age and male sex have been associated with increased risk of NAFLD;11 therefore, it is not surprising to have these factors incorporated as the first two variables in our scoring system. Obesity seemed to have the strongest association with NAFLD compared to other MS components. The hepatic insulin clearance might be suppressed by excessive fat accumulation and will lead to hyperinsulinemia or hypoglycemia.12 This effect is independent of obesity; the excessive fat in the liver might not be related to the increased body mass and central obesity since it can also be found in normal weight and moderately overweight subjects.13 Hypertriglyceridemia and low HDL-cholesterol levels are also commonly found in patients with NAFLD with an estimated prevalence of 50%.14
It has been demonstrated by several studies that higher risk of metabolic disorders is found in patients with NAFLD than in those without it.15,16 However, since data on metabolic disorders and NAFLD were collected and analyzed cross-sectionally, the causal association between metabolic disorders and NAFLD is unclear. Moreover, although there was a significant association between diabetes and NAFLD,17 neither a history of diabetes nor high FBG served as an independent risk factor for NAFLD on multivariate analyses suggesting that diabetes is a confounding factor. This could imply that diabetes share the same risk profile with fatty liver but not necessarily be a risk factor if present alone.
Elevated ALT activity levels is commonly associated with NASH, although normal ALT does not rule out significant liver disease in NAFLD patients.18 Furthermore, the upper normal limit (ULN) of ALT has been recently evaluated.19 It has been suggested to lower the ULN, especially in women, but regardless of the cutoff, investigators found that the prevalence of NAFLD and NASH in normal ALT patients was similar.20 For simplicity, we do not distinguish the ULN for men and women in our study.
When applying our prediction model to the new validation set, there is slight reduction in diagnostic performance of the scoring system. This could be due to the small number of subjects enrolled and slightly lower disease prevalence in the validation set. Overall, the scoring system is moderately accurate in detecting NAFLD and is potentially applicable in large, population-based screening. Screening of fatty liver in adult population visiting primary care clinics has not been advised due to lack of clinical importance and limited treatment choices.21 In addition, screening with liver biochemistry tests may not be sufficiently sensitive, whereas liver ultrasound imaging may not be practical.21 However, with our scoring system, any person who underwent routine basic cardiovascular check-up could benefit from knowing his/her chance of having fatty liver without the need to ask for imaging studies. The scoring system produced by this study include simple clinical factors that could be assessed anywhere in the primary health care institution, ie, age, sex, BMI, triglycerides, HDL-cholesterol, and ALT levels. By using this scoring system, most clinicians or any health care providers will be able to do the screening in a large population. Although benefit of screening may not be clearly seen at the moment due to uncertainties of the true liver condition (whether it is a simple steatosis or a NASH); in our opinion, individuals with higher fatty liver scores calculated by our scoring system should be advised regarding more healthy living habits such as calorie restriction and exercise.
There are limitations that should be considered based on this study. Firstly, diagnosis of NAFLD was made by ultrasound. Considering the technique used for liver imaging, computed tomography and magnetic resonance imaging are actually more accurate to detect NAFLD than ultrasound.22,23 However, both computed tomography and magnetic resonance imaging are more expensive, more time consuming, and cannot be used as part of routine MCU. Secondly, there was no histopathological assessment to confirm the diagnosis of fatty liver, as ultrasound imaging can only detect steatosis if there is more than 33% fat content in the liver.24 Consequently, fatty liver may still be present in patients with negative results on ultrasound imaging. However, ultrasound is still a recommended technique for use in a large population for screening of fatty liver because it is relatively low-cost, non-invasive, and widely available. A meta-analysis has supported the use of ultrasound for NALFD diagnosis because it has good sensitivity (84.8%) and specificity (93.6%).8 In addition, liver biopsy is an invasive procedure which cannot be done on routine MCU or screening programs.
Conclusion
The prevalence of NAFLD among MCU patients in our hospital is high (51%). The screening program using our simple model score might be very useful in daily practice especially in primary health care centers. On the validation set, the scoring system was proved to be moderately accurate and can potentially be applied to larger population setting.
Compliance with ethical requirements
All procedures followed in this study were in accordance with the ethical standards of the responsible committee on human experimentation (institutional and national) and with the Helsinki Declaration of 1975, as revised in 2008.
Disclosure
The authors have no conflicts of interest to disclose.
References
Amarapurkar D, Hashimoto E, Lesmana LA, et al. How common is non-alcoholic fatty liver disease in the Asia-Pacific region and are there local differences? J Gastroenterol. 2007;22(6):788–793. | |
Fan JG, Saibara T, Chitturi S, et al. What are the risk factors and settings for non-alcoholic fatty liver disease in Asia-Pacific? J Gastroenterol Hepatol. 2007;22(6):794–800. | |
Tarantino G, Finelli C. What about non-alcoholic fatty liver disease as a new criterion to define metabolic syndrome? World J Gastroenterol. 2013;19(22):3375–3384. | |
Ratziu V, Bellentani S, Cortez-Pinto H, Day C, Marchesini G. A position statement on NAFLD/NASH based on the EASL 2009 special conference. J Hepatol. 2010;53(2):372–384. | |
Bedogni G, Miglioli L, Masutti F, Tiribelli C, Marchesini G, Bellentani S. Prevalence of and risk factors for nonalcoholic fatty liver disease: the Dionysos nutrition and liver study. Hepatology. 2005;42(1):44–52. | |
Paschos P, Patelas K. Non alcoholic fatty liver disease and metabolic syndrome. Hippokratia. 2009;13(1):9–19. | |
Cheung CL, Lam KS, Wong CK, Cheun BM. Non-invasive score identifies ultrasonography diagnosed non-alcoholic fatty liver disease and predicts mortality in the USA. BMC Med. 2014;12:154. | |
Hernaez R, Lazo M, Bonekamp S, et al. Diagnostic accuracy and reliability of ultrasonography for the detection of fatty liver: a meta-analysis. Hepatology. 2011;54(3):1082–1090. | |
Bates JA. Abdominal Ultrasound: How, Why, and When. Edinburgh: Churcill Livingstone; 2001:85–86. | |
Wilson SR, Withers CE. The Liver. In: Rumack CM, Wilson SR, Charboneau JW, Johnson JA, editors. Diagnostic Ultrasound. Philadelphia: Elsevier-Mosby; 2005:95–97. | |
Vernon G, Baranova A, Younossi ZM. Systematic review: the epidemiology and natural history of non-alcoholic fatty liver disease and non-alcoholic steatohepatitis in adults. Aliment Pharmacol Ther. 2011; 34(3):274–285. | |
Seppälä-Lindroos A, Vehkavaara S, Häkkinen AM, et al. Fat accumulation in the liver is associated with defects in insulin suppression of glucose production and serum free fatty acids independent of obesity in normal men. J Clin Endocrinol Metab. 2002;87(7):3023–3028. | |
Kotronen A, Westerbacka J, Bergholm R, Pietiläinen KH, Yki-Järvinen H. Liver fat in the metabolic syndrome. J Clin Endocrinol Metab. 2007;92(9):3490–3497. | |
Assy N, Kaita K, Mymin D, Levy C, Rosser B, Minuk G. Fatty infiltration of liver in hyperlipidemic patients. Dig Dis Sci. 2000;45(10):1929–1934. | |
Chang TY, Chen JD. Fatty liver and metabolic syndrome in nonabdominally obese Taiwanese adults. Asia Pac J Public Health. 2012;24(3):472–479. | |
Onyekwere CA, Ogbera AO, Balogun BO. Non-alcoholic fatty liver disease and the metabolic syndrome in an urban hospital serving an African community. Ann Hepatol. 2011;10(2):119–124. | |
Leite NC, Salles GF, Araujo AL, Villela-Nogueira CA, Cardoso CR. Prevalence and associated factors of non-alcoholic fatty liver disease in patients with type-2 diabetes mellitus. Liver Int. 2009;29(1):113–119. | |
Amarapurkar DN, Patel ND. Clinical spectrum and natural history of nonalcoholic steatohepatitis with normal alanine aminotransferase values. Trop Gastroenterol. 2004;25(3):130–134. | |
Kariv R, Leshno M, Beth-Or A, et al. Re-evaluation of serum alanine aminotransferase upper normal limit and its modulating factors in a large-scale population study. Liver Int. 2006;26(4):445–450. | |
Kunde SS, Lazenby AJ, Clements RH, Abrams GA. Spectrum of NAFLD and diagnostic implications of the proposed new normal range for serum ALT in obese women. Hepatology. 2005;42(3):650–656. | |
Chalasani N, Younossi Z, Lavine JE, et al. The diagnosis and management of non-alcoholic fatty liver disease: practice guideline by the American Association for the Study of Liver Diseases, American College of Gastroenterology, and the American Gastroenterological Association. Am J Gastroenterol. 2012;107(6):811–826. | |
Jain KA, McGahan JP. Spectrum of CT and sonographic appearance of fatty infiltration of the liver. Clin Imaging. 1993;17(2):162–168. | |
Fishbein M, Castro F, Cheruku S, et al. Hepatic MRI for fat quantitation: its relationship to fat morphology, diagnosis, and ultrasound. J Clin Gastroenterol. 2005;39(7):619–625. | |
Saadeh S, Younossi ZM, Remer EM, et al. The utility of radiological imaging in nonalcoholic fatty liver disease. Gastroenterology. 2002;123(3):745–750. |
 © 2015 The Author(s). This work is published and licensed by Dove Medical Press Limited. The full terms of this license are available at https://www.dovepress.com/terms.php and incorporate the Creative Commons Attribution - Non Commercial (unported, v3.0) License.
By accessing the work you hereby accept the Terms. Non-commercial uses of the work are permitted without any further permission from Dove Medical Press Limited, provided the work is properly attributed. For permission for commercial use of this work, please see paragraphs 4.2 and 5 of our Terms.
© 2015 The Author(s). This work is published and licensed by Dove Medical Press Limited. The full terms of this license are available at https://www.dovepress.com/terms.php and incorporate the Creative Commons Attribution - Non Commercial (unported, v3.0) License.
By accessing the work you hereby accept the Terms. Non-commercial uses of the work are permitted without any further permission from Dove Medical Press Limited, provided the work is properly attributed. For permission for commercial use of this work, please see paragraphs 4.2 and 5 of our Terms.