")
Back to Journals » Patient Preference and Adherence » Volume 9
Development of an unsupportive social interaction scale for patients with diabetes
Authors Baron-Epel O, Heymann AD, Friedman N, Kaplan G
Received 23 February 2015
Accepted for publication 12 May 2015
Published 23 July 2015 Volume 2015:9 Pages 1033—1041
DOI https://doi.org/10.2147/PPA.S83403
Checked for plagiarism Yes
Review by Single anonymous peer review
Peer reviewer comments 2
Editor who approved publication: Dr Johnny Chen
Orna Baron-Epel,1 Anthony David Heymann,2,3 Nurit Friedman,3 Giora Kaplan4
1School of Public Health, Faculty of Social Welfare and Health Sciences, University of Haifa, Haifa, Israel; 2Department of Family Medicine, Tel Aviv University, Tel Aviv, Israel; 3Maccabi Healthcare Services, Tel Aviv, 4Psychosocial Aspects of Health, The Gertner Institute for Epidemiology and Health Policy Research, Sheba Medical Center, Ramat Gan, Israel
Objectives: The positive aspects of social support and its impact on health have been studied extensively. However, there may also be negative effects of social environments on the diabetic patient. This study developed and validated a new diabetic unsupportive social interaction scale (USIS), including two subscales: interference and insensitivity.
Methods: A list of 22 items depicting unsupportive interactions associated with management of diabetes was developed. A telephone survey was administered to 764 Israelis with diabetes. The questionnaire included the USIS and questions about social networks, social support, health behaviors, and health. The characteristics, validity, and reliability of the scale were tested.
Results: A principal component analysis was performed for extraction of two factors describing unsupportive social interaction concepts: interference and insensitivity. Cronbach’s alpha for the full 15-item scale was 0.84, indicating internal consistency. The two subscales were calculated to have Cronbach’s alphas of 0.85 and 0.73, respectively. The USIS showed construct validity as it was associated with social support, some measures of social networks, subjective measures of health, and health behaviors. Arabs, older respondents, those defining themselves as more religious, and the less educated reported higher rates of unsupportive interactions.
Conclusion: This study suggests a new concept of unsupportive interactions including interference and insensitivity. These unsupportive interactions may adversely affect patients’ ability to adhere to treatment and may undermine their health in various ways. Identifying these problems may enable clinicians to help patients cope with their unsupportive environments.
Keywords: development of scale, unsupportive social interactions, interference, insensitivity, social support, validity
Introduction
The long-term complications of diabetes present a formidable threat to health, and incur high costs for the health care services and society.1 Therefore, there is a need for comprehensive management of glycemia and other risk factors and comorbidities, and a large range of effective therapies are available.2 However, there is evidence that only slightly more than half of the patients achieve the glycated hemoglobin target of less than 7.0%.3,4 Adherence to treatment seems to be a problem5 and a wide range of adherence rates have been reported.6 Although a vast array of significant adherence predictors have been identified, the ability to explain or predict nonadherence to known risk factors remains poor and further understanding of this is needed.7
Social support has been suggested to impact adherence. Satisfaction with support is a predictor, for example, of improved diabetes-specific quality of life and blood glucose monitoring.8,9 However, nonsupportive behaviors seem to predict poor adherence with recommended medications.9 In a study of 46 individuals with diabetes, it was suggested that negative social support may interfere with effective diabetes management.10
Social support and its impact on health have been extensively studied over the last 30 years;11,12 most often the beneficial effects of social support are emphasized. The concept of social support includes a large range of variables describing social relations between individuals. These can be divided into the structural aspects of the networks in which people live and the quality of the relationships. Social support can also be divided into categories of support such as functional, emotional, and technical support.13 However, social support is not always a positive influence on the individual and his/her health. Large social networks can also bring with them many obligations, stress, and negative experiences.14,15 Kawachi and Berkman16 suggested that extensive social ties can increase mental illness in women with low resources, especially when the social ties bring with them obligations to provide social support to others. Other people in the individual’s social environment can be a source of negative emotions, be insensitive to needs, and interfere in the life of the individual. For example, high-density networks among First Nation and Inuit communities in Canada were suggested to exert conformity pressures and social obligations that promoted health-damaging behaviors.17 In certain circumstances these aspects of social networks may lead to a negative impact on health, especially among diabetics since they may lead to decreased effective diabetes management.
Brooks and Dunkel Schetter reviewed the literature on these negative aspects of social networks and health. They termed them “social negativity” and proposed a multidimensional construct composed of three distinguishable but overlapping aspects. The dimensions include: conflict, insensitivity, and interference.18 They define conflict as “behaviors which provoke conflict”, insensitivity as “behaviors which convey disregard…” and interference as “behaviors which interfere with an individual’s ability to pursue goals”.
In this study, we conceptualize unsupportive social interactions as social obligations and social interactions that the social networks demand of the individuals, in this case patients with diabetes. These can hamper adoption of a lifestyle needed for diabetes management. This concept does not imply that the individual does not have beneficial social support or high quality social support, just that certain interactions in the network may hinder positive behaviors.
This study describes the development and initial psychometric properties of a 15-item unsupportive social interaction scale (USIS), identifying two subscales: interference and insensitivity. We assessed the association between the USIS, socioeconomic variables, health behaviors, subjective health, and social support.
Methods
The study was conducted in two phases and was approved by the University of Haifa’s Ethical Review Board and Maccabi Healthcare Services (MHS) Ethical Review Board.
Phase I: scale development
Conceptual model
Four qualitative interviews with two Arab and two Jewish patients with diabetes (two men and two women) were performed. The interviewees talked about how social life, including family and friends, served as barriers to adherence with diabetes management. For example, attending weddings and other family gatherings was a major challenge in adhering to a healthy diet and physically active lifestyle. These themes guided the formulation of items 1–8 and 10, 11, and 13 in Table 1. Reviewing the literature14,19 suggested some additional items depicting social burden and social strain.
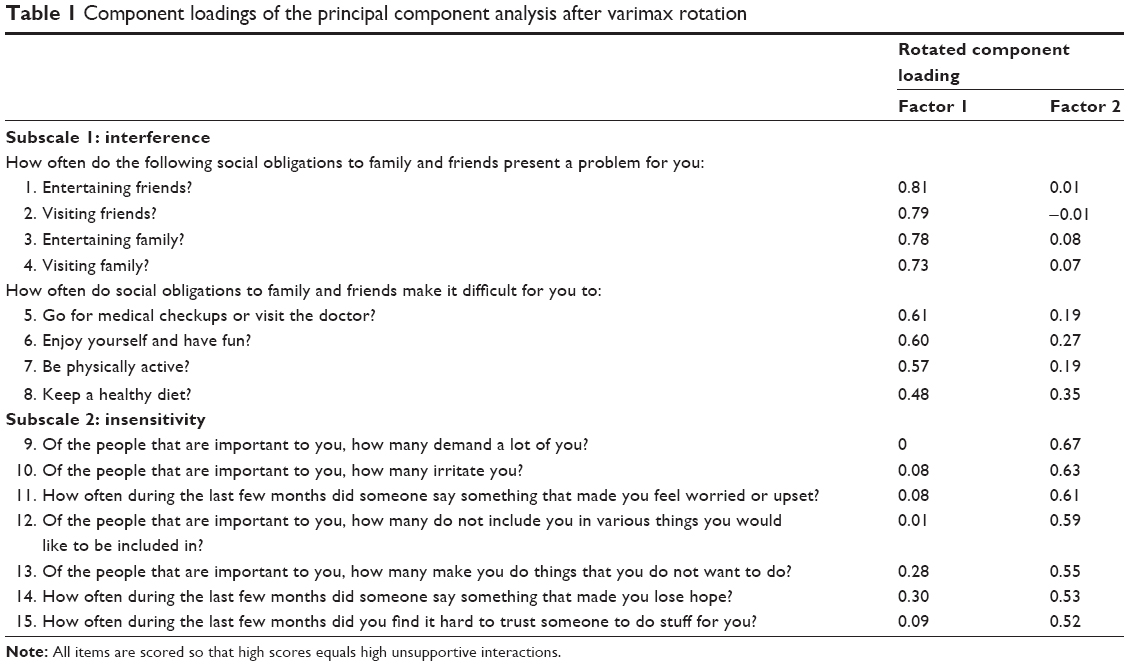 | Table 1 Component loadings of the principal component analysis after varimax rotation |
We defined unsupportive social interactions as “social interactions that intervene with health enhancing behaviors and decrease the ability of the individual to promote his/her health”.
Item generation and selection
Items were developed from information collected from qualitative interviews and the literature review. The initial items were reviewed by four experts familiar with social and cultural issues involved in diabetes management. The first list of items consisted of 22 items; these were pretested with 30 subjects with type 2 diabetes to determine appropriateness and relevance of the items. Two of the items were deleted as they were correlated with the other items and their deletion did not change the Cronbach’s alpha. It was important to shorten the questionnaire, therefore they were not included in the final questionnaire tested and analyzed in this study.
Items were scored on a five-point scale from 1 (never or no one) to 5 (always or everyone). The higher the score the greater the unsupportive social interactions. A summary score consisting of the mean of the individual items was created.
Phase II: evaluation of instrument
MHS is a large health maintenance organization that insures almost 25% of the Israeli population. Two random samples from the MHS diabetic registrar were extracted, one for Jews and one for Arabs. The diabetes registrar is described elsewhere and includes information regarding patients diagnosed with mainly, but not only, type 2 diabetes.4,20 Telephone interviews were conducted in Hebrew, Russian, and Arabic by trained interviewers from these communities speaking the corresponding languages. The questionnaires were translated into Russian and Arabic and back translated into Hebrew to verify that the meaning of the questions was identical in all the languages. The USIS at this stage included 20 items. The sample included 2,000 diabetics; of them, 181 could not be interviewed (wrong number, hospitalized, abroad, or passed away) and were deleted from the sample, and 1,055 would not participate, stopped the interview in the middle, or could not be reached after six attempts to get them on the phone. A total of 764 questionnaires were analyzed. The response rate was 42%.
Study variables
Demographic variables
Age was assessed as a continuous variable by asking the respondents to report their age. The respondents were asked to self-define their ethnicity as Arab or Jewish, and those immigrating to Israel after 1990 from the former Soviet Union were defined as fSU immigrants. In addition, respondents reported their level of religiosity on a three-level scale and employment status (being employed versus not being employed). Education was assessed by reporting if the respondent had finished high school with a diploma and had higher education, or had 12 years of schooling or less. Income was assessed by asking respondents to report their income compared to the average net income (12,000 NIS) in Israel on a three-level scale: lower than average, average, and higher than average. Respondents were also asked if they were single or lived with a partner.
Social support and social network variables
Social support was measured with six items,21 four depicting emotional support, for example, “to what extent do you have someone to talk to openly about yourself?”, and two depicting functional support, for example, “to what extent do you have someone to take you to the doctor if need be?” A Likert scale was available with five levels, from 1 (not at all) to 5 (very much). Higher scores represented higher social support. Cronbach’s alpha was 0.84. A mean score was calculated for each respondent.
Four social network variables measured the frequency respondents reported for meeting friends and family, talking on the phone, and entertaining. Eight levels of responses were available, from “every day or nearly every day” (1) to “not at all” (8). If the respondent had no family, he could give a “not relevant” answer; however, only around ten respondents said they had no family to visit or that could visit them. Higher scores represented lower frequency of social networks.
Health measures and health behaviors
Respondents were asked to report how they evaluate their health in general on a scale from 1 to 5, where 5 presented poor health. In addition, they were asked at what frequency do they feel physically bad, from never (1) to always (5), and if they are satisfied with their diabetes management, from very satisfied (1) to very unsatisfied (5).
Respondents were also asked if the doctor had ever told them they had complications from diabetes (yes/no answer) and did they faint or feel they were going to faint during the last year (yes/no answer). Respondents were asked if they currently smoke and if they regularly perform physical activity for at least 30 minutes three times a week.
Statistical analysis
Analyses were performed with SPSS V21 and SAS 9.3. Data-reduction techniques were employed to construct a parsimonious USIS. An exploratory factor analysis (principal component analysis with varimax rotation) was used to calculate the variance of the factor loadings and identify subscales. We used the Kaiser–Guttman criterion (eigenvalues >2.0) to decide that two factors were adequate. The first factor had an eigenvalue of 5.47 and the second factor had an eigenvalue of 2.11. In the exploratory factor analysis, five factors had eigenvalues above 1.0; however, items from the third and fourth factors were also included in the first factor and items from the fifth factor were included in the second factor.
Items were retained if they loaded on one factor with a factor loading of at least 0.5. The item “keep a healthy diet” had a loading factor of 0.48; however, due to the importance of diet in the management of diabetes we decided to include it in the subscale. Therefore, five items were not selected for the final scales. The two final factors included eight items in the first factor, matching a theoretical subscale termed “interference”, and seven items in the second factor, matching a theoretical subscale termed “insensitivity”.
Item means and standard deviations, corrected item-total correlations, and Cronbach’s alpha without the item were calculated to assess the internal consistency of the scale.
t-test, analysis of variance, and Pearson’s correlation were used to examine the relationship between the USIS and demographic variables. Spearman’s correlations were used to examine the associations between the USIS, social support, and social network measures.
Results
The sample included 764 diabetic patients, 52% of them male, 38% were long-term Jewish residents (LTJR), 43% Arabs, and 19% fSU immigrants; 62% had a high-school education or more and 59% had an income below the average Israeli income. Most of the respondents were married (80%) and 40% were employed. The mean age was 61.3 years (standard deviation 11.6).
Exploratory factor analysis
The principal component analysis was performed for extraction of the two theoretical factors describing the unsupportive social interactions concept. The two factors accounted for 37.9% of the variance (Table 1). Fifteen of the 20 items tested were consistent with the rotated factor loadings of two factors, with loadings that ranged from 0.48 to 0.81. The two factors were consistent with the theoretical conceptual model. Factor 1 consisted of eight items that measured interference in activities that promote health and good management of diabetes. Factor 2 consisted of seven items that describe insensitivity to the needs of the patient with diabetes from people in the near social environment of the interviewee. Another five items did not load highly onto the two factors, and did not form a clear theoretical additional factor, and therefore were not included in the final USIS presented.
Internal consistency and reliability
An item analysis of the 15 items depicting the USIS revealed a Cronbach’s alpha of 0.840 (Table 2). Item analysis for each of the two subscales revealed Cronbach’s alphas of 0.853 for the interference subscale and 0.732 for the insensitivity subscale. Item, scale, and subscale means and standard deviations are presented in Table 2. Corrected item-total correlations of the 15-item scale ranged from 0.38 to 0.67 and the item analysis showed that alpha would not be meaningfully improved by dropping any one item from the scale. Pearson’s correlation coefficient between the two subscales was 0.37 (P<0.0001) .
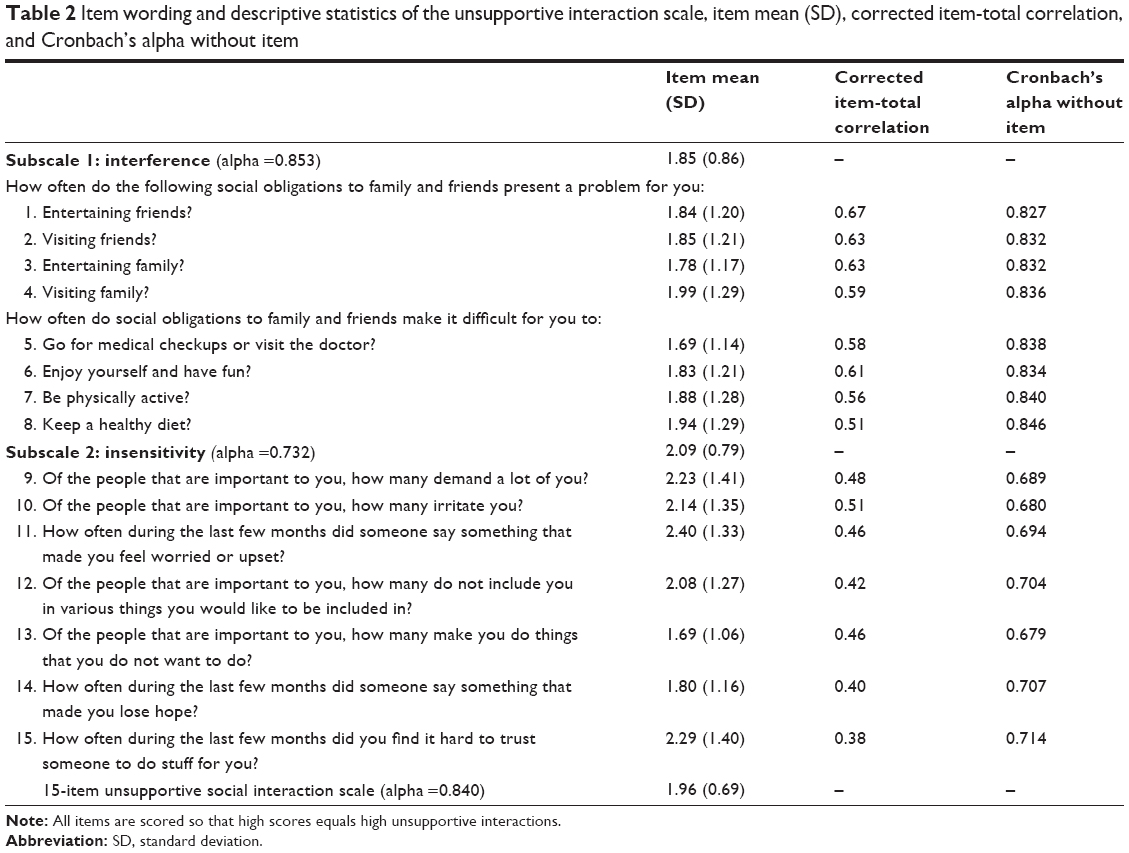 | Table 2 Item wording and descriptive statistics of the unsupportive interaction scale, item mean (SD), corrected item-total correlation, and Cronbach’s alpha without item |
Relationship of the USIS with demographic characteristics and health measures
Age was negatively correlated with the full USIS (rp=−0.25, P<0.0001), as well as with both subscales of unsupportive social interactions, interference (rp=−0.12, P=0.001) and insensitivity (rp=−0.31, P<0.0001). Younger respondents reported higher levels of unsupportive social interactions.
Table 3 presents the association between demographic characteristics, the USIS, and the subscales.
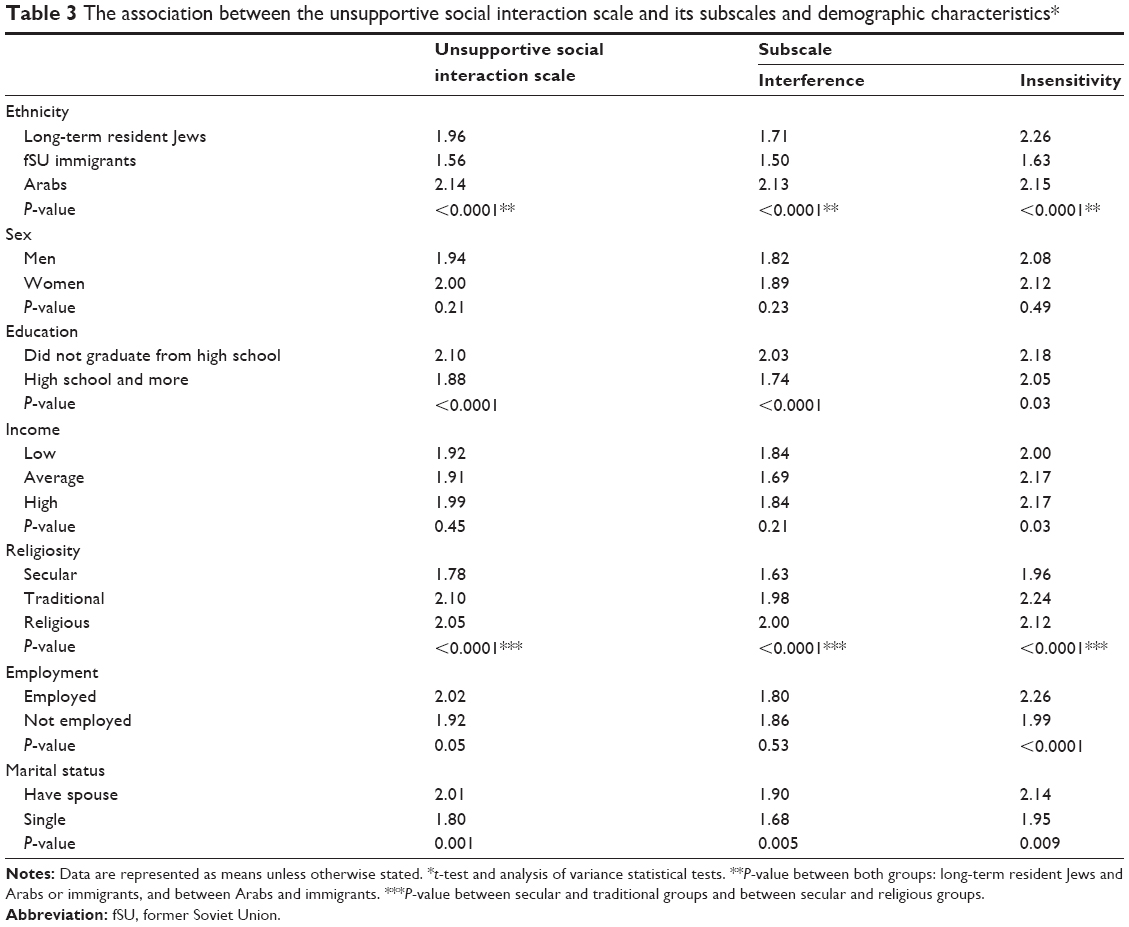 | Table 3 The association between the unsupportive social interaction scale and its subscales and demographic characteristics* |
Arab respondents reported the highest level of unsupportive social interactions as measured by USIS (2.14 among Arabs and 1.56 among immigrants, P<0.0001). However, for the insensitivity subscale, the Arabs had lower levels than the LTJR (2.15 among Arabs and 2.26 among LTJR, P<0.0001). Immigrants reported the lowest levels of unsupportive social interactions. Respondents that did not finish high school reported higher rates of unsupportive social interactions.
Secular respondents reported significantly less unsupportive social interaction compared to traditional and religious respondents. There was no significant difference between traditional and religious respondents. Employment was significantly associated only with the insensitivity subscale, where those employed reported more unsupportive social interactions. Single respondents, not living with a spouse, reported significantly lower levels of unsupportive social interactions compared to those living with a spouse.
Sex was not associated with the USIS and income was not associated only with the insensitivity subscale, where the lower-income respondents report lower levels of unsupportive social interaction (1.99 compared to 2.16, P=0.02).
Table 4 presents the mean level of the USIS by other variables describing health and health behaviors. Unsupportive interactions are significantly higher among those with at least one health complication and those reporting fainting or nearly fainting during the last year. This is true for both subscales. Smoking and not performing physical activity as recommended are also associated with unsupportive interactions; however, the insensitivity subscale was not associated with physical activity.
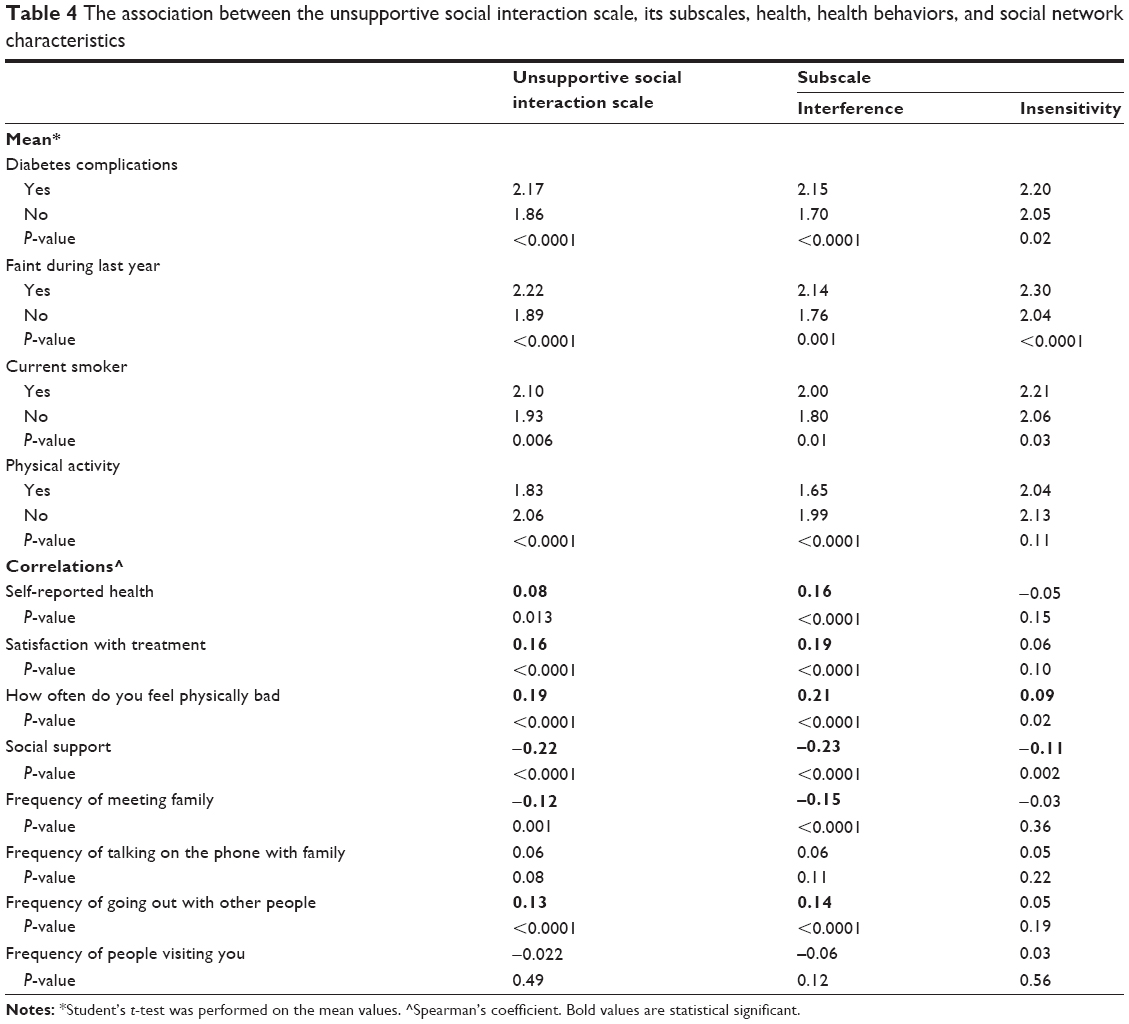 | Table 4 The association between the unsupportive social interaction scale, its subscales, health, health behaviors, and social network characteristics |
In addition, Table 4 presents the association between some self-reported health measures and unsupportive social interactions. The worse the respondent evaluates his/her health, the higher is the score of the USIS. It seems that the interference subscale is the dominant scale, and the insensitivity scale seems to be associated only very weakly with feeling physically bad.
Relationship with social networks characteristics
Table 4 also presents the Spearman’s correlation coefficients between the USIS and its subscales and social support and various measures of social networks. Unsupportive social interactions were correlated negatively with social support (r=−0.22, P<0.0001) and the correlation coefficient of the interference subscale was larger than the insensitivity subscale (r=−0.23 and −0.11, respectively). Respondents with higher levels of social support had lower levels of unsupportive social interactions.
Only two of the measures of social networks were associated with the USIS and the interference subscale: frequency of meeting family and frequency of going out with people. The frequency of meeting family was negatively related to unsupportive social interaction: the more the respondent meets with family the more unsupportive social interactions were reported. Going out with people seemed to be positively related to unsupportive social interactions: the more the respondent goes out, the lower are the unsupportive social interaction. The insensitivity subscale was not related to any of the social networks measures.
Discussion
In this study, we developed a scale to measure unsupportive social interactions: the USIS. The tool was tested among patients with diabetes. Patients with diabetes are expected to manage their care and adopt long-term maintenance of health behaviors, such as physical activity, diet and nutrition, adherence with medication recommendations, and regular medical checkups. Social interactions may hamper such behaviors.
The 15-item scale developed is consistent with the conceptual model of two subscales: interference and insensitivity.18 The reliability of the USIS is supported by the high internal consistency of the scale (alpha =0.84) and the subscales for interference and insensitivity (alpha =0.85 and 0.73, respectively), and the fact that the scale’s Cronbach’s alpha could not be improved by eliminating any of the items. We based our development of the scale’s items on qualitative interviews with patients with diabetes and found that the two factors identified correlated with two of the factors included in the concept of “social negativity”.18
The construct validity of the USIS is supported by three findings. First, the USIS is correlated with subjective evaluation of health, feeling bad, and satisfaction with treatment. Individuals that scored high on the USIS reported worse health, again in accordance with our assumptions that unsupportive interactions disrupt health, the opposite from positive social support that enhances health. Although the correlations were not high, they were statistically significant and may add to the ill health of patients with diabetes.
Second, the scale is negatively correlated with positive social support, implying that those with higher social support report lower unsupportive social interaction in accordance with the theoretical assumptions. In addition, more interactions with family increase unsupportive social interaction; however, this is not the case with friends. Family interactions are usually less dependent on the individual (less free individual choice) compared to interactions with friends. It may be that interactions with family are not so much in the control of the patient with diabetes, and therefore may cause increased unsupportive interactions. Whereas interactions with friends are in their control, so if the patient feels interactions with friends are not to their benefit, they may decrease these interactions to suit their social need and not cause unsupportive interactions. These associations could also be relevant for other individuals, not only patients with diabetes; however, this should be tested.
Third, health behaviors were also associated with the USIS scale where those not smoking and performing physical activities as recommended reported lower levels of unsupportive interactions. This may indicate that USIS could be a factor in adherence with medical recommendations, where patients need to adopt health-promoting behaviors.
The two constructs that are part of the USIS, interference and insensitivity, represent different aspects of unsupportive interactions. The interference subscale seems to be associated with aspects of social support, health, and behavior, similar to the whole USIS scale. This subscale represents the interactions people have with family and friends that may disrupt the individual from adherence to taking care of himself/herself. For example, the need to visit many family members and be present at family events may increase overexposure to unhealthy foods for patients with diabetes and not leave time for other activities such as physical activity. This overexposure to situations in which it is hard to adhere to the recommended lifestyle or the need to not be perceived by others as sick may prevent individuals from adhering to the recommended lifestyle changes needed to be taken when having a chronic disease. The second subscale, sensitivity, represents interactions that convey disrespect or disregard. This subscale seems to be related to social support, some measures of health, and smoking, but not to social networks or physical activity. This type of unsupportive interaction may be more a measure of the quality of these interactions and may be more independent of the levels of exposure to social networks.
The USIS varies with socioeconomic characteristics. Arabs were found to have higher rates of unsupportive interactions; this corresponds well with other studies that have shown that Arabs have lower levels of social support even if the social networks are larger and their interactions with their families are more frequent.22 Younger patients with diabetes reported higher levels of unsupportive interactions as did the less educated and more religious. It may be that these characteristics are mediators or moderators between unsupportive interactions and exposure to the number of social interactions. Employment and marital status may also increase exposure to social interactions and therefore increase unsupportive interactions.
Further studies are needed to unravel the importance of unsupportive interactions in the self-management and health of patients with diabetes and other individuals. It is also important to identify those patients who may be vulnerable to unsupportive interactions and find ways to help them cope with their social environments. We suggest to include this measure in studies of adherence with diabetes self-care in order to examine the extent to which unsupportive interactions may be associated with adherence.
There are a number of limitations to this study. This is a cross-sectional study; therefore, no causality can be assumed. It is not clear if unsupportive interactions can effect health, or if individuals with worse health or certain personalities will report higher unsupportive interactions. In addition, we did not test the test–retest reliability of the USIS or its ability to detect changes over time in intervention studies.
This measure did not include the important concept of conflict that is part of the social negativity concept.18 This should be developed in addition to the concept of unsupportive interactions. Unsupportive interactions are very different from relationships that expose the individual to conflict and were not included in this study as they were not suggested to be a problem in the qualitative interviews. Unsupportive interactions may only be a part of the social negativity concept.
In conclusion, the 15-item USIS is an easy to administer valid and reliable measure of unsupportive interactions that may serve as a tool to help identify patients experiencing high levels of unsupportive interactions in their social environment. These may be disrupting their ability to adhere to treatment and may undermine their health in various other ways. Identifying these kinds of problems may enable clinicians to help patients overcome the unsupportive environments that patients live in.
Acknowledgments
This study was funded by Maccabi Institute for Health Services Research of Maccabi Healthcare Services, Israel. We would like to dedicate this study to the memory of the late Professor Revital Gross, who conceived the idea together with OBE.
Author contributions
OBE conceived the idea for the study, designed the study, obtained the funding, developed the questionnaire, conducted the data analysis, and wrote the manuscript. ADH helped in designing the study and in preparing and editing the manuscript. NF helped in designing the study and editing the manuscript. GK helped in designing the study, developing the questionnaire, and preparing and editing the manuscript.
Disclosure
The authors report no conflicts of interest in this work.
References
Chodick G, Porath A, Alapi H, et al. The direct medical cost of cardiovascular diseases, hypertension, diabetes, cancer, pregnancy and female infertility in a large HMO in Israel. Health Policy. 2010;95(2–3):271–276. | ||
American Diabetes Association. Standards of medical care in diabetes – 2010. Diabetes Care. 2010;33 Suppl 1:S11–S61. | ||
Ong KL, Cheung BM, Wong LY, Wat NM, Tan KC, Lam KS. Prevalence, treatment, and control of diagnosed diabetes in the U.S. National Health and Nutrition Examination Survey 1999–2004. Ann Epidemiol. 2008;18(3):222–229. | ||
Elis A, Rosenmann L, Chodick G, Heymann AD, Kokia E, Shalev V. The association between glycemic, lipids and blood pressure control among Israeli diabetic patients. QJM. 2008;101(4):275–280. | ||
García-Pérez LE, Alvarez M, Dilla T, Gil-Guillén V, Orozco-Beltrán D. Adherence to therapies in patients with type 2 diabetes. Diabetes Ther. 2013;4(2):175–194. | ||
Cramer JA. A systematic review of adherence with medications for diabetes. Diabetes Care. 2004;27(5):1218–1224. | ||
Blackburn DF, Swidrovich J, Lemstra M. Non-adherence in type 2 diabetes: practical considerations for interpreting the literature. Patient Prefer Adherence. 2013;7:183–189. | ||
Bailey CJ, Kodack M. Patient adherence to medication requirments for therapy of type 2 diabetes. Int J Clin Pract. 2011;65(3):314–322. | ||
Tang TS, Brown MB, Funnell MM, Anderson RM. Social support, quality of life, and self-care behaviors among African Americans with type 2 diabetes. Diabetes Educ. 2008;34(2):266–276. | ||
DePalma MT, Rollison J, Camporese M. Psychosocial predictors of diabetes management. Am J Health Behav. 2011;35(2):209–218. | ||
Reblin M, Uchino BN. Social and emotional support and its implication for health. Curr Opin Psychiatry. 2008;21(2):201–205. | ||
Uchino BN. Social support and health: a review of physiological processes potentially underlying links to disease outcomes. J Behav Med. 2006;29(4):377–387. | ||
Cohen S. Stress social support and disorder. In: Veie HOF, Baumann U, editors. The meaning and measurement of social support. New York: Hemisphere; 1992:109–124. | ||
Messina CR, Lane DS, Glanz K, et al. Relationship of social support and social burden to repeated breast cancer screening in the women’s health initiative. Health Psychol. 2004;23(6):582–594. | ||
Croezen S, Haveman-Nies A, Picavet HS, et al. Positive and negative experiences of social support and long-term mortality among middle-aged Dutch people. Am J Epidemiol. 2010;172(2):173–179. | ||
Kawachi I, Berkman LF. Social ties and mental health. J Urban Health. 2001;78(3):458–467. | ||
Richmond CA, Ross NA. Social support, material circumstance and health behaviour: influences on health in First Nation and Inuit communities of Canada. Soc Sci Med. 2008;67(9):1423–1433. | ||
Brooks KP, Dunkel Schetter C. Social Negativity and Health: Conceptual and Measurement Issues. Social and Personality Psychology Compass. 2011;5(11):904–918. | ||
Kalish KD. Psychometric Properties of the Social Interactions Questionnaire (SIQ) in an Older Adult Sample. Morgantown: College of Arts and Sciences, West Virginia University; 2001. | ||
Heymann AD, Chodick G, Halkin H, et al. The implementation of managed care for diabetes using medical informatics in a large Preferred Provider Organization. Diabetes Res Clin Pract. 2006;71(3):290–298. | ||
Sherbourne CD, Stewart AL. The Mos social support survey. Soc Sci Med. 1991;32(6):705–714. | ||
Baron-Epel O. Differences in the association between social support and mental health in a multi-cultural population in Israel. Int J Ment Health Promot. 2009;11(4):5–14. |
 © 2015 The Author(s). This work is published and licensed by Dove Medical Press Limited. The full terms of this license are available at https://www.dovepress.com/terms.php and incorporate the Creative Commons Attribution - Non Commercial (unported, v3.0) License.
By accessing the work you hereby accept the Terms. Non-commercial uses of the work are permitted without any further permission from Dove Medical Press Limited, provided the work is properly attributed. For permission for commercial use of this work, please see paragraphs 4.2 and 5 of our Terms.
© 2015 The Author(s). This work is published and licensed by Dove Medical Press Limited. The full terms of this license are available at https://www.dovepress.com/terms.php and incorporate the Creative Commons Attribution - Non Commercial (unported, v3.0) License.
By accessing the work you hereby accept the Terms. Non-commercial uses of the work are permitted without any further permission from Dove Medical Press Limited, provided the work is properly attributed. For permission for commercial use of this work, please see paragraphs 4.2 and 5 of our Terms.