")
Back to Journals » International Journal of Nanomedicine » Volume 10 » Issue 1
Development of an oral push–pull osmotic pump of fenofibrate-loaded mesoporous silica nanoparticles
Authors Zhao Z, Wu C, Zhao Y, Hao Y, Liu Y, Zhao W
Received 1 November 2014
Accepted for publication 13 December 2014
Published 3 March 2015 Volume 2015:10(1) Pages 1691—1701
DOI https://doi.org/10.2147/IJN.S76755
Checked for plagiarism Yes
Review by Single anonymous peer review
Peer reviewer comments 4
Editor who approved publication: Dr Thomas Webster
Zongzhe Zhao, Chao Wu, Ying Zhao, Yanna Hao, Ying Liu, Wenming Zhao
Pharmacy School, Liaoning Medical University, Jinzhou, Liaoning Province, People’s Republic of China
Abstract: In this study, mesoporous silica nanoparticles (MSNs) were used to prepare an oral push–pull osmotic pump. Fenofibrate, the selected model drug, was firstly loaded into the MSNs, followed by a suspending agent consisting of a drug layer of push–pull osmotic pump. Fenofibrate-loaded MSNs were characterized by scanning electron microscopy (SEM), transmission electron microscopy (TEM), nitrogen adsorption/desorption analysis, differential scanning calorimetry (DSC), powder X-ray diffractometry (PXRD) analysis, and Fourier-transform infrared (FT-IR) spectroscopy. Polyethylene oxide of molecular weight (MW) 100,000 and polyethylene oxide of MW 6,000,000 were selected as the suspending agent and the expanding agent, respectively. Cellulose acetate was used as the semipermeable membrane, along with polyethylene glycol 6,000 to increase the flexibility and control the membrane permeability. The in vitro dissolution studies indicated that the osmotic pump tablet combined with MSNs was able to deliver fenofibrate in an approximately zero-order manner in 24 hours. A pharmacokinetic study showed that, although the maximum plasma concentration of the osmotic pump was lower than that of the reference formulation, the relative bioavailability was increased, indicating that the osmotic pump was more efficient than the reference tablets. Therefore, using MSNs as a carrier for poorly water-soluble drugs is an effective method for preparing osmotic pump tablets.
Keywords: poorly water-soluble drug, in vitro dissolution, pharmacokinetic study
Corrigendum for this paper has been published
Introduction
Recently, mesoporous silica nanoparticles (MSNs) have attracted increasing attention due to their unique features, such as inert nature, high surface area, large pore volume, good biocompatibility, and high physicochemical stability.1–4 The large pore volume and high surface area of MSNs results in a high drug-loading capacity. Use of mesoporous silica as a drug carrier was first evaluated by Vallet-Regí et al.5 Since then, an increasing number of research studies have focused on drug-delivery applications of mesoporous silica materials and found that mesoporous silica significantly enhanced the solubility and dissolution of poorly water-soluble drugs.6–10 Because the pore size is only 2–50 nm, the drug is restricted and unable to crystallize. Compared with the crystalline state, the drug in this form exhibits a higher dissolution rate, especially when the solubility is limited by high lattice energy.11–13
Fenofibrate (FF), which belongs to Biopharmaceutical Classification System (BCS) class II, is poorly water soluble but is highly permeable. Therefore, the dissolution process is a key step in its drug absorption and in determining its oral bioavailability. After loading FF into MSNs, the solubility and dissolution rate are significantly improved.6 However, two problems remain: (1) its release behavior cannot be controlled and (2) there are fluctuations in the plasma concentration. Zhang et al have reported that, after feeding FF to beagles, multiple peaks appeared in the plasma concentration–time profiles.14 The cause of this phenomenon is that absorption along the gut following administration of a large amount of FF (100 mg) is discontinuous.14–17 Therefore, we prepared a push–pull osmotic pump (PPOP) to control the release behavior and absorption of FF, in order to reduce fluctuations in the plasma concentration.
The osmotic pump drug delivery system is an ideal oral controlled-release formulation because it exhibits zero-order release. The benefit of this drug delivery system is independent of the release medium pH and the conditions in the gastrointestinal tract,18–20 and allows constant drug plasma levels to be achieved with minimized fluctuations.21–23 In 1975, Theeuwes was the first to develop an elementary osmotic pump (EOP) to delivery water-soluble drugs.19,24,25 The core tablet of an EOP contains an active agent, which draws in water through the semipermeable membrane to form a saturated solution. The dissolved drug is released from the pump at a constant rate under the power generated from the osmotic pressure gradient. Since FF is insoluble in water, it cannot be released at a constant rate from an EOP. In order to allow FF to be released from the osmotic pump, we prepared a PPOP designed to deliver poorly water-soluble drugs. The core tablet of the PPOP consisted of a drug layer and a push layer. The push layer expands after absorbing water through the semipermeable membrane and pushes out the drug and polymer in the drug layer through the release hole, in the form of a suspension.
Tahvanainen et al have reported the development of tablet formulations containing mesoporous silica material,26 They studied the release behavior of the uncompressed drug-loaded mesoporous silica material and the formulated tablet, and found that the drug-loaded mesoporous silica material could be compressed into tablets to significantly increase the release rate of a poorly water-soluble drug. This demonstrated the feasibility of using mesoporous silica material for tableting. We optimized the formulation of a PPOP consisting of drug-loaded MSNs in a series of in vitro dissolution experiments and examined the pharmaceutical performance to demonstrate its ability to reduce the plasma concentration fluctuations and increase the bioavailability.
Materials and methods
Materials
Tetraethyl orthosilicate (TEOS), 2,2′-azobis (2-methylpropionamidine) dihydrochloride (AIBA) and hexadecyl trimethyl ammonium bromide (CTAB) were purchased from Tianjin Bodi Chemical Holding Co., Ltd. (Tianjin, People’s Republic of China). FF with purity >99% was provided by Dalian Meilun Pharmaceutical Co., Ltd. (Dalian, People’s Republic of China). Ordinary FF tablets (the reference tablets) were obtained from Hangzhou Minsheng Pharmaceutical Co., Ltd. (Hangzhou, People’s Republic of China). Polyethylene oxide (PEO) (different types) was purchased from Dow Chemical (Shanghai, People’s Republic of China). Polyethylene glycol (PEG) 6,000 and cellulose acetate (CA) were obtained from Sinopharm Chemical Reagent Co., Ltd. (Shanghai, People’s Republic of China). All other chemicals used in this study were of analytical/high-performance liquid chromatography (HPLC) grade. Caco-2 cells were purchased from China Medical University.
Preparation of MSNs and drug-loading
A carefully weighed amount (0.1 g) of CTAB was placed in a three-necked flask, dissolved in 30 mL of water, and heated at 60°C with stirring to form a clear solution. Then, 16 mL octane, 22 mg lysine, 1 mL TEOS, styrene monomer (50 mg/mL), and AIBA (0.84 mg/mL) were added to the solution. The system was heated at 60°C for 3 hours in a nitrogen atmosphere. Then, the heating was stopped, and the suspension was cooled naturally to room temperature. After standing for 12 hours, the suspension was centrifuged at a rate of 10,000× g and washed with ethanol, and then the obtained solid was dried at 50°C for 12 hours. Finally, the particles were calcined at 500°C to obtain MSNs.27
FF was loaded into pores of MSNs by the evaporation method. In detail, a certain amount of FF was dissolved in chloroform, followed by addition of an appropriate amount of MSNs to obtain samples with different FF-to-MSN ratios (1:1, 1:2, and 1:3 [w/w]). After stirring for 12 hours at 25°C in a closed container, samples were evaporated under normal conditions, then dried in a vacuum oven.
Characterization of FF-MSNs
Scanning electron microscopy and transmission electron microscopy
The morphology and mesostructure of the samples were observed by scanning electron microscopy (SEM) (JSM-7001F; JEOL Ltd., Tokyo, Japan), operated at 20 kV, and transmission electron microscopy (TEM) (Tecnai G2F30; FEI Co, Hillsboro, OR, USA), operated at 200 kV, respectively.
Nitrogen adsorption/desorption analysis
The nitrogen adsorption/desorption isotherms were examined on a surface area analyzer (SA3100; Beckman Coulter Inc, Brea, CA, USA). Samples were degassed at 40°C for 12 hours before testing. The Brunauer–Emmett–Teller (BET) method was used to determine the surface area, the Barrett–Joyner–Halenda (BJH) model was used to analyze the pore size distribution, and the amount of nitrogen adsorption was used to calculate the total volume of the pores.
Differential scanning calorimetry and powder X-ray diffractometry analysis
Thermograms of FF-MSN were obtained using differential scanning calorimetry (DSC-60; Shimadzu Corp, Tokyo, Japan). The equipment was calibrated using an indium standard. The powder samples were heated, at constant rate of 10°C/min over the range 50°C–300°C, in aluminum pans. The system was maintained under a nitrogen flow at a rate of 40 mL/min to provide an inert atmosphere.
The powder X-ray diffractometry patterns were recorded (Ultima IV; Ultima IV, Rigaku Corp, Tokyo, Japan) to further confirm the solid state of FF in MSN. Samples were irradiated with Cu–Kα radiation under 30 kV and 30 mA over a 2θ range from 5° to 60°. The step size and scan speed were 0.02° and 4°/min, respectively.
Fourier-transform infrared spectroscopy
Fourier-transform infrared (FT-IR) spectroscopy was carried out (IFS 55; Bruker Corp, Billerica, MA, USA) over the range 4,000–400 cm−1, using the KBr pellet method.
Preparation of PPOP tablets
Preparation of the core tablets
The core tablets were prepared with powder direct compres-sion technology according to the formulation shown in the Table 1. Before tableting, all components of the drug layer and the push layer were ground in a mortar then passed through an 80-mesh sieve to mix well, respectively. The push layer powder was first slightly compressed using a single punch tableting machine (TDP-1.5; Shanghai First Pharmaceutical Machinery Factory, Shanghai, People’s Republic of China) and then filled with the drug layer powder. The hardness of the obtained core tablets was in the range of 6–8 kg⋅cm−2.
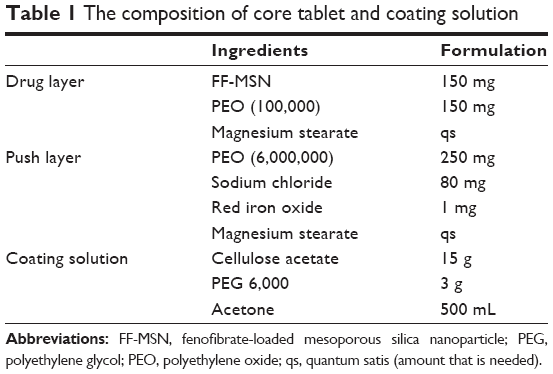 | Table 1 The composition of core tablet and coating solution |
Drilling hole and coating
The core tablets had a manually drilled hole with diameter of 0.8 mm on the drug-side surface28 and was coated with CA acetone solution containing PEG 6,000, using a conventional coating machine (BY-300A; Huanghai Drug Inspection Instrument Co., Ltd., Shanghai, People’s Republic of China), with an increase of 8%–10% in the weight of the core tablet.
Dissolution experiments
The dissolution test was conducted according to the United States Pharmacopeia (USP) 2 paddle method using a dissolution apparatus (ZRS-8G; Tianjin Guoming Medical Equipment Co., Ltd., People’s Republic of China). The dissolution medium was 1,000 mL water with added 1% sodium dodecyl sulfate (SDS) to achieve sink conditions. The test was operated at 37°C±0.5°C, with a paddle speed of (100±1) rpm. Samples equivalent to 100 mg FF were added to the dissolution medium at time zero, then 5 mL samples were collected at specific times (1, 2, 4, 6, 8, 12, 16, and 24 hours). Fresh medium (5 mL) was added to the dissolution cup to maintain a constant medium volume. The concentration of FF was determined by ultraviolet (UV) spectroscopy (UV-2000; Unico, Dayton, NJ, USA) at a wavelength of 290 nm.
In vivo pharmacokinetic study
Animals and dosing
A two-period crossover test was adopted to evaluate the pharmacokinetics of two different preparations (PPOP and reference tablets) in six beagle dogs provided by the Liaoning Medical University Laboratory Animal Center, Jinzhou, People’s Republic of China. The protocol (study number SCSK [Liao] 2008-0002) of the animal experimental study was approved by the Liaoning Medical University Laboratory Animal Ethics Committee. Before the experiment, the beagle dogs (10.0±1.5 kg) were randomly assigned to two groups and fasted for 12 hours. One group was given the reference tablet, while the other group was treated with the designed PPOP in the morning. In order to ensure that the drug was not chewed during administration, the operator first pinched the dog’s jaw, raised the palate, and then placed the drug into the dog’s throat. At 4 hours after dosing, the animals were given a standard lunch. The washout time was at least 1 week. Blood samples (3.0 mL) were collected from the foreleg vein, using a vacuum blood collection needle and heparinized tube, at 0.5, 1, 2, 3, 4, 5, 6, 8, 12, 16, 24, 36, 48, and 72 hours after administration. Plasma samples were obtained by centrifuging the blood samples at 4,250× g for 10 minutes using a high-speed centrifuge (TGL-16B; Anting Scientific Instrument, Shanghai, People’s Republic of China) and stored at −20°C.14,29,30
Determination of FF in plasma
Following hydrolysis of the ester bond, FF is rapidly converted to fenofibric acid, which is the active form and major metabolite of FF.16 Therefore, we measured the plasma concentrations of fenofibric acid by HPLC.17
To 400 μL plasma samples, we added 20 μL methanol and 400 μL of 1 mol/L HCl solution, followed by 20 μL internal standard solution (indomethacin, 20 μg/ml in methanol). After vortex mixing for 3 minutes, 3 mL anhydrous diethyl ether was added and the solution vortexed for a further 10 minutes. After centrifugation at 4,250× g for 10 minutes, the organic layer was transferred to another tube and evaporated at 40°C using a high-speed centrifuge. The residue was dissolved in methanol and centrifuged at 12,750× g for 10 minutes, and then, 20 μL supernatant was subjected to HPLC.14
Data analysis
All data were processed using DAS 2.0 software. The maximum plasma concentration (Cmax) and the time to reach Cmax (Tmax) were directly got from the FF acid plasma concentration–time curve. The area under the FF acid plasma concentration–time curve (AUC(0–∞)) and the elimination half-life (t1/2) were obtained from the results of software processing.
MTT assay
MTT assay was used to determine the cytotoxicity of different concentrations of MSNs on Caco-2 cells. The detailed operation was as follows: Caco-2 cells (logarithmic phase, 105 cells/mL) were seeded in 96-well plates (each well 100 μL) and incubated at 37°C and 5% CO2 for 24 hours; then, 20 μL MSN suspension containing different concentrations (20, 50, 100, 200, or 500 μg/mL) were added to the 96-well plates and incubated for 24 hours. Following this, 10 μL MTT (5 mg/mL) solution was added per well. After 24 hours, the solution was replaced with 100 μL dimethyl sulfoxide (DMSO). Finally, the absorbance was performed using a Multiskan™ (Mk3; Thermo Fisher Scientific Inc, Waltham, MA, USA) at 492 nm. The cell viability without MSN treatment was 100%, calculating the relative activity in each well of cells.
Results and discussion
Characterization of FF-MSNs
SEM and TEM
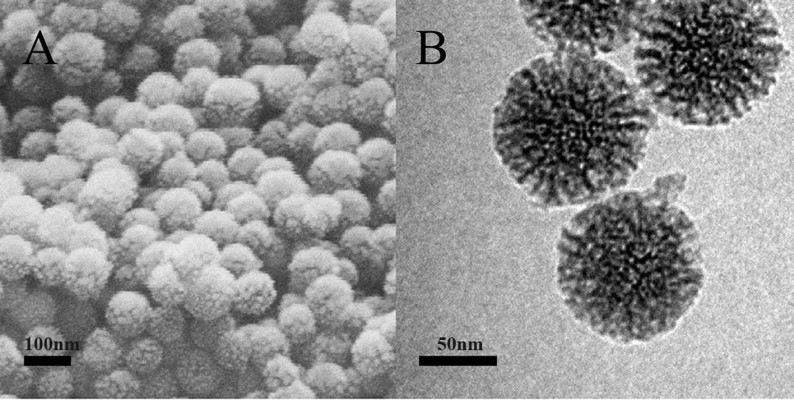
As shown in Figure 1A, the MSNs were in the form of regular spheres, with a diameter of about 100 nm, and had a ragged surface, which is attributed to the nanopores. TEM was used to further study the pore structure of the MSNs. From the TEM image (Figure 1B), we can see that the pores of the MSNs were regular and extended from the center outward. The pore diameter was about 10 nm, confirmed by N2 adsorption and desorption analysis (Table 2).
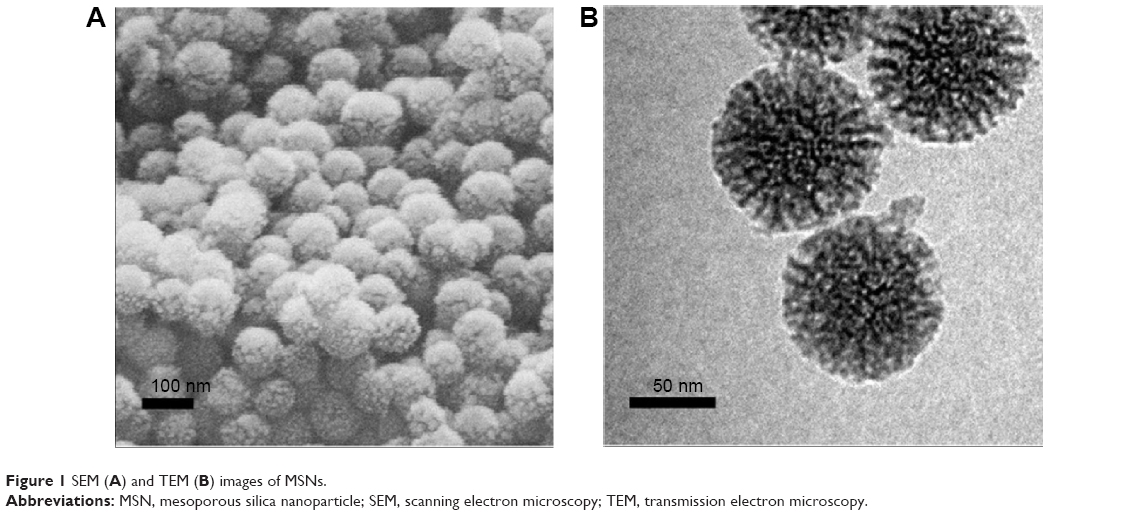 | Figure 1 SEM (A) and TEM (B) images of MSNs. |
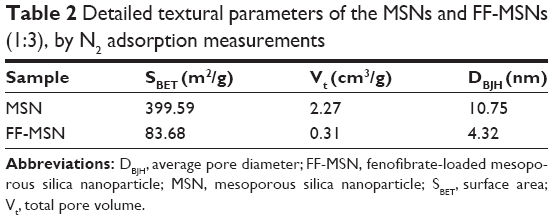 | Table 2 Detailed textural parameters of the MSNs and FF-MSNs (1:3), by N2 adsorption measurements |
These nanopores greatly increase the specific surface area of the MSNs and add to their adsorption ability. The unique mesoporous structure and good biocompatibility make MSNs an excellent candidate for a drug carrier. The solvent evaporation method was used to load the drug. Initially, the drug solution entered the pores, and then, the drug was deposited as the solvent evaporated. However, the crystallization process was inhibited by the small size of the pores. According to Vialpando et al11 compared with the crystalline state, the amorphous drug is more soluble. Therefore, when the drug is loaded in MSNs, the drug solubility is significantly increased and the dissolution is also increased.
Nitrogen adsorption measurements
The N2 adsorption–desorption isotherms and the pore size distributions of MSN and FF-MSN are shown in Figure 2. We found that the N2 adsorption capacity and the pore size (4.32 nm) of FF-MSNs was significantly less than those of MSNs (pore size 10.75 nm), which indicated that the drug was loaded in MSN and occupied a certain amount of pore volume, resulting in a decrease in the nitrogen adsorption. Table 2 summarizes three physical parameters, namely the surface area, total pore volume, and average pore diameter of the MSNs and FF-MSNs. These data showed that MSNs had very large surface area and pore volume, which confirmed their stronger adsorption ability and great potential for application as a drug delivery vehicle. After loading with FF, those parameters of the MSNs were reduced significantly due to the FF, which filled the pores, blocking the absorption of N2, these indicated that FF was successfully loaded into the mesopores of the MSNs.
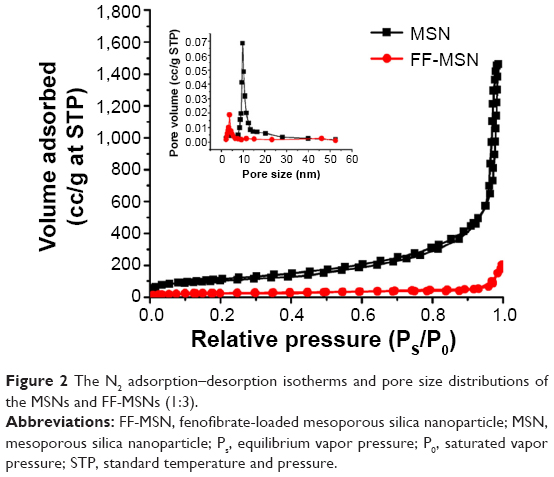 | Figure 2 The N2 adsorption–desorption isotherms and pore size distributions of the MSNs and FF-MSNs (1:3). |
DSC and PXRD
The crystal properties were examined using DSC. Figure 3 shows the DSC thermograms of pure FF, physical mixtures of FF and MSNs, and different ratio FF-MSNs. A single sharp endothermic melting peak at 84.0°C was observed for both pure FF and physical mixtures of FF and MSNs; however, the FF endothermic peak disappeared completely at ratios of 1:2 and 1:3, indicating that FF existed in an amorphous state. However, when the ratio was 1:1, an FF endothermic peak was present, perhaps because the low percentage of the carrier resulted in incomplete loading of the drug into the pores, and a portion of the drug was attached to the surface of the MSNs.
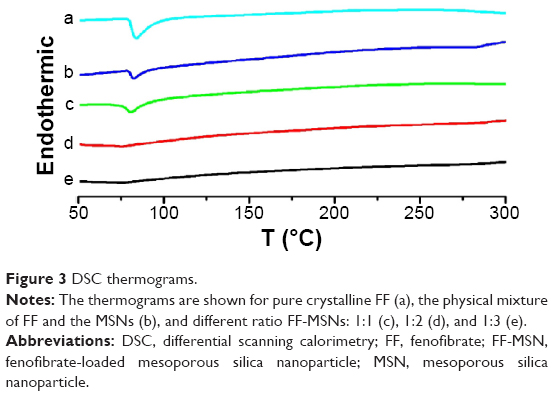 | Figure 3 DSC thermograms. |
PXRD was also used to describe the crystalline properties of FF. The PXRD profiles of FF, physical mixtures of FF and MSNs, and different ratio FF-MSNs are shown in Figure 4. A series of characteristic diffraction peaks of pure FF showed at a 2θ of 14.58°, 20.86°, 22.24°, and 26.18° in the physical mixtures. However, there was no peak in the FF-MSN solid dispersion at ratios of 1:2 and 1:3. Therefore, the FF absorbed into MSNs was in an amorphous state. At the ratio of 1:1, a part of the diffraction peaks of FF remained, suggesting that there was still presence of crystalline drug, which verified the conclusions of DSC.
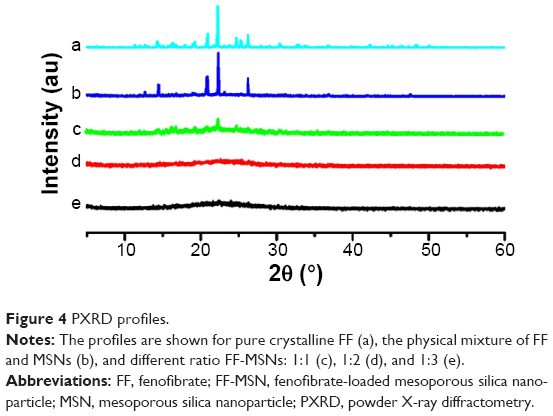 | Figure 4 PXRD profiles. |
FT-IR
FT-IR was used to analyze the chemical groups of a sample and also to assess whether a chemical reaction took place between FF and the MSNs. As shown in Figure 5, the carbonyl stretching vibration peak (υc=o1,728 cm−1) of FF (Figure 5a) did not migrate after loading into the MSNs (Figure 5d). This showed that there were no hydrogen bonds between FF and MSN. Moreover, the carbonyl stretching vibration peak of FF became weaker after loading into the MSNs, which may be due to the embedding effect of MSNs. Compared with the infrared spectra of FF, there were no new peak formations in the FF-MSN spectra, indicating that the FF and MSNs did not chemically react but formed a physical adsorption.
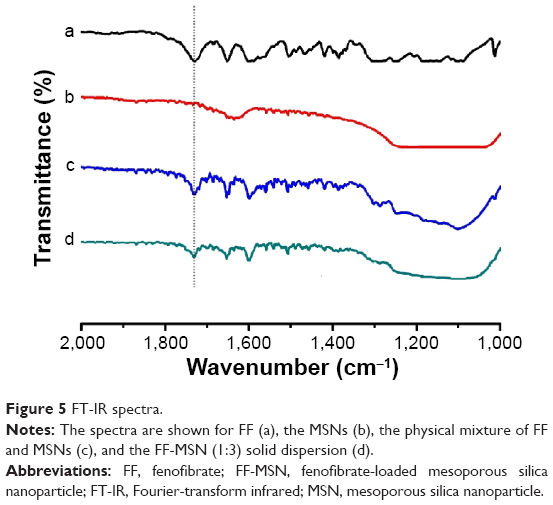 | Figure 5 FT-IR spectra. |
In vitro dissolution of FF-MSNs
Figure 6 shows the dissolution profiles of the pure FF and FF-loaded MSNs at different ratios in water containing 1% SDS (w/v). For the pure FF, almost 15% dissolved within 60 minutes. However, when loaded into MSNs, the dissolution rate of FF from MSNs was significantly increased because the particle size of the drug was limited by the nanoscale pores, and the contact area of drug and dissolution medium was increased. The increased dissolution was attributed to the larger surface area of drug, according to the Noyes–Whitney equation:31,32
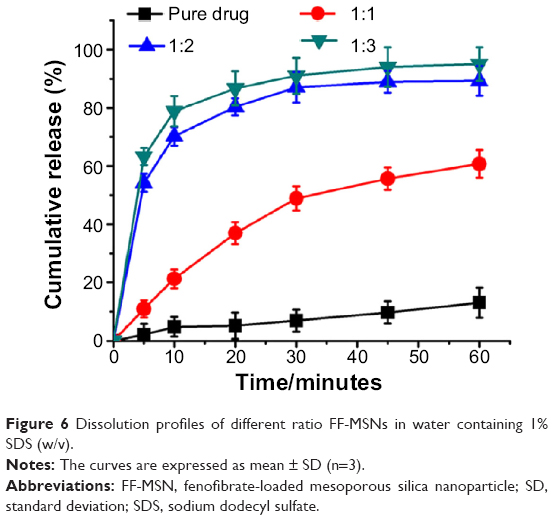 | Figure 6 Dissolution profiles of different ratio FF-MSNs in water containing 1% SDS (w/v). |
| (1) |

where k1 is the dissolution rate constant, S is the contact area between the drug and the dissolution medium, Cs is the apparent solubility and C is the drug concentration at time t.
As can be seen from the above equation, the dissolution rate dC/dt is proportional to the contact area between the drug and the dissolution medium (S). Under the conditions of other parameters constant, increasing the contact area between the drug and the dissolution medium can effectively speed up the dissolution rate.
Among the different drug-to-silica ratios (1:1, 1:2, and 1:3), 1:2 and 1:3 displayed ideal dissolution behavior, and more than 90% was dissolved within 60 minutes. Statistical analysis showed that the drug-release behavior at ratios of 1:2 and 1:3 exhibited no significant differences. DSC and XRD analysis proved that when the ratio of FF to MSNs was 1:2, the MSNs were able to effectively inhibit the crystallization of FF. At this ratio, after oral administration, the drug can be quickly dissolved in gastrointestinal fluids and then be absorbed into the blood. Therefore, the ratio of FF and MSN was set at 1:2 for the following further investigations.
Evaluation of the PPOP
The optimal formulation was mainly affected by the compositions of the core tablets and the coat film. Examining the dissolution performance in vitro, we found that the amount of the suspending agent PEO (100,000), the amount of the expanding agent PEO (6,000,000), the kind of osmotically active substances, and the coating thickness had significant influence on the FF release performance. However, the size of the drilling hole and the amount of sodium chloride in the push layer had no effect.
Figure 7A shows the influence of the amount of PEO 100,000, the suspending agent in the drug layer, on drug release. It was found that a slow release was obtained along with an increased amount of PEO 100,000, due to the high viscosity of the suspension after drug layer infiltration. The amount of PEO 6,000,000 in the push layer also played an important role in drug release (Figure 7B), increasing the amount of PEO, which significantly improved the rate of drug release. PEO in the push layer swelled at near constant rate after absorbed water passed through the semipermeable membrane, then the increased volume generated pressure to push the drug layer out from release hole, in line with the zero-order model (Table 3). Therefore, increasing the amount of PEO in the push layer could generate greater pressure and push the drug layer out from release hole more rapidly. Osmotically active substances can increase the rate of the water across the membrane and into the pump, to accelerate the expansion of PEO and push drug out via the release hole. The effects of different osmotically active substances on the release profile are shown in Figure 7C. It can be seen that NaCl can guarantee stable and sustained drug release; however, the release profile became slow if lactose was used as the osmotic active substances, which may be related to its dissolution rate in water. As water can only get into the interior of the osmotic pump through the membrane, the composition and thickness of the membrane therefore has a significant impact on the drug release. The coating solution was CA with 20% PEG 6,000, according to Liu et al.33 The thickness of the membrane is difficult to measure but was reflected by the increased weight after coating. Figure 7D shows the effect of the increased weight of coating on the release of the drug, with the weight increase and slower release of drug being due to the lower rate of water passing through the membrane.
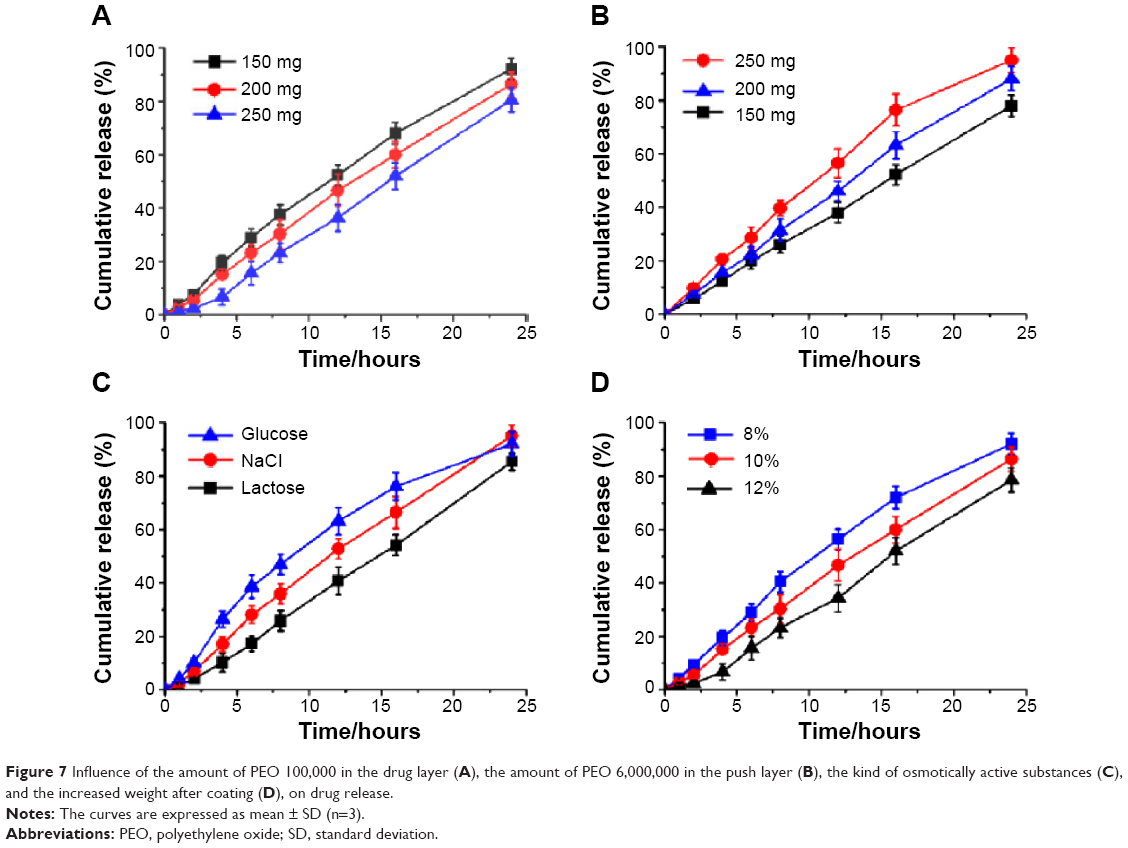 | Figure 7 Influence of the amount of PEO 100,000 in the drug layer (A), the amount of PEO 6,000,000 in the push layer (B), the kind of osmotically active substances (C), and the increased weight after coating (D), on drug release. |
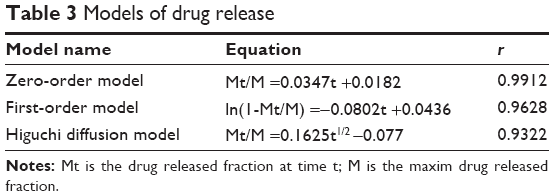 | Table 3 Models of drug release |
The in vitro dissolution performance
The preparation and drug release process of PPOP are presented in Figure 8. FF was firstly loaded into MSNs to obtained FF-MSNs, which were then placed in the drug layer of the PPOP. After oral administration, the PPOP entered the gastrointestinal tract. PEO in the push layer swelled after absorbed water passed through the semipermeable membrane (CA membrane with PEG 6,000, to control the permeability) and pushed FF-MSNs out of the release hole. After that, FF was rapidly dissolved in the gastrointestinal fluids (as the dissolution rate was enhanced by MSNs) and absorbed into the blood.
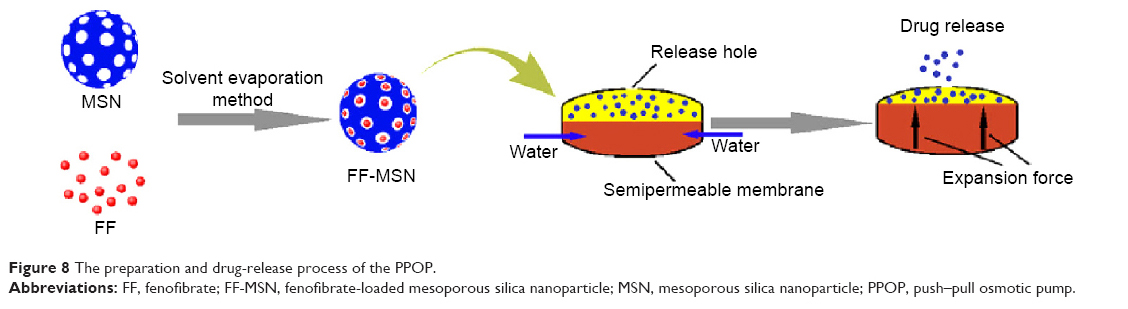 | Figure 8 The preparation and drug-release process of the PPOP. |
The in vitro dissolution of the designed PPOP was determined in water with 1% SDS, as shown in Figure 9A. We found that the designed PPOP had the ability to maintain a constant release rate from 0 to 24 hours. We fit the release of drug to three equations, including the zero-order model, the first-order model, and the Higuchi diffusion model, and the results are shown in Table 3. As can be seen from the results, the release manner of the designed PPOP was more in line with the zero-order model (r=0.9912). This is because the high-MW PEO can stably expand after absorption and then push the drug out of the hole at an approximately constant rate, which is also the main reason for selecting PEO 6,000,000 as the expanding agent. After oral administration, FF–MSNs would be released from the PPOP in zero-order manner, then FF would dissolve out from MSN and be quickly absorbed into the blood as a result of good biological membrane permeability. We hope to use this method to control the fluctuations of the plasma concentration effectively and improve the bioavailability of FF.
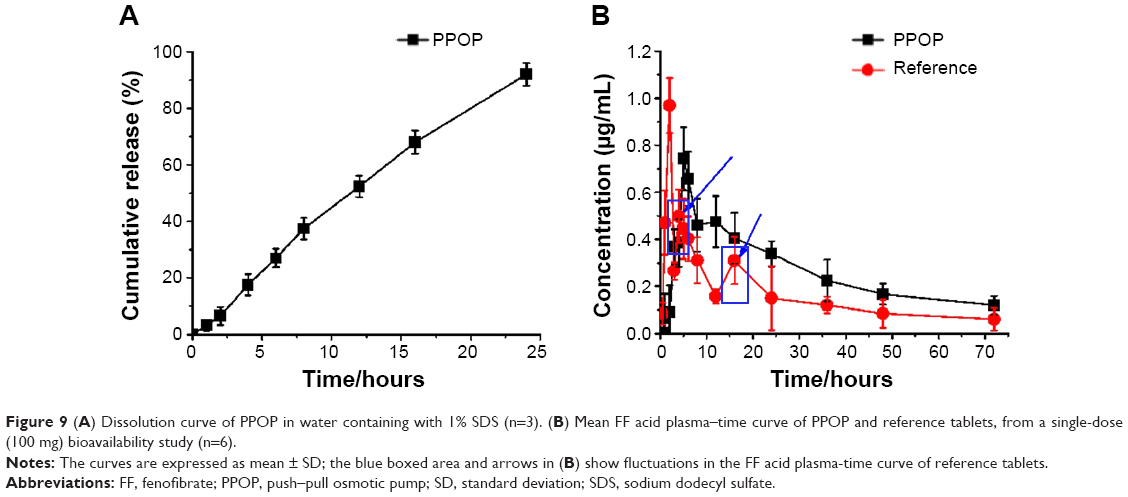 | Figure 9 (A) Dissolution curve of PPOP in water containing with 1% SDS (n=3). (B) Mean FF acid plasma–time curve of PPOP and reference tablets, from a single-dose (100 mg) bioavailability study (n=6). |
In vivo pharmacokinetics study
The mean plasma FF acid concentration–time curves for both the POPP and reference tablets in dogs are presented in Figure 9B. The pharmacokinetic parameters of FF are shown in Table 4. From the results obtained, we can see that a slower absorption was obtained for the PPOP (Tmax of 5.12 hours) compared with the reference (Tmax of 2.23 hours), while the Cmax of the PPOP (0.74±0.31 μg/mL) was less than that of the reference tablets (0.96±0.17 μg/mL). Zhang et al reported that multiple peaks (around 3 hours and 16 hours) appeared on the plasma concentration–time curves of the reference tablets;14 however, the plasma concentration–time curves of the PPOP exhibited only one peak and no large fluctuations, which results in an improvement in drug safety. Compared with the reference tablets, the relative bioavailability of the PPOP was increased by about 60.32%, which was attributed to the fact that MSN inhibited the crystallization of FF (Figures 3 and 4). Therefore, POPP tablets clearly controlled the release rate of FF, resulting in a stable plasma concentration and significantly improved oral bioavailability of FF compared with the reference tablets.
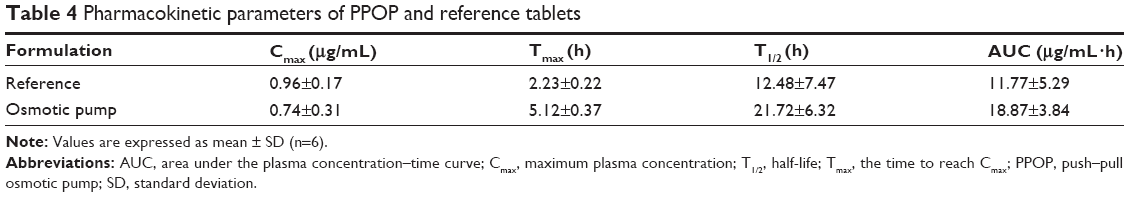 | Table 4 Pharmacokinetic parameters of PPOP and reference tablets |
Cytotoxicity assays
Figure 10 presented the cytotoxicity of different concentrations of MSNs on Caco-2 cells in 24 hours. As can be seen, cell viability was dependent on the concentration of MSNs. When the concentration increased, there was a slight decrease in cell viability, but the cell viability remained above 90%, which indicated that the MSNs exhibited no significant cytotoxicity on Caco-2 cells; at the concentration of 20–500 μg/mL, all the cells treated with MSNs could survive and maintain a normal growth rate. MSNs only produced a slight toxicity at higher concentration. Therefore, MSNs are biocompatible and can be an excellent vehicle for drug delivery, as concluded in many related studies.7,34,35
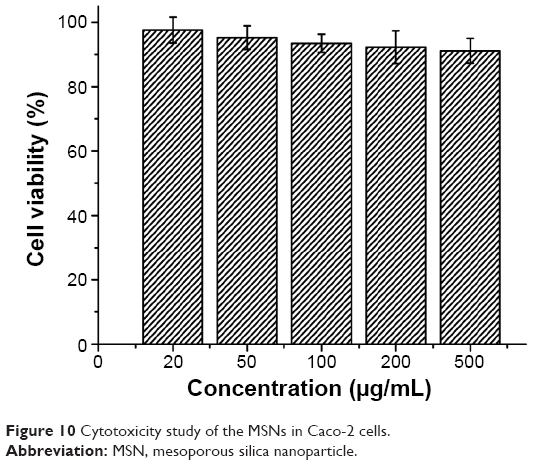 | Figure 10 Cytotoxicity study of the MSNs in Caco-2 cells. |
Conclusion
Mesoporous materials offer a new method to improve the solubility of poorly water-soluble drugs. However, this is just one of their many applications. Their unique structural characteristics will attract more and more attention and be applied to a wide number of fields, including pharmacy, to solve a variety of problems.
The osmotic pump is the best choice for controlled-release formulations because it offers a major advantage of controlling fluctuations in the plasma concentration, particularly when using highly toxic drugs. It is capable of releasing drugs in a zero-order manner and of maintaining the plasma concentration within the therapeutic window, in order to reduce the toxic side effects of some drugs. In this study, we demonstrated that an osmotic pump in combination with MSNs could effectively control the drug release, reduce fluctuations in the plasma concentration, and increase the drug bioavailability. This provides new information on the use of MSNs.
Acknowledgments
This work was supported by the National Natural Science Foundation of China (grant number 81302707), the Natural Science Foundation of Liaoning Province (grant number 2013022052), University Students' Innovation and Entrepreneurship Training program of Liaoning Province (grant number 201310160027), the Principal Fund-Aohongboze-pharmaceutical Innovation Special Fund (grant number XZJJ20130104-07) and the Construction of Clinical Cardiovascular System Drug Evaluation Research Technology Platform (grant number 2012ZX09303016-002).
Disclosure
The authors report no conflicts of interest in this work.
References
Wang F, Hui H, Barnes TJ, Barnett C, Prestidge CA. Oxidized mesoporous silicon microparticles for improved oral delivery of poorly soluble drugs. Mol Pharm. 2010;7(1):227–236. | ||
Chen JF, Ding HM, Wang JX, Shao L. Preparation and characterization of porous hollow silica nanoparticles for drug delivery application. Biomaterials. 2004;25(4):723–727. | ||
Zhao P, Jiang H, Jiang T, et al. Inclusion of celecoxib into fibrous ordered mesoporous carbon for enhanced oral bioavailability and reduced gastric irritancy. Eur J Pharm Sci. 2012;45(5):639–647. | ||
Wang X, Li X, Ito A, Sogo Y, Ohno T. Particle-size-dependent toxicity and immunogenic activity of mesoporous silica-based adjuvants for tumor immunotherapy. Acta Biomater. 2013;9(7):7480–7489. | ||
Vallet-Regí M, Balas F, Arcos D. Mesoporous materials for drug delivery. Angew Chem Int Ed Engl. 2007;46(40):7548–7558. | ||
Hu Y, Zhi Z, Zhao Q, et al. 3D cubic mesoporous silica microsphere as a carrier for poorly soluble drug carvedilol. Microporous and Mesoporous Mater. 2012;147(1):94–101. | ||
He Q, Ma M, Wei C, Shi J. Mesoporous carbon@silicon-silica nanotheranostics for synchronous delivery of insoluble drugs and luminescence imaging. Biomaterials. 2012;33(17):4392–4402. | ||
Kilpeläinen M, Mönkäre J, Vlasova MA, et al. Nanostructured porous silicon microparticles enable sustained peptide (Melanotan II) delivery. Eur J Pharm Biopharm. 2011;77(1):20–25. | ||
Fu C, Liu T, Li L, Liu H, Chen D, Tang F. The absorption, distribution, excretion and toxicity of mesoporous silica nanoparticles in mice following different exposure routes. Biomaterials. 2013;34(10):2565–2575. | ||
Kapoor S, Hegde R, Bhattacharyya AJ. Influence of surface chemistry of mesoporous alumina with wide pore distribution on controlled drug release. J Control Release. 2009;140(1):34–39. | ||
Vialpando M, Aerts A, Persoons J, Martens J, Van Den Mooter G. Evaluation of ordered mesoporous silica as a carrier for poorly soluble drugs: influence of pressure on the structure and drug release. J Pharm Sci. 2011;100(8):3411–3420. | ||
Tabasi O, Falamaki C, Khalaj Z. Functionalized mesoporous silicon for targeted-drug-delivery. Colloids Surf B Biointerfaces. 2012;98:18–25. | ||
Pastor E, Matveeva E, Valle-Gallego A, Goycoolea FM, Garcia-Fuentes M. Protein delivery based on uncoated and chitosan-coated mesoporous silicon microparticles. Colloids Surf B Biointerfaces. 2011;88(2):601–609. | ||
Zhang L, Chai G, Zeng X, He H, Xu H, Tang X. Preparation of fenofibrate immediate-release tablets involving wet grinding for improved bioavailability. Drug Dev Ind Pharm. 2010;36(9):1054–1063. | ||
Plusquellec Y, Efthymiopoulos C, Duthil P, Houin G. A pharmacokinetic model for multiple sites discontinuous gastrointestinal absorption. Med Eng Phys. 1999;21(8):525–532. | ||
Mertens B, Cahay B, Klinkenberg R, Streel B. An automated method for the simultaneous determination of pravastatin, 3-hydroxy isomeric metabolite, pravalactone and fenofibric acid in human plasma by sensitive liquid chromatography combined with diode array and tandem mass spectrometry detection. J Chromatogr A. 2008;1189(1–2):493–502. | ||
Cho YD, Park YJ. In vitro and in vivo evaluation of a self-microemulsifying drug delivery system for the poorly soluble drug fenofibrate. Arch Pharm Res. 2014;37(2):193–203. | ||
Verma RK, Garg S. Development and evaluation of osmotically controlled oral drug delivery system of glipizide. Eur J Pharm Biopharm. 2004;57(3):513–525. | ||
Theeuwes F. Elementary osmotic pump. J Pharm Sci. 1975;64(12):1987–1991. | ||
Xu W, Li N, Gao C. Preparation of controlled porosity osmotic pump tablets for salvianolic acid and optimization of the formulation using an artificial neural network method. Acta Pharmaceutica Sinica B. 2011;1(1):64–70. | ||
Hill A, Geiβler S, Weigandt M, Mäder K. Controlled delivery of nanosuspensions from osmotic pumps: zero order and non-zero order kinetics. J Control Release. 2012;158(3):403–412. | ||
Eckenhoff B, Yum SI. The osmotic pump: novel research tool for optimizing drug regimens. Biomaterials. 1981;2(2):89–97. | ||
Sathyan G, Xu E, Thipphawong J, Gupta SK. Pharmacokinetic investigation of dose proportionality with a 24-hour controlled-release formulation of hydromorphone. BMC Clin Pharmacol. 2007;7:3. | ||
Theeuwes F. Evolution and design of ‘rate controlled’ osmotic forms. Curr Med Res Opin. 1983;8 Suppl 2:S20–S27. | ||
Theeuwes F, Yum SI. Principles of the design and operation of generic osmotic pumps for the delivery of semisolid or liquid drug formulations. Ann Biomed Eng. 1976;4(4):343–353. | ||
Tahvanainen M, Rotko T, Mäkilä E, et al. Tablet preformulations of indomethacin-loaded mesoporous silicon microparticles. Int J Pharm. 2012;422(1–2):125–131. | ||
Nandiyanto ABD, Kim SG, Iskandar F, Okuyama K. Synthesis of spherical mesoporous silica nanoparticles with nanometer-size controllable pores and outer diameters. Microporous and Mesoporous Mater. 2009;120(3):447–453. | ||
Liu L, Xu X. Preparation of bilayer-core osmotic pump tablet by coating the indented core tablet. Int J Pharm. 2008;352(1–2):225–230. | ||
Zhang X, Yi Y, Qi J, et al. Controlled release of cyclosporine A self-nanoemulsifying systems from osmotic pump tablets: near zero-order release and pharmacokinetics in dogs. Int J Pharm. 2013;452 (1–2): 233–240. | ||
Kiekens F, Eelen S, Verheyden L, Daems T, Martens J, Van Den Mooter G. Use of ordered mesoporous silica to enhance the oral bioavailability of ezetimibe in dogs. J Pharm Sci. 2012;101(3):1136–1144. | ||
Noyes AA, Whitney WR. The rate of solution of solid substances in their own solutions. J Am Chem Soc. 1897;19(12):930–934. | ||
Bruner L, Tolloczko S. Über die Auflösungsgeschwindigkeit fester Körper [The dissolution rate of solid bodies]. Zeitschrift für Anorganische Chemie. 1901;28(1):314–330. German. | ||
Liu X, Wang S, Chai L, et al. A two-step strategy to design high bioavailable controlled-release nimodipine tablets: the push-pull osmotic pump in combination with the micronization/solid dispersion techniques. Int J Pharm. 2014;461(1–2):529–539. | ||
Zhang Y, Wang J, Bai X, Jiang T, Zhang Q, Wang S. Mesoporous silica nanoparticles for increasing the oral bioavailability and permeation of poorly water soluble drugs. Mol Pharm. 2012;9(3):505–513. | ||
Jia L, Shen J, Li Z, et al. In vitro and in vivo evaluation of paclitaxel-loaded mesoporous silica nanoparticles with three pore sizes. Int J Pharm. 2013;445(1–2):12–19. |
 © 2015 The Author(s). This work is published and licensed by Dove Medical Press Limited. The full terms of this license are available at https://www.dovepress.com/terms.php and incorporate the Creative Commons Attribution - Non Commercial (unported, v3.0) License.
By accessing the work you hereby accept the Terms. Non-commercial uses of the work are permitted without any further permission from Dove Medical Press Limited, provided the work is properly attributed. For permission for commercial use of this work, please see paragraphs 4.2 and 5 of our Terms.
© 2015 The Author(s). This work is published and licensed by Dove Medical Press Limited. The full terms of this license are available at https://www.dovepress.com/terms.php and incorporate the Creative Commons Attribution - Non Commercial (unported, v3.0) License.
By accessing the work you hereby accept the Terms. Non-commercial uses of the work are permitted without any further permission from Dove Medical Press Limited, provided the work is properly attributed. For permission for commercial use of this work, please see paragraphs 4.2 and 5 of our Terms.