")
Back to Journals » International Journal of Chronic Obstructive Pulmonary Disease » Volume 11 » Issue 1
Development of a spirometry T-score in the general population
Authors Lee SW , Kim HK , Baek S, Jung JY , Kim YS , Lee JS , Lee SD, Mannino D, Oh Y
Received 10 September 2015
Accepted for publication 7 November 2015
Published 23 February 2016 Volume 2016:11(1) Pages 369—379
DOI https://doi.org/10.2147/COPD.S96117
Checked for plagiarism Yes
Review by Single anonymous peer review
Peer reviewer comments 2
Editor who approved publication: Dr Richard Russell
Sei Won Lee,1 Hyun Kuk Kim,2 Seunghee Baek,3 Ji-Ye Jung,4 Young Sam Kim,4 Jae Seung Lee,1 Sang-Do Lee,1 David M Mannino,5 Yeon-Mok Oh1
1Department of Pulmonary and Critical Care Medicine, Clinical Research Center for Chronic Obstructive Airway Diseases, Asan Medical Center, University of Ulsan College of Medicine, Seoul, 2Department of Pulmonary and Critical Care Medicine, Haeundae Paik Hospital, Inje University College of Medicine, Busan, 3Department of Clinical Epidemiology and Biostatistics, Asan Medical Center, University of Ulsan College of Medicine, Seoul, 4Division of Pulmonary, Department of Internal Medicine, Institute of Chest Disease, Severance Hospital, Yonsei University College of Medicine, Seoul, Korea; 5Department of Preventive Medicine and Environmental Health, University of Kentucky College of Public Health, Lexington, KY, USA
Background and objective: Spirometry values may be expressed as T-scores in standard deviation units relative to a reference in a young, normal population as an analogy to the T-score for bone mineral density. This study was performed to develop the spirometry T-score.
Methods: T-scores were calculated from lambda-mu-sigma-derived Z-scores using a young, normal age reference. Three outcomes of all-cause death, respiratory death, and COPD death were evaluated in 9,101 US subjects followed for 10 years; an outcome of COPD-related health care utilization (COPD utilization) was evaluated in 1,894 Korean subjects followed for 4 years.
Results: The probability of all-cause death appeared to remain nearly zero until -1 of forced expiratory volume in 1 second (FEV1) T-score but increased steeply where FEV1 T-score reached below -2.5. Survival curves for all-cause death, respiratory death, COPD death, and COPD utilization differed significantly among the groups when stratified by FEV1 T-score (P<0.001). The adjusted hazard ratios of the FEV1 T-score for the four outcomes were 0.54 (95% confidence interval, 0.48–0.60), 0.43 (95% CI: 0.37–0.50), 0.30 (95% CI: 0.24–0.37), and 0.69 (95% CI: 0.59–0.81), respectively, adjusting for covariates (P<0.001).
Conclusion: The spirometry T-score could predict all-cause death, respiratory death, COPD death, and COPD utilization.
Keywords: spirometry, T-score, COPD
Introduction
Spirometry can indicate various lung diseases and help determine their treatment and prognosis.1 The role of spirometry values, including forced expiratory volume in 1 second (FEV1) and the ratio of FEV1 to forced vital capacity (FEV1/FVC), is well established in the diagnosis, the classification of disease severity, and the prediction of mortality for patients with COPD.2
However, the method used to define the cut-off value of airflow limitation for the diagnosis of COPD has been debated by two groups. One group suggested that the cut-off value of airflow limitation be defined by a fixed ratio (FEV1/FVC <0.70 or/and FEV1 <80% of predicted value),3 while the other group suggested that the cut-off value of airflow limitation by the lower limit of normal (FEV1/FVC or/and FEV1 less than the bottom 5% percentile of normal reference value) which has the same meaning as “the Z-score of FEV1/FVC or/and FEV1 <−1.64”.4 In addition to both of these suggestions, there is a third method used to define the cut-off value of airflow limitation, a spirometry T-score. Similar to defining the T-score of bone mineral density, spirometry T-score can be defined by the spirometry values corrected with the young age where the lung function is at peak. Older subjects are more vulnerable to, and have poorer outcomes due to respiratory diseases even though they may have the same spirometry values that are expressed in spirometry Z-score.5,6 In the present study, we hypothesized that spirometry T-score may better predict the four outcomes of all-cause death, respiratory death, COPD death, and COPD-related health care utilization (COPD utilization).
In this study, we developed the spirometry T-score. In addition, we compared the three methods of the fixed ratio, the spirometry Z-score, and T-score to answer the question as to which method has the best prediction performance for the four outcomes.
Methods
Overview
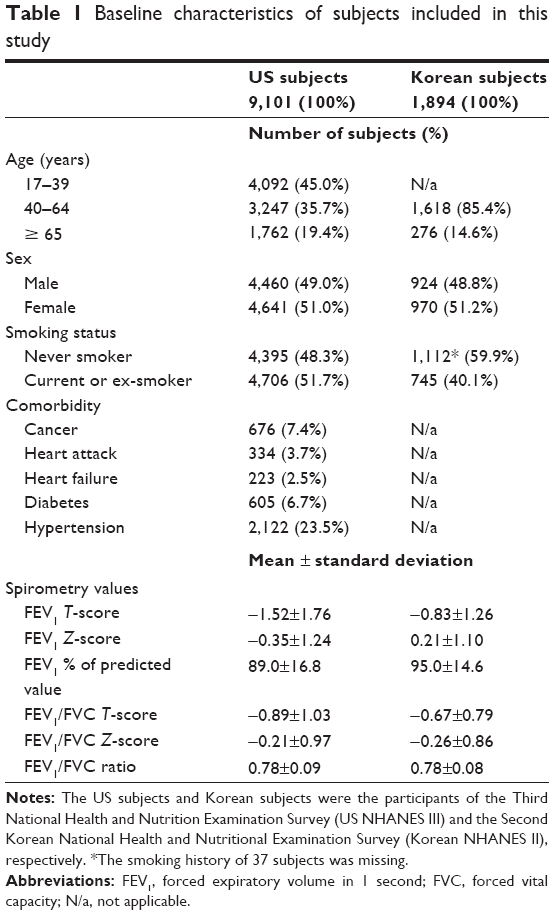
We performed this study using representative samples of the two general populations, the US and Korean. In relation to the spirometry values, the three outcomes of all-cause death, respiratory death, and COPD death were evaluated in 9,101 subjects followed for 10 years in the Third National Health and Nutrition Examination Survey (US NHANES III). The fourth outcome of COPD utilization was evaluated in 1,894 subjects followed for 4 years in the Second Korean National Health and Nutritional Examination Survey (Korean NHANES II).
Calculation of spirometry Z-scores and T-scores
We developed the spirometry T-score by analogy to the bone mineral density T-score, which is expressed in standard deviation units relative to a reference in a young, normal population.7 However, in addition to age, spirometry values are also dependent on height. Therefore, taking into consideration age and height for the development of a spirometry T-score, we used the lambda-mu-sigma (LMS) method, where spirometry values of median (mu), coefficient of variation (sigma), and skewness (lambda) were modeled.8
For the 9,101 US subjects, we calculated spirometry Z-scores and T-scores using look-up tables using a Microsoft Excel (Microsoft Corporation, Redmond, WA, USA) add-in the module, which has been developed by Stanojevic et al.9,10 The young, normal reference for FEV1 and the FEV1/FVC ratio in the US population was the value at 23 years of age in males and 22 years of age in females, which are the ages when the median FEV1 is the highest.
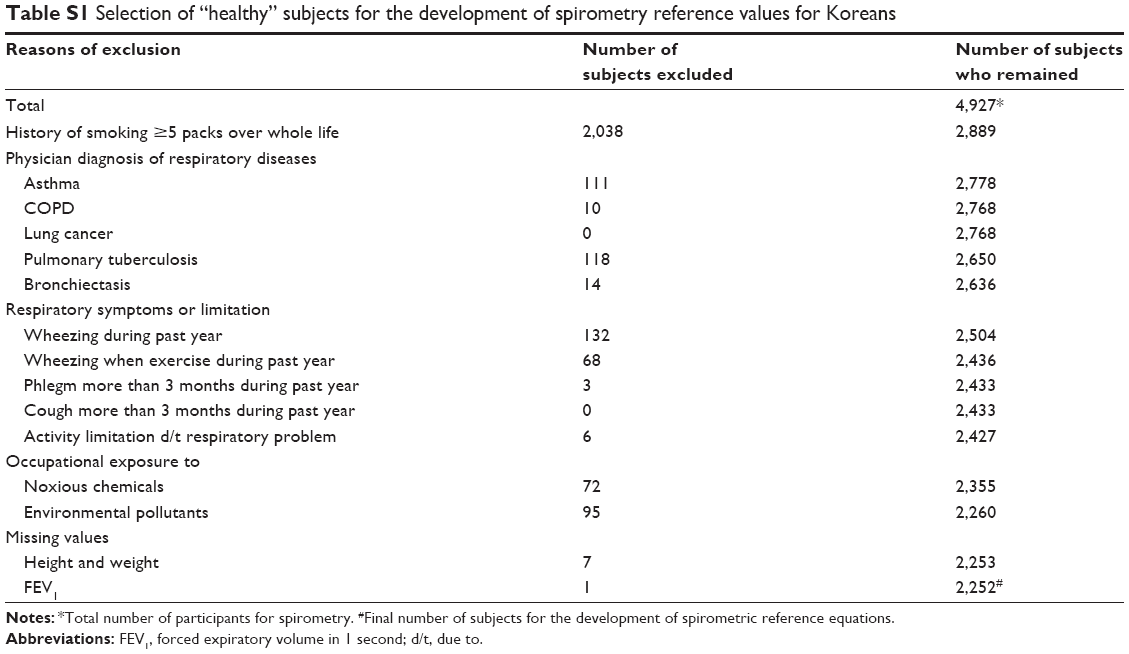
As for the 1,894 Korean subjects, we calculated spirometry Z-scores and T-scores using Korean reference equations developed with the LMS method (Table S1). The age of the young, normal reference for FEV1 and the FEV1/FVC ratio, was 19 years in males and 32 years in females for Koreans.
US NHANES III data
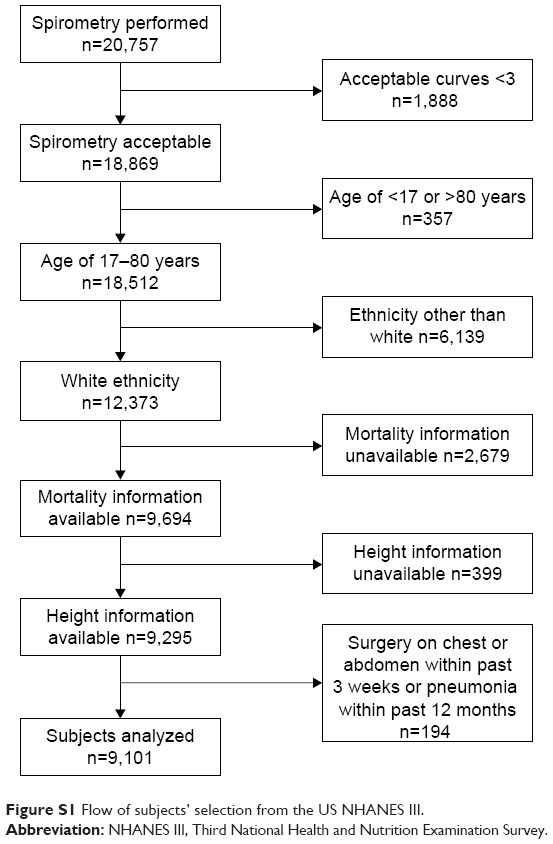
We used anonymous, publically available data of 9,101 subjects from the US NHANES III, which is a large, representative, stratified, random survey of the US population from 8 to 80 years of age.11 For this study, we used only the data of non-Hispanic white participants 17–80 years of age, who completed at least three acceptable spirometry maneuvers and also whose mortality status and height were available (Figure S1). The spirometry methods used in the US NHANES III have been described previously by Hankinson et al11 and in Centers for Disease Control and Prevention.12
All-cause death, respiratory death, and COPD death after 10 years of follow-up
The US NHANES III recorded all-cause deaths, which were ascertained from a public-use-linked mortality file that contains information based on the National Death Index. Deaths from a respiratory cause were defined by the International Classification of Diseases (ICD) J10–J98 codes; deaths from COPD were defined the ICD codes of J40–J47 (but not including the asthma codes J45 or J46).
Survival curves and hazard ratios of spirometry T-scores
The Kaplan–Meier survival curves for the groups stratified by their spirometry T-scores were calculated with the log-rank test. The stratification of groups for the Kaplan–Meier curves was determined arbitrarily, but the first level of cut-off was determined with FEV1 T-score of −2.5, below which the probability of all-cause death appeared to increase steeply (Figure 1). Hazard ratios of the spirometry T-score for death was calculated by Cox proportional hazard analysis with adjustment for age, sex, smoking history, and co-morbidity, including cancer, heart attack, heart failure, and diabetes.
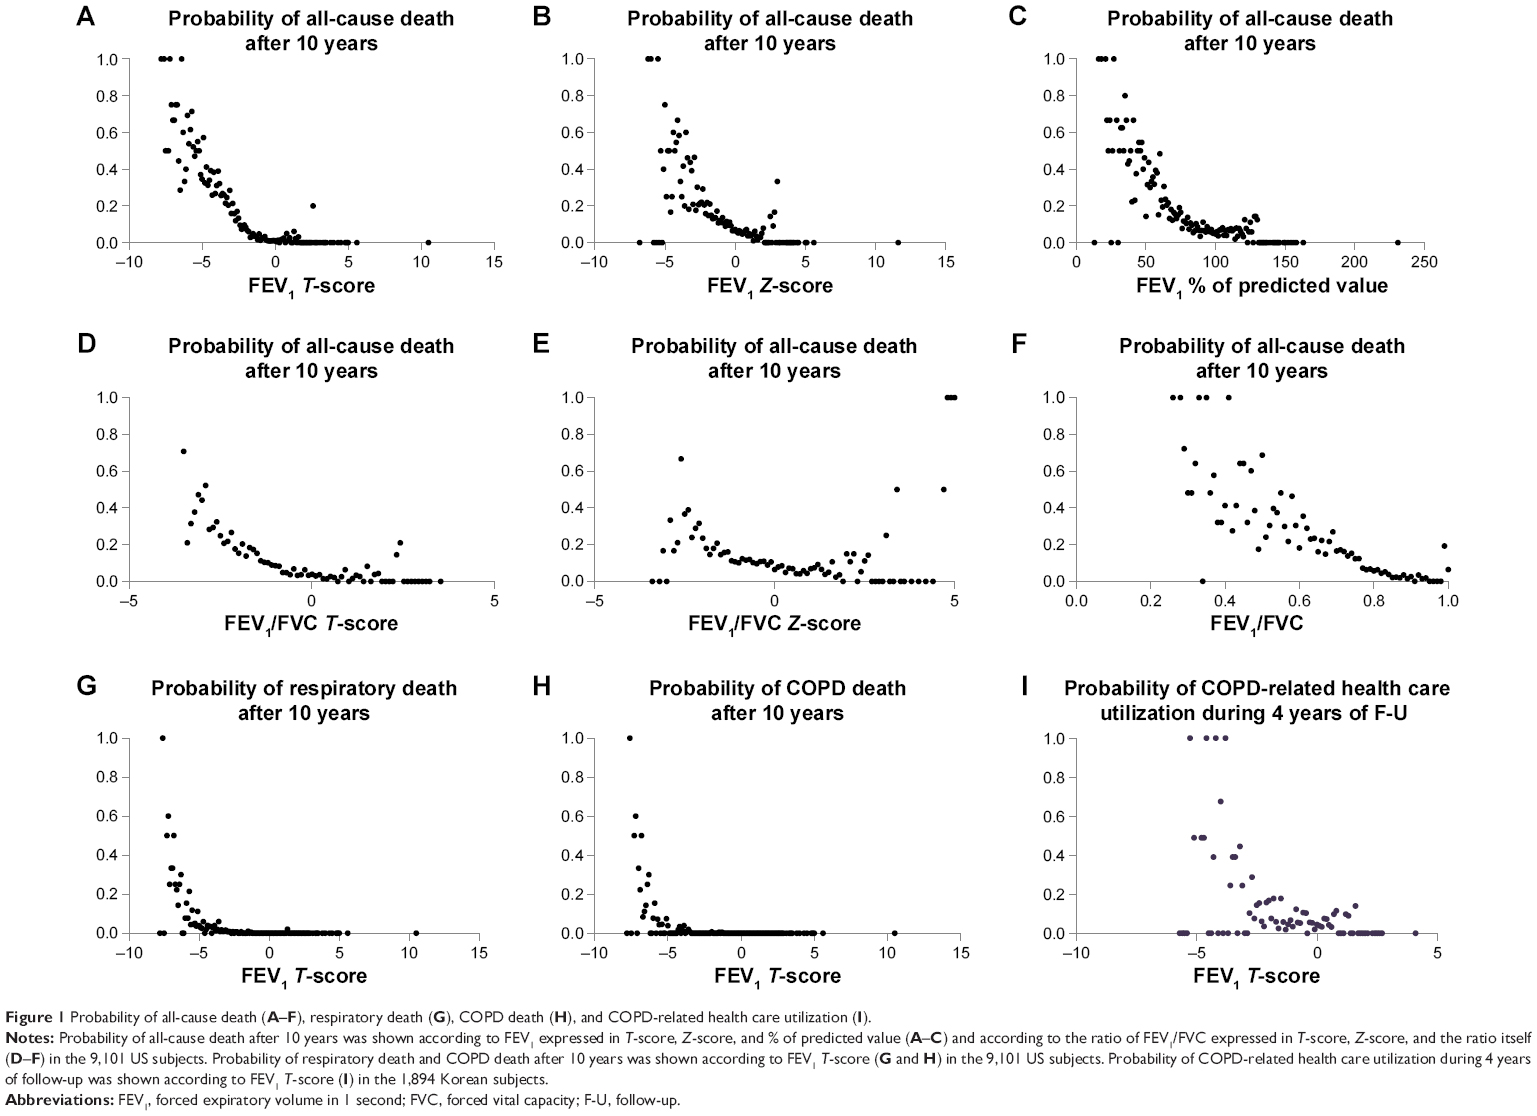 | Figure 1 Probability of all-cause death (A–F), respiratory death (G), COPD death (H), and COPD-related health care utilization (I). |
COPD utilization during 4 years of follow-up
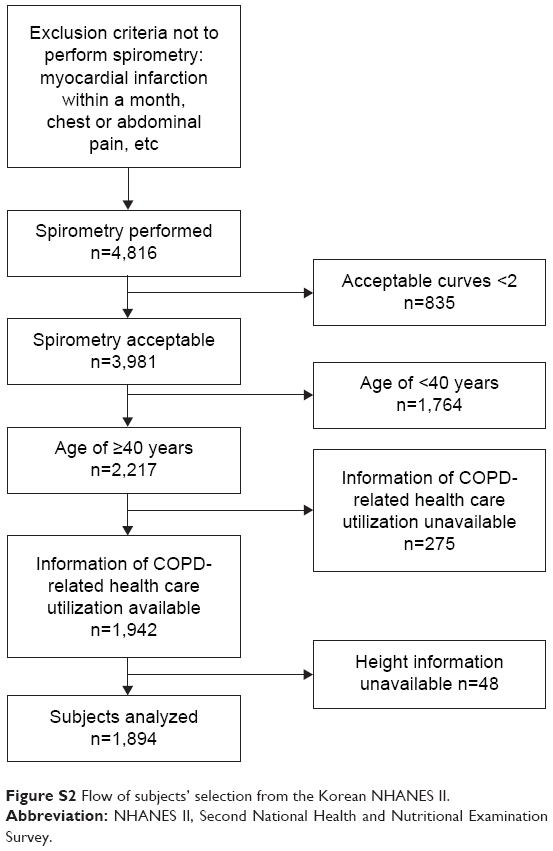
We linked the data of 1,894 subjects that were 40 years of age or older of the Korean NHANES II with the Korean National Health Insurance claims (Figure S2).13 In this study, we considered that health care utilization related to COPD occurred if a participant in KHANES II in 2001 used health care services including any procedures, tests, or treatments with a primary diagnosis of COPD between 2002 and 2005 based on data from Korean National Health Insurance claims.
Statistical analyses
Statistical analyses were performed using SPSS software, version 18.0 (SPSS Inc., Chicago, IL, USA) and SAS 9.2 (SAS Institute Inc., Cary, NC, USA). In addition, pROC in the R 2.15.2 software package for statistical computing (https://www.r-project.org) was used for Delong’s method of comparison between areas under the receiver operating characteristic (ROC) curves. To estimate Harrell’s concordance index (c-index) from each Cox proportional hazard model, the package ‘survival’ in R 2.15.2 was used. The 95% confidence intervals (CI) of the c-index were computed using bootstrapping method (repetition 200 times) with R package “boot”. The peak ages of FEV1 were selected, where the medians of FEV1 were the maximum in the reference equation models of the LMS method. A P-value of less than 0.05 was considered statistically significant.
Ethics statement
This study was approved by the institutional review board of the Asan Medical Center with the approval number of 2011-0907. The de-indentified secondary data of US NHANES III and Korean NHANES II are open to the public, and no US institutional review board approval is required.
Results
Results from the analyses of the US NHANES III
Subject characteristics of the US NHANES III
Among the 9,101 subjects, 51% were female. The mean age was 45 years and 52% had a smoking history (Table 1). Death from any cause occurred in 929 (10.2%) subjects during the 10 years of follow-up. Eighty-five subjects (0.9%) died of respiratory causes; 43 deaths (0.5%) were caused by COPD.
 | Table 1 Baseline characteristics of subjects included in this study |
Spirometry T-score for the prediction of all-cause death, respiratory, and COPD death
The probability of all-cause death, respiratory death, and COPD death during 10 years of follow-up appeared to increase steeply as FEV1 T-score decreased to negative values (Figure 1). The probability of all-cause death appeared to remain zero or nearly zero until an FEV1 T-score of approximately −1, and this increased slowly until reaching a score of approximately −2.5, after which the probability of death appeared to increase steeply (Figure 1A).
For the prediction of all-cause, respiratory, and COPD death, the prediction performance of the FEV1 T-score was higher than that of the FEV1 Z-score or the FEV1 percent of predicted value (P<0.001 for all comparisons; Figure 2A–C). As for the T-score of FEV1/FVC, the prediction performance was lower than FEV1 T-score (P<0.05 for all comparisons; Figure 2A–C and E–G).
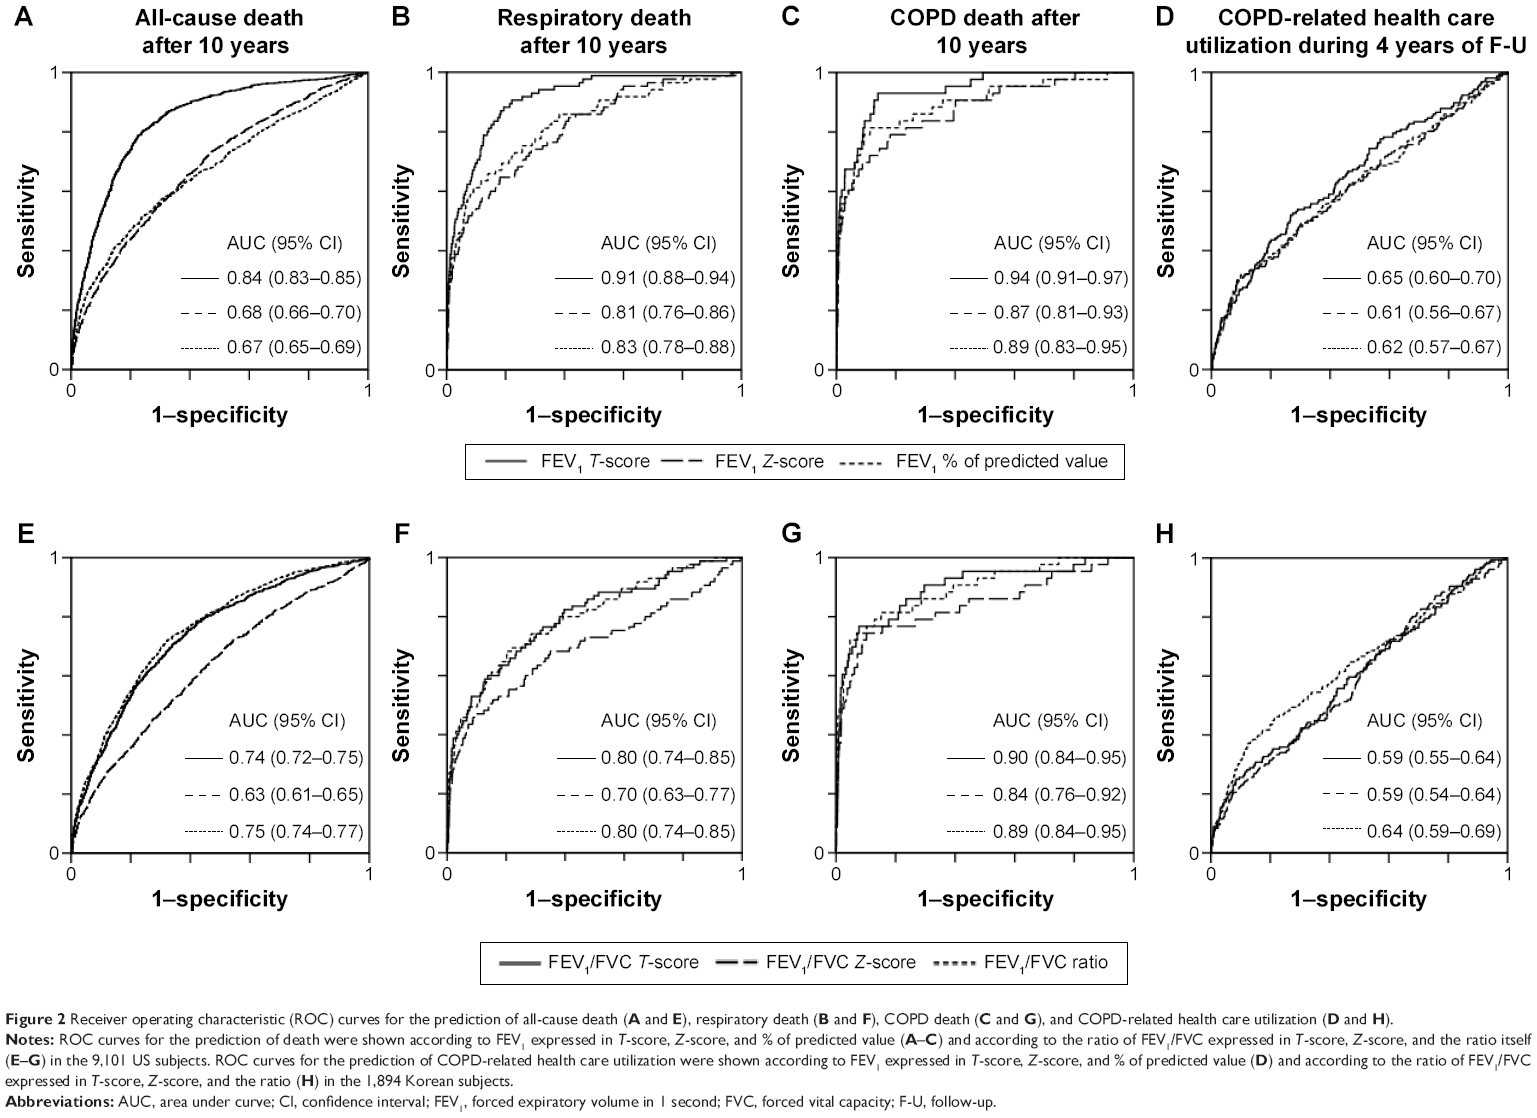 | Figure 2 Receiver operating characteristic (ROC) curves for the prediction of all-cause death (A and E), respiratory death (B and F), COPD death (C and G), and COPD-related health care utilization (D and H). |
The prediction performance of FEV1/FVC ratio itself was comparable to that of FEV1/FVC T-score for the prediction of respiratory death and COPD death (P=0.93 and 0.68, respectively; Figure 2F and G), and was even higher than that of FEV1/FVC T-score for the prediction of all-cause death (P<0.001 for both comparisons; Figure 2E). The prediction performance of the FEV1/FVC ratio was higher than that of FEV1/FVC Z-score for the prediction of all-cause death, respiratory death, COPD death, and COPD utilization (P<0.0001 for all comparisons; Figure 2E–G).
Cut-off values of spirometry T-scores for the prediction of all-cause death
The cut-off values of the FEV1 T-score that reached the maximum Youden index (sensitivity + specificity −1) for the prediction of all-cause death were −2.5 in males and −2.4 in females. The corresponding FEV1/FVC T-scores were −1.1 in males and −1.6 in females. For the prediction of 10-year all-cause death, an FEV1 T-score of −2.5 had a sensitivity of 0.78 and a specificity of 0.78, which were higher than the indices calculated using the other criteria of abnormal spirometry (Table 2).
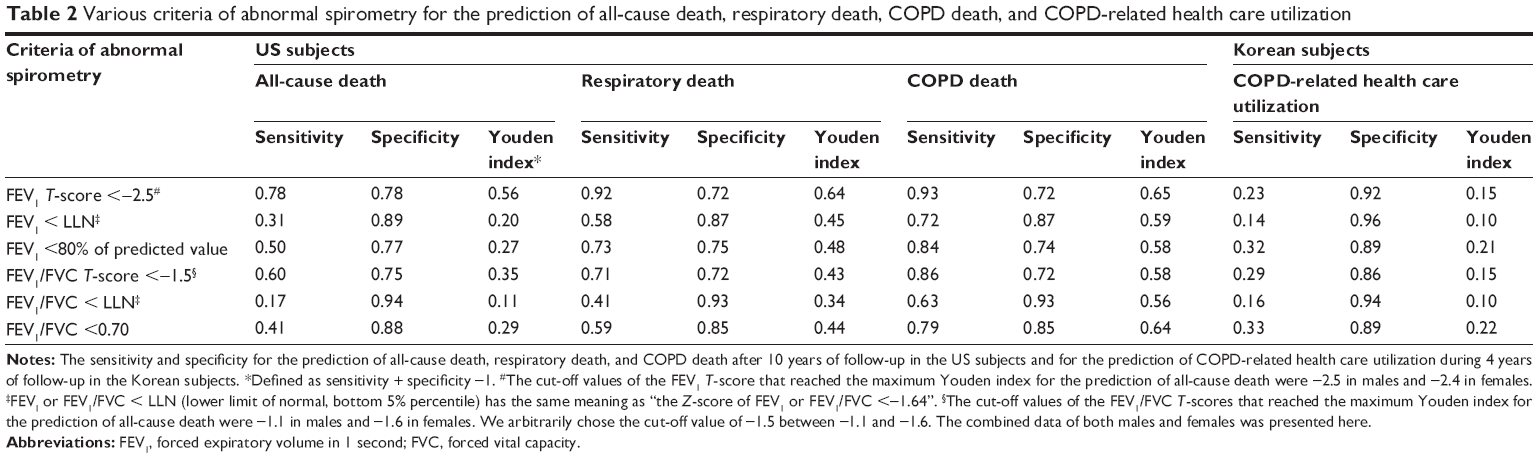 | Table 2 Various criteria of abnormal spirometry for the prediction of all-cause death, respiratory death, COPD death, and COPD-related health care utilization |
For the prediction of COPD death, the FEV1/FVC ratio with the cut-off value of 0.70 appeared to be comparable to FEV1 T-score with the cut-off value of −2.5 (Table 2).
Survival curves and hazard ratios of the FEV1 T-score
Survival curves for all-cause death, respiratory death, and COPD death differed significantly among the groups when stratified into four groups (<−4.5, −4.5 to −3.6, −3.5 to −2.6, and ≥−2.5) by FEV1 T-score (P<0.001 for all log-rank tests; Figure 3A–C).
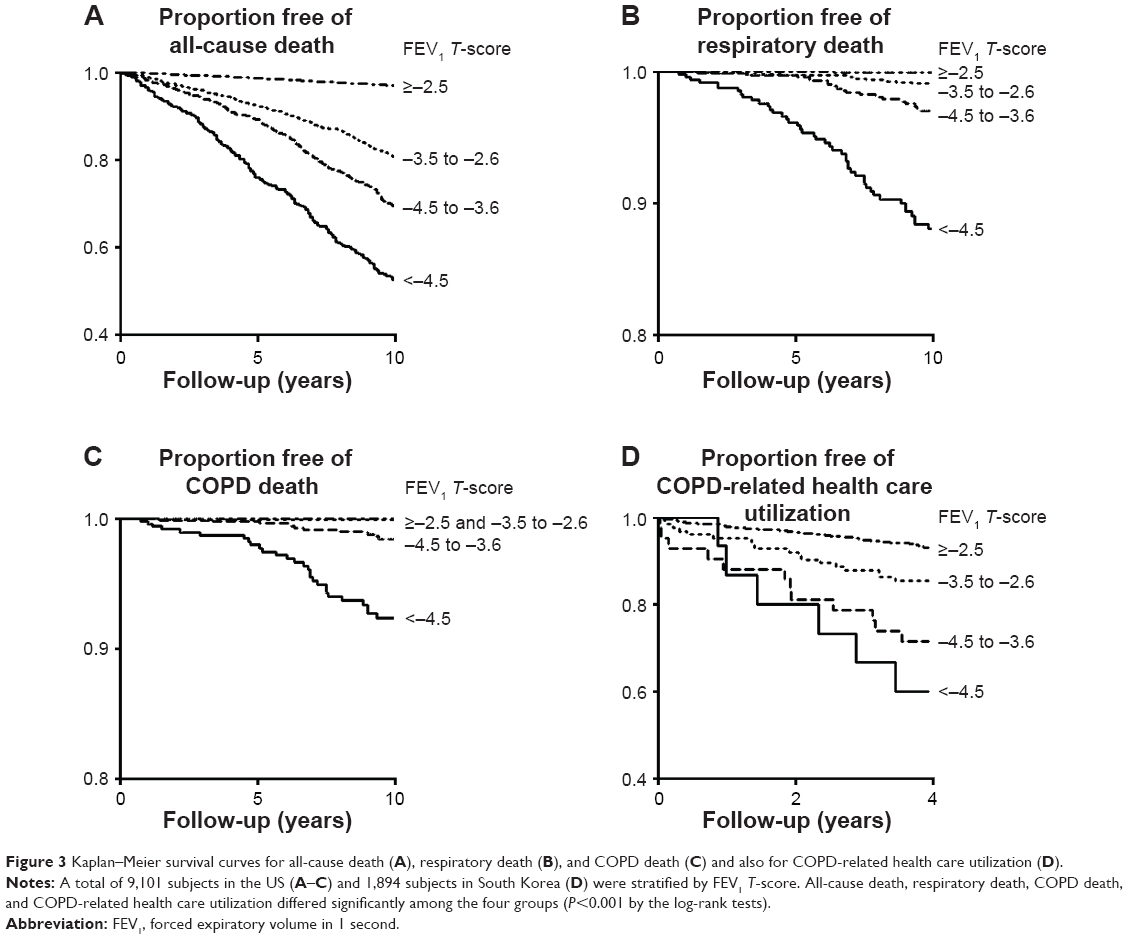 | Figure 3 Kaplan–Meier survival curves for all-cause death (A), respiratory death (B), and COPD death (C) and also for COPD-related health care utilization (D). |
The adjusted hazard ratios of the FEV1 T-score for all-cause death, respiratory death, and COPD death were 0.54 (95% CI: 0.48–0.60), 0.43 (95% CI: 0.37–0.50), and 0.30 (95% CI: 0.24–0.37), respectively, adjusting for age, sex, smoking history, and co-morbidity in the US subjects (P<0.0001 for all Cox proportional hazard analyses).
Results from the analyses of the Korean NHANES II
Subject characteristics
Among 1,894 subjects from the Korean NHANES II data, 51% were female. The mean age was 53 years, and 40% had a smoking history (Table 1). COPD utilization was observed for 156 (8.2%) subjects during 4 years of follow-up.
Spirometry T-score for the prediction of COPD utilization
The probability of COPD utilization during 4 years of follow-up increased steeply as FEV1 T-score decreased to negative values (Figure 1I).
For the prediction of COPD utilization, the prediction performance of the FEV1 T-score was higher than that of the FEV1 Z-score or the FEV1 percent of predicted value (P<0.05 for both comparisons; Figure 2D). As for the ratio of FEV1/FVC, the prediction performance was higher than that of FEV1/FVC T-score or Z-score for the prediction of COPD utilization (P<0.05 for both comparisons; Figure 2H).
As for the prediction of COPD utilization, the cut-off value of FEV1 T-score was −1.5 and this reached the maximum of Youden index (Table S2).
Survival curves and hazard ratios of the FEV1 T-score
Survival curves for COPD utilization differed significantly among the groups when stratified by FEV1 T-score (P<0.001 for log-rank test; Figure 3D). The adjusted hazard ratio of the FEV1 T-score for COPD utilization was 0.69 (95% CI: 0.59–0.81) adjusting for age, sex, amount smoked, monthly income, presence of pulmonary symptoms, and physician-diagnosed COPD in the Korean subjects (P<0.001; Cox proportional hazard analysis).
Discussion
In this study, we developed a spirometry T-score that could predict all-cause death, respiratory death, and COPD death in the US population and COPD utilization in the Korean population. This study suggests that spirometry values might also be corrected in the same way as that of the diagnosis of osteoporosis for which a young, normal reference is used to determine T-scores of bone mineral density. The rationale for using T-score might be that the age-related vulnerability should be taken into account;5,6 the rationale for Z-scores is that the age-related variability should be taken into account.
We found that the probability of all-cause death appeared to increase steeply when the FEV1 T-score decreased below approximately −2.5 (Figure 1A). We also found that the optimal cut-off values of the FEV1 T-score for the prediction of all-cause death were −2.5 in males and −2.4 in females, where the Youden index reached the maximum value. However, which cut-off value of spirometry should be chosen might be dependent on the outcome. As for the outcome of COPD utilization, the cut-off value of −1.5 in FEV1 T-score was the value where Youden index was the maximum (Table S2).
We also found that the prediction performance of FEV1/FVC ratio itself was comparable to, or even better than that of FEV1/FVC T-score, for the prediction of all-cause death, respiratory death, COPD death, and COPD utilization (Figure 2E–H). In addition, the criteria of abnormal spirometry by “FEV1/FVC <0.70” were comparable to that by “FEV1 T-score <−2.5” for the prediction of COPD death (Table 2). However, the prediction performance of FEV1/FVC Z-score did not appear to be as good as that of FEV1/FVC ratio itself or T-score. The prediction performance for COPD death had a sensitivity of 0.63 and a specificity of 0.93, with a Youden index of 0.56 given that the criterion of abnormal spirometry was an FEV1/FVC ratio less than the lower limit of normal, bottom 5% percentile (which has the same meaning as an FEV1/FVC Z-score less than −1.64) (Table 2). If the criterion FEV1/FVC <0.70 was chosen, then the sensitivity would be 0.79 and specificity 0.85, with a Youden index of 0.64. These results might support the definition of airflow limitation using the FEV1/FVC criterion of less than 0.70, suggested by the COPD clinical practice guidelines.14,15
The T-score of bone mineral density is known to reflect future fracture risk. A recent meta-analysis found that fracture risk increases by 1.5-fold to 2.6-fold for every unit decrease in standard deviation of mean bone mineral density.16 In our study, one standard deviation decrease in FEV1 T-score increased the risk of all-cause death by 1.9 times (the reciprocal of 0.54), respiratory death by 2.3 times (1/0.43), COPD death by 3.3 times (1/0.30), and COPD-related health care utilization by 1.4 times (1/0.69). Therefore, FEV1 T-scores might be comparable to T-scores of bone mineral density.
There are some limitations to discuss. First, determining cause of death is not easy or clear, so ICD disease coding might not be as accurate as assumed in this study. However, the large sample size of this study would probably overcome a coding issue. In addition, ICD disease coding has already been validated in previous studies in both US and Korean subjects.13,17 Second, to apply these study results to COPD patients, post-bronchodilator spirometry may be needed, because the clinical practice guidelines of COPD management suggest post-bronchodilator spirometry for the diagnosis and classification of COPD. Unfortunately, post-bronchodilator spirometry data are not available for the general population in the US or in Korea. The importance of post-bronchodilator spirometry may be challenged, because the clinical significance of bronchodilator responsiveness is not universally accepted.18 Third, this study included only white US and Korean participants and therefore, general application to other ethnicities can be limited. For subjects of other ethnicities, a global lung function equation developed by Quanjer et al19 may be of assistance. Finally, although Youden index is used to determine which methods are superior to others, it is not always informative. The usefulness of Youden index, also the sensitivity and specificity, are mainly determined on the setting or the goal. For example, the FEV/FVC ratio below the LLN would be better than the fixed FEV/FVC ratio in a situation where a physician would be in the clinical context of selecting patients who are not at risk of COPD.
Compared with the conventional diagnostic criteria of COPD, FEV1 T-score appears to be superior in prediction performance of important outcomes. Therefore, with the superior prediction performance of spirometry T-score, should we use it in clinical practice? Without a consensus of experts or academic societies, we should be prudent to use it in clinical practice, because a vast majority of evidences have been built with the diagnostic criteria of FEV1/FVC with a cut-off of 0.70 in research of COPD. Because this study shows that the criteria FEV1/FVC of less than 0.70 works acceptably and because spirometry T-score seems to be too complicated to develop, we suggest that the conventional diagnostic criteria of FEV1/FVC, with a cut off of 0.70, be acceptable for the diagnosis of COPD in clinical practice.
Conclusion
Spirometry T-score with the age of young, normal reference could predict all-cause death, respiratory death, COPD death, and COPD utilization.
Acknowledgments
This study was supported by a grant of the Korea Healthcare Technology R&D Project, Ministry for Health and Welfare, Republic of Korea (A102065 and HI10C2020) and the Obstructive Lung Disease Research Foundation (www.oldrf.org). This study was also supported by grants from the Asan Institute for Life Sciences (14-306).
Author contributions
Sei Won Lee: study design, the US NHANES III data analysis, choosing results, discussing the significance of results, and writing a draft of the manuscript.
Hyun Kuk Kim: study design, the Korean NHANES II data analysis, choosing results, discussing the significance of results, and writing a draft of the manuscript.
Seunghee Baek: study design, the US NHANES III and the Korean NHANES II data analysis, statistical support, choosing results, discussing the significance of results, and writing a draft of the manuscript.
Ji-Ye Jung: study design, linking the Korean NHANES II data to the data of the Korean National Health Insurance claims, discussing the significance of results, and writing a draft of the manuscript.
Young Sam Kim: study design, linking the Korean NHANES II data to the data of the Korean National Health Insurance claims, discussing the significance of results, and writing a draft of the manuscript.
Jae Seung Lee: study design, data analysis, discussing the significance of results, and writing a draft of the manuscript.
Sang-Do Lee: study design, data analysis, discussing the significance of results, and writing a draft of the manuscript.
David M Mannino: study design, data analysis, discussing the significance of results, and writing a draft of the manuscript.
Yeon-Mok Oh: study design, the US NHANES III and the Korean NHANES II data analysis, choosing results, discussing the significance of results, and writing a draft of the manuscript.
Disclosure
The authors report no conflicts of interest in this work.
References
Hegewald MJ, Crapo RO. Pulmonary function testing. In: Mason RJ, editor. Mason: Murray and Nadel’s Textbook of Respiratory Medicine. 5th ed. Philadelphia: Saunders Elsevier; 2010:522–553. | ||
Mannino DM, Buist AS, Petty TL, Enright PL, Redd SC. Lung function and mortality in the United States: data from the First National Health and Nutrition Examination Survey follow up study. Thorax. 2003;58:388–393. | ||
Mannino DM, Doherty DE, Sonia Buist A. Global Initiative on Obstructive Lung Disease (GOLD) classification of lung disease and mortality: findings from the Atherosclerosis Risk in Communities (ARIC) study. Respir Med. 2006;100:115–122. | ||
Vaz Fragoso CA, Concato J, McAvay G, et al. The ratio of FEV1 to FVC as a basis for establishing chronic obstructive pulmonary disease. Am J Respir Crit Care Med. 2010;181:446–451. | ||
Jokinen C, Heiskanen L, Juvonen H, et al. Incidence of community-acquired pneumonia in the population of four municipalities in eastern Finland. Am J Epidemiol. 1993;137:977–988. | ||
Fine MJ, Auble TE, Yealy DM, et al. A prediction rule to identify low-risk patients with community-acquired pneumonia. N Engl J Med. 1997;336:243–250. | ||
World Health Organization. Prevention and Management of Osteoporosis: Report of a WHO Scientific Group. Geneva: WHO; 2003. http://whqlibdoc.who.int/trs/who_trs_921.pdf. Accessed November 12, 2014. | ||
Cole TJ, Green PJ. Smoothing reference centile curves: the LMS method and penalized likelihood. Stat Med. 1992;11:1305–1319. | ||
Stanojevic S, Wade A, Stocks J. Reference values for lung function: past, present and future. Eur Respir J. 2010;36:12–19. | ||
Stanojevic S, Wade A, Stocks J. Become an expert in spirometry. www.growinglungs.org.uk. Accessed April 27, 2012. | ||
Hankinson JL, Odencrantz JR, Fedan KB. Spirometric reference values from a sample of the general U.S. population. Am J Respir Crit Care Med. 1999;159:179–187. | ||
Centers for Disease Control and Prevention. Third National Health and Nutrition Examination Survey (NHANES III). http://www.cdc.gov/nchs/nhanes.htm. Accessed July 22, 2013. | ||
Jung JY, Kang YA, Park MS, et al. Chronic obstructive lung disease-related health care utilisation in Korean adults with obstructive lung disease. Int J Tuberc Lung Dis. 2011;15:824–829. | ||
Qaseem A, Wilt TJ, Weinberger SE, et al. Diagnosis and management of stable chronic obstructive pulmonary disease: a clinical practice guideline update from the American College of Physicians, American College of Chest Physicians, American Thoracic Society, and European Respiratory Society. Ann Intern Med. 2011;155:179–191. | ||
Vestbo J, Hurd SS, Agusti AG, et al. Global strategy for the diagnosis, management, and prevention of chronic obstructive pulmonary disease: GOLD executive summary. Am J Respir Crit Care Med. 2013;187:347–365. | ||
Marshall D, Johnell O, Wedel H. Meta-analysis of how well measures of bone mineral density predict occurrence of osteoporotic fractures. BMJ. 1996;312:1254–1259. | ||
Holguin F, Folch E, Redd SC, Mannino DM. Comorbidity and mortality in COPD-related hospitalizations in the United States, 1979 to 2001. Chest. 2005;128:2005–2011. | ||
Soriano JB, Mannino DM. Reversing concepts on COPD irreversibility. Eur Respir J. 2008;31:695–696. | ||
Quanjer PH, Stanojevic S, Cole TJ, et al. Multi-ethnic reference values for spirometry for the 3–95-yr age range: the global lung function 2012 equations. Eur Respir J. 2012;40:1324–1343. |
Supplementary materials
 | Figure S1 Flow of subjects’ selection from the US NHANES III. |
 | Table S1 Selection of “healthy” subjects for the development of spirometry reference values for Koreans |
 | Figure S2 Flow of subjects’ selection from the Korean NHANES II. |
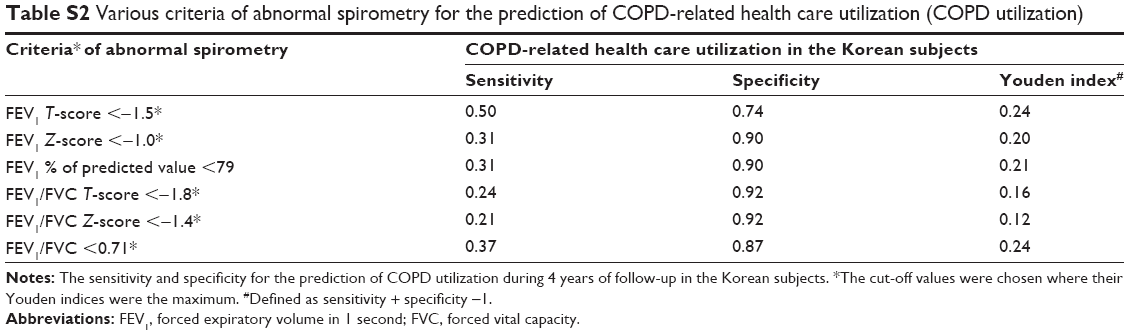 | Table S2 Various criteria of abnormal spirometry for the prediction of COPD-related health care utilization (COPD utilization) |
 © 2016 The Author(s). This work is published and licensed by Dove Medical Press Limited. The full terms of this license are available at https://www.dovepress.com/terms.php and incorporate the Creative Commons Attribution - Non Commercial (unported, v3.0) License.
By accessing the work you hereby accept the Terms. Non-commercial uses of the work are permitted without any further permission from Dove Medical Press Limited, provided the work is properly attributed. For permission for commercial use of this work, please see paragraphs 4.2 and 5 of our Terms.
© 2016 The Author(s). This work is published and licensed by Dove Medical Press Limited. The full terms of this license are available at https://www.dovepress.com/terms.php and incorporate the Creative Commons Attribution - Non Commercial (unported, v3.0) License.
By accessing the work you hereby accept the Terms. Non-commercial uses of the work are permitted without any further permission from Dove Medical Press Limited, provided the work is properly attributed. For permission for commercial use of this work, please see paragraphs 4.2 and 5 of our Terms.