")
Back to Journals » Cancer Management and Research » Volume 10
Development of a prediction model for pancreatic cancer in patients with type 2 diabetes using logistic regression and artificial neural network models
Authors Hsieh MH, Sun LM, Lin CL, Hsieh MJ, Hsu CY, Kao CH
Received 19 July 2018
Accepted for publication 30 October 2018
Published 26 November 2018 Volume 2018:10 Pages 6317—6324
DOI https://doi.org/10.2147/CMAR.S180791
Checked for plagiarism Yes
Review by Single anonymous peer review
Peer reviewer comments 2
Editor who approved publication: Dr Xueqiong Zhu
Meng Hsuen Hsieh,1,* Li-Min Sun,2,* Cheng-Li Lin,3,4 Meng-Ju Hsieh,5 Chung-Y Hsu,6 Chia-Hung Kao6–8
1Department of Electrical Engineering and Computer Sciences, University of California, Berkeley, CA, USA; 2Department of Radiation Oncology, Zuoying Branch of Kaohsiung Armed Forces General Hospital, Kaohsiung, Taiwan, Republic of China; 3Management Office for Health Data, China Medical University Hospital, Taichung, Taiwan, Republic of China; 4College of Medicine, China Medical University, Taichung, Taiwan, Republic of China; 5Department of Medicine, Poznan University of Medical Sciences, Poznan, Poland; 6Graduate Institute of Biomedical Sciences, China Medical University, Taichung, Taiwan, Republic of China; 7Department of Nuclear Medicine and PET Center, China Medical University Hospital, Taichung, Taiwan, Republic of China; 8Department of Bioinformatics and Medical Engineering, Asia University, Taichung, Taiwan, Republic of China
*These authors contributed equally to this work
Objectives: Patients with type 2 diabetes (T2DM) are suggested to have a higher risk of developing pancreatic cancer. We used two models to predict pancreatic cancer risk among patients with T2DM.
Methods: The original data used for this investigation were retrieved from the National Health Insurance Research Database of Taiwan. The prediction models included the available possible risk factors for pancreatic cancer. The data were split into training and test sets: 97.5% of the data were used as the training set and 2.5% of the data were used as the test set. Logistic regression (LR) and artificial neural network (ANN) models were implemented using Python (Version 3.7.0). The F1, precision, and recall were compared between the LR and the ANN models. The areas under the receiver operating characteristic (ROC) curves of the prediction models were also compared.
Results: The metrics used in this study indicated that the LR model more accurately predicted pancreatic cancer than the ANN model. For the LR model, the area under the ROC curve in the prediction of pancreatic cancer was 0.727, indicating a good fit.
Conclusion: Using this LR model, our results suggested that we could appropriately predict pancreatic cancer risk in patients with T2DM in Taiwan.
Keywords: pancreatic cancer, type 2 diabetes, logistic regression, artificial neural network
Study highlights
What is current knowledge?
Type 2 diabetes has a higher risk of pancreatic cancer.
What is new here?
We used logistic and ANN models to predict pancreatic cancer.
Introduction
Pancreatic cancer is one of the most lethal malignancies because its early diagnosis is difficult, and most patients have already progressed to unresectable and incurable statuses at diagnosis.1,2 According to the GLOBOCAN 2012 estimates, pancreatic cancer ranked as the 11th most common cancer and the seventh leading cause of cancer death in both genders globally in 2012.3 In Taiwan, although it is not one of the top 10 cancers, the age-adjusted incidence rate steadily increased from 4.63/100,000 persons in 2005 to 6.23/100,000 persons in 2015.4 Moreover, it was the sixth and eighth leading cause of mortality from cancer among women and men in 2016, respectively.5 Early detection and treatment are vital, considering the relatively poor survival rate compared with its incidence. Identification of the risk factors of pancreatic cancer and regular surveillance of high-risk groups may increase the opportunity of early diagnosis, which could lead to improvements in treatment outcome.
Risk factors of pancreatic cancer, namely, smoking, obesity, chronic pancreatitis, unhealthy diet, and heavy alcohol consumption, have been well documented,6–8 but some studies have suggested that patients with type 2 diabetes (T2DM) are also more likely to develop pancreatic cancer.6–12 The exact mechanisms that link this possible association have still not been fully determined. Li11 stated that insulin resistance and associated hyperglycemia, hyperinsulinemia, and inflammation may play a role in the underlying mechanisms, thereby contributing to the development of diabetes-associated pancreatic cancer.
In this study, we used data from the National Health Insurance Research Database (NHIRD) of Taiwan and attempted to create a suitable model to help physicians evaluate and predict the risk of development of pancreatic cancer in patients with T2DM. Logistic regression (LR) and artificial neural network (ANN) models have been used to predict medical outcomes.13,14 This study aims to compare the effectiveness of LR and ANN models in predicting the development of pancreatic cancer.
Methods
Data source
The study cohort was selected from the Longitudinal Cohort of Diabetes Patients (LHDB) of the National Health Insurance (NHI) program. The database is anonymized. The LHDB comprises data of 1,700,000 randomly selected newly diagnosed T2DM (ICD-9 code 250.x0 and 250.x2) patients with longitudinally linked data available from 1997 to 2013. Patients who had at least two diagnoses of T2DM within a year were eligible for inclusion in the LHDB. Diseases in the claims data were coded using the ICD, ninth revision, clinical modification (ICD-9-CM). The study was approved by the Research Ethics Committee of China Medical University and Hospital in Taiwan (CMUH104-REC2-115-CR3).
Participants
Patients with newly diagnosed T2DM were identified from the period of 2000 to 2012 from the data set of the LHDB. The first diagnosis date was defined as the index date of T2DM. T2DM patients with a history of pancreatic cancer (ICD-9 code 157) before the index date, aged <20 years, or with incomplete demographic information were excluded.
Comorbidities and medications
The baseline comorbidities considered in this study were acute pancreatitis, chronic pancreatitis, alcohol-related illness, gallstone, cholecystectomy, cirrhosis, COPD, Helicobacter pylori infection, hepatitis B, hepatitis C, hypertension, hyperlipidemia, nephropathy, and obesity. The Charlson comorbidity index (CCI) was also determined for each participant from claims data of outpatient visits or hospitalizations before the index date. The CCI is a scoring system that weighs factors on crucial concomitant diseases; it has been validated for use with the ICD-9-CM-coded administrative database.15,16 We categorized CCI into the following four levels: 0, 1, 2, and 3 or more. To measure the severity of T2DM, we used the adapted Diabetes Complication Severity Index (aDCSI).17 The aDCSI had seven categories, namely, retinopathy, nephropathy, neuropathy, cerebrovascular, cardiovascular, peripheral vascular disease, and metabolic. The progression of diabetes was defined as a yearly increase in aDCSI score from the date of T2DM diagnosis to the end of follow-up. Three progression groups were defined as having a yearly increase in scores less than 0–0.1, 0.1–0.3, and >0.3 per year. Medications that may be associated with pancreatic cancer were also evaluated, including statin and antidiabetic drugs. Antidiabetic drugs included insulin, sulfonylureas, metformin, and thiazolidinediones and other antidiabetic drugs.
Constructing training and data sets
The data comprised 1,358,634 data points, each of which represented one patient. The data were cleaned and one-hot encoded using RStudio. After data cleaning, 22 input features and two output features were obtained. The features included patient’s age, underlying diseases, aDCSI score, and medications. The positive output class represented diagnosis of pancreatic cancer, whereas the negative output class represented no diagnosis. The data were split into training and test sets: 97.5% of the data were used as the training set and 2.5% of the data were used as the test set. Table 1 presents the allocation between the two data sets.
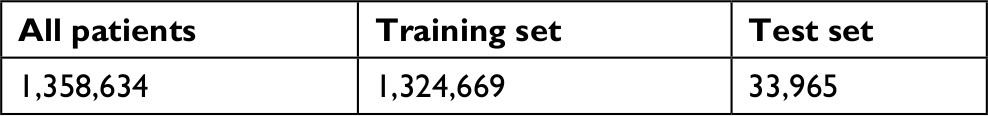 | Table 1 Distribution of train and test sets |
Algorithm and training
The average k-fold cross-validation accuracy, with a k-value of 10, was used as the metric to determine the optimal hyperparameters for the prediction models. The LR model used an L2 regularization penalty with primal formulation. The LIBLINEAR algorithm was used for the optimization problem.18 The one-versus-rest scheme was used as the loss function. The LR model was trained for 100 iterations before convergence. The ANN model was a multilayer perceptron deep neural network. The model consisted of an input layer of 22 dimensions, two hidden layers of 22 dimensions, and an output layer of two dimensions. The model was trained using the stochastic gradient descent, with a mini batch size of 1. The model was optimized using Adam with the default parameters outlined by Kingma et al, with a learning rate of 0.01, the b1 value of 0.9, the b2 value of 0.999, and no decay rate.19 The input and hidden layers used a scaled exponential linear unit activation function,20 and the output layer used the Softmax activation function. Dropout of 20% was applied at the input layer and 50% at the output layer.21 The categorical cross entropy function was used as the loss function. The neuron weights were initialized using normalized He initialization.22 The ANN model was trained for 3,600 epochs.
Nondiagnosis of pancreatic cancer was prevalent in the output data. The ratio between patients with and without pancreatic cancer was 1:438.40. For the LR and ANN models, each data point in the positive class was weighted as 438.40 times greater than each data point in the negative class to ensure that the output of the prediction was not unbalanced.
The software was implemented using Python (version 3.7.0). The LR model was created and trained with the scikit-learn library (version 0.19.1)23 and trained on an Intel Core i5 CPU. The ANN model was created and trained with the Tensorflow framework (version 1.8.0)24 on an NVIDIA® Tesla K80 graphics processing unit through Google Cloud.
Statistical analyses
The baseline characteristics, comorbidities, and medications of the pancreatic cancer group and nonpancreatic cancer group were compared. The Chi-squared test and Student’s t-test were used to test the differences of categorical and continuous variables, respectively. All risk factors outlined in Table 2 were included in the model.
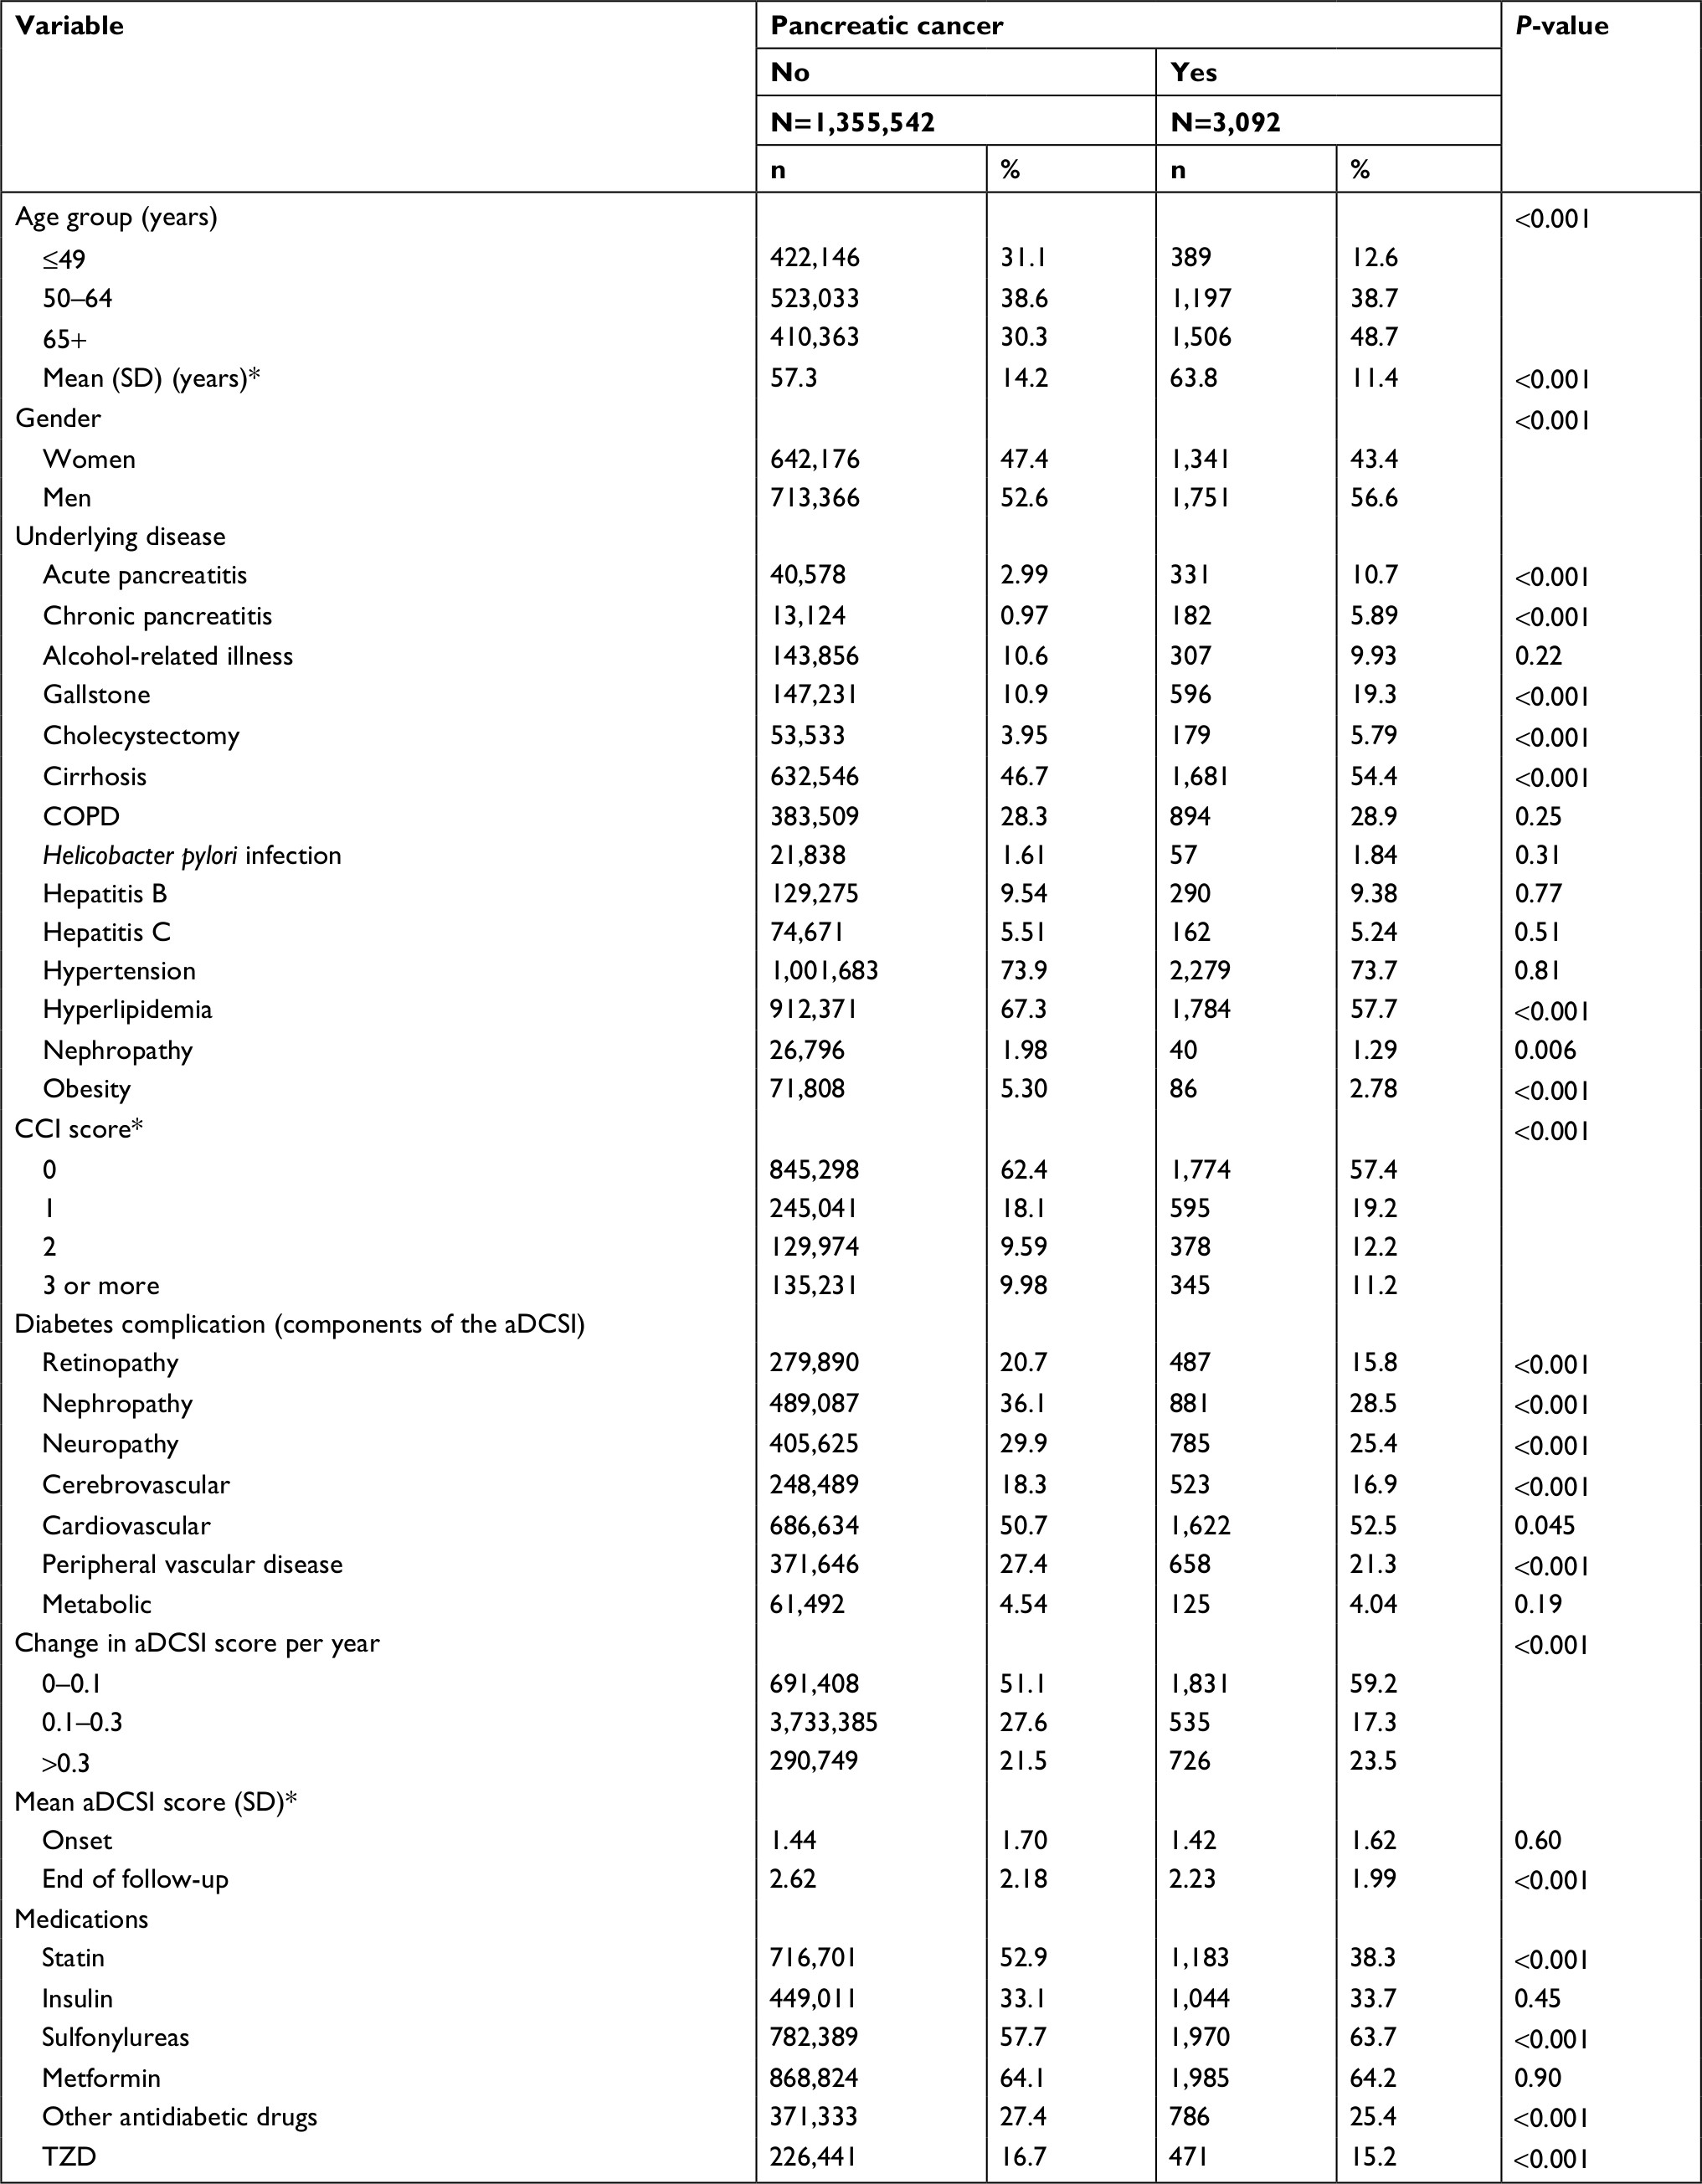 | Table 2 Baseline characteristics of T2DM patients with and without pancreatic cancer Notes: Chi-squared test. *t-Test comparing subjects with and without pancreatic cancer. Abbreviations: aDCSI, adapted Diabetes Complication Severity Index; CCI, Charlson comorbidity index; T2DM, type 2 diabetes; TZD, thiazolidinediones. |
We used the weighted average recall (sensitivity), precision (positive predictive value), and F1 (harmonic mean of recall and precision) values to evaluate the predictor performance instead of accuracy due to an unbalanced data distribution.25 The F1, precision, and recall values were calculated for the test set and for all data using the scikit-learn library. In addition, the receiver operating characteristic (ROC) curve was used as a metric to measure predictor performance. The ROC was calculated between the outcome and the predicted probability of outcome by the prediction model.
The F1, precision, and recall, and area under the ROC curve were compared between the LR and ANN models. The area under the ROC curve of both prediction models was also compared with the ideal value of 1.26
Results
Demographic features of patients
Overall, 1,358,634 participants were selected for this retrospective cohort study, including 3,092 pancreatic cancer patients and 1,355,542 nonpancreatic cancer patients (Table 2). The age distribution was different in both groups, with the mean age higher in the pancreatic cancer group than in the nonpancreatic cancer group (63.8 [SD=11.4] vs 57.3 [SD=14.2] years). Compared with the nonpancreatic cancer group, the patients with pancreatic cancer had more prevalent comorbidities, including acute pancreatitis, chronic pancreatitis, gallstone, cholecystectomy, and cirrhosis. The proportion of those with a CCI score of 3 or above was 11.2% in the pancreatic cancer group compared with 9.98% in the nonpancreatic cancer group. The major T2DM-related complications (namely retinopathy, nephropathy, neuropathy, cerebrovascular, and peripheral vascular disease) were more prevalent in the nonpancreatic cancer group than in the pancreatic cancer group. The mean aDCSI score was 2.23 (SD =1.99) in the pancreatic cancer group and 2.62 (SD=2.18) in the nonpancreatic cancer group. The mean follow-up periods were 3.84 (SD=3.44) years in the pancreatic cancer group and 6.87 (SD=3.87) years in the nonpancreatic cancer group.
Evaluation of predictor performance
The F1, precision, and recall values of the LR and ANN models across all data are outlined in Table 3. The F1 and recall values of the LR model were greater than all of those of the ANN model, whereas the precision values of the ANN model were greater than those of the LR model across all the data. The weighted k-fold cross-validation accuracies (k=10) of the LR and ANN models were 0.996 and 0.907, respectively.
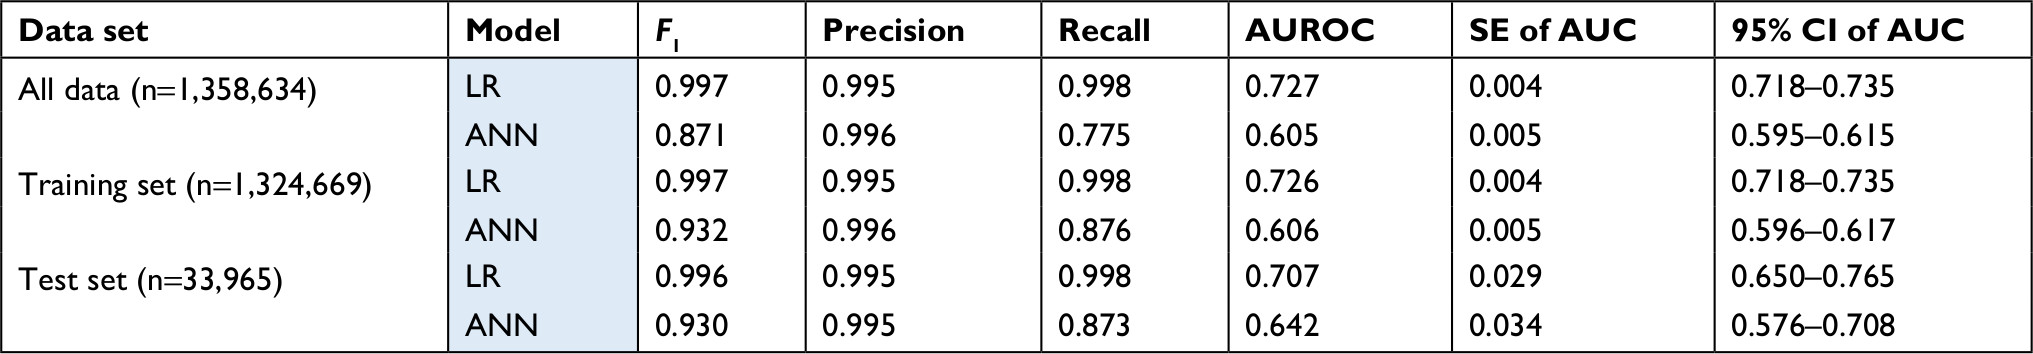 | Table 3 Accuracy analysis of LR and ANN models across all data set Abbreviations: ANN, artificial neural network; AUROC, area under the receiver operating characteristic curve; LR, logistic regression; SE, standard error; AUC, area under the curve. |
Figures 1 and 2 present the ROC curves of the LR and ANN models, respectively. The area under the ROC curve across all data for the LR and ANN models were 0.727 (95% CI: 0.718–0.735, standard error [SE]: 0.004) and 0.605 (95% CI: 0.595–0.615, SE: 0.05), respectively. The areas under ROC curves of both prediction models were significantly better than the null hypothesis area of 0.5. The area under the ROC curve of the LR model was significantly greater than the area under the ROC curve of the ANN model.
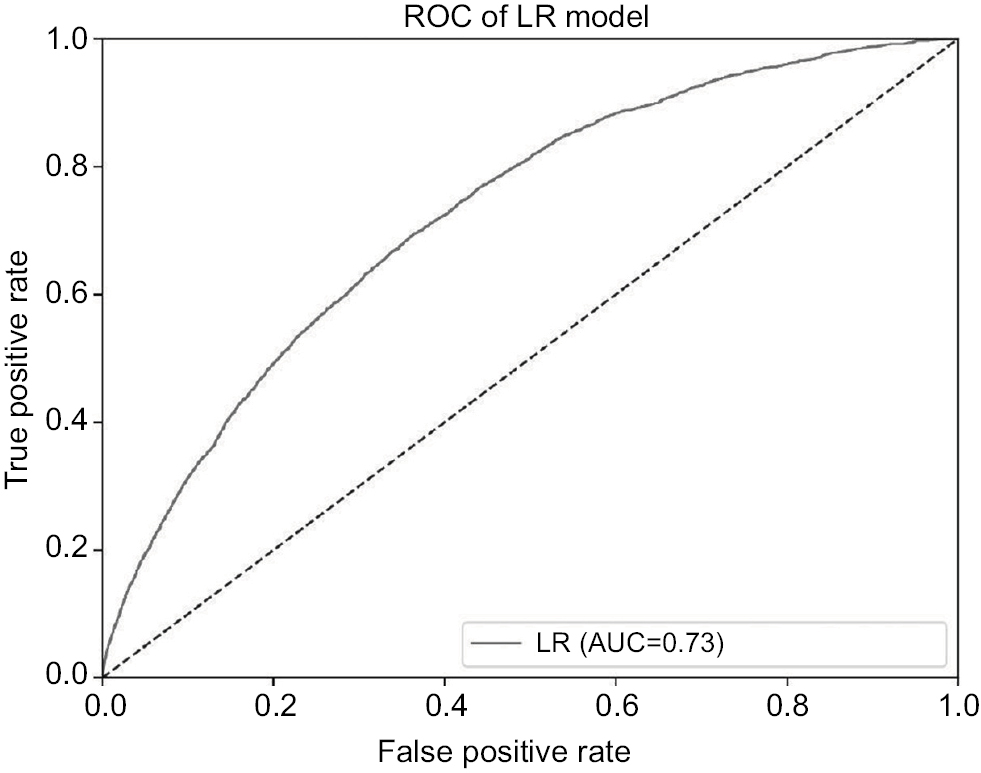 | Figure 1 The ROC curve of the LR model. Note: The AUC across all data for the LR model is 0.727. Abbreviations: AUC, area under the ROC curve; LR, logistic regression; ROC, receiver operating characteristic. |
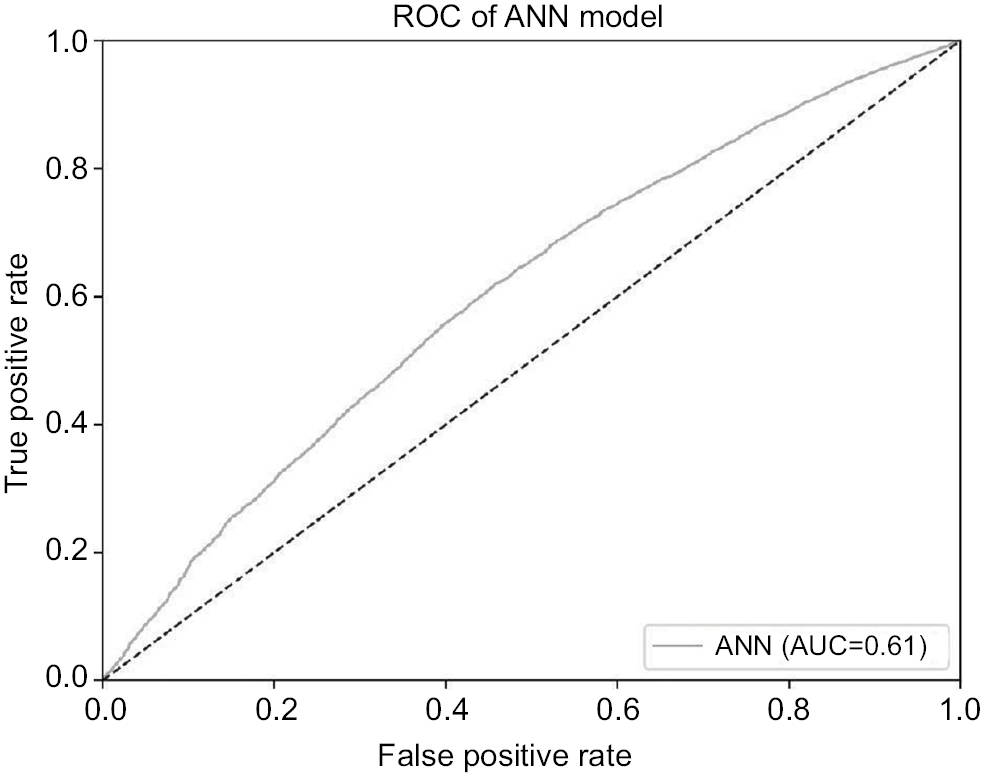 | Figure 2 The ROC curve of the ANN model. Note: The AUC curve across all data for the ANN model is 0.605. Abbreviations: ANN, artificial neural network; AUC, area under the ROC curve; ROC, receiver operating characteristic. |
Discussion
In this study, we created two models to predict the risk of developing pancreatic cancer among patients with T2DM in Taiwan. The metrics used in this study indicated that the LR model achieved superior results to the ANN model in the prediction of pancreatic cancer.
Studies have suggested that patients with T2DM possess an elevated risk of developing pancreatic cancer.6–12 In Taiwan, researchers used a traditional Cox proportional hazard model and the NHIRD to evaluate the pancreatic cancer risk among patients with T2DM and antidiabetic therapies and revealed a positive association;27–30 however, Tseng31 indicated that this relationship was likely due to detection bias and confounders. Based on changes in glucose level, changes in weight, and age at the onset of diabetes, Sharma et al32 developed a model to determine the risk of pancreatic cancer among patients with new-onset diabetes. The current study attempted to use predictive models to evaluate their possible linkage. ANN is a mathematical model imitating the structure and function of a biological neural network and is used to evaluate functions or approximate operations. It is the most commonly used “model” of artificial intelligence and can be used for prediction, forecasting, diagnosis, and decision making.33,34 By using the NHIRD, researchers have revealed that ANN is a suitable model to predict some diseases.34,35 However, our results indicated that the area under the ROC curve across all data for the ANN model was only 0.605; by contrast, the LR model achieved a superior performance in predicting pancreatic cancer in patients with T2DM. Furthermore, the F1 and recall values also indicated that the LR model was superior. LR may be used to predict the risk of developing a given disease as well. The outcome can be binomial, ordinal, or multinomial. Steyerberg et al13 suggested that LR analysis can be used to develop a statistical model for a binary outcome. As most of our variables were categorical, LR was a suitable choice for modeling. However, Tu14 suggested that although neural networks generally have an accurate predictor performance, the performance of prediction models depends upon the characteristics of the data set. One characteristic of the current data set was that its outcome distribution was asymmetric. As a result, the prediction model may have overfitted the data, which could be solved by adding regularization to the model. In the present study, although the LR model outperformed the ANN model in the area under the ROC curve, F1 value, and recall value, only the precision value of the ANN model was higher than that of the LR model. This suggested that the ANN model may have overfitted the data despite dropout regularization and class weighting. Ayer et al36 noted that ANNs are particularly useful when implicit interactions and complex relationships exist in the data, whereas LR models are the superior choice when statistical inferences must be drawn from the outputted data.
To our knowledge, this is the first national population-based study that used LR and ANN models to predict the risk of pancreatic cancer in patients with T2DM. This study was based on a nationwide representative sample, which increased its generalizability. In addition, the diagnoses of T2DM and pancreatic cancer were highly reliable because all the NHI claims were scrutinized by medical reimbursement specialists and peer reviewed to prevent errors and overutilization of medical resources. However, several limitations must still be addressed before the results are interpreted. First, we used outpatient and inpatient records of the ICD-9 code diagnosis of pancreatic cancer and defined patients with at least five consensus diagnoses to ensure the validity of diagnosis. We do not have the information in regard to the registry for catastrophic illness patients file and the registry for drug prescriptions file to maximize the accuracy of diagnosis of the pancreatic cancer. However, the reimbursement policy of NHIRD is universal and operated by a single buyer, the government in Taiwan. All the NHI claims were scrutinized by medical reimbursement specialists and peer reviewed to prevent errors and overutilization of medical resources, and medical providers face administrative sanction and high financial penalties if diagnostic claims do not agree with the standard diagnostic criteria used for medical reimbursement. Therefore, the diagnosed validity of “pancreatic cancer” based on ICD-9 codes in this study is highly reliable. In addition, some related studies with the same diagnostic method and criteria by ICD-9 coding were already been published.27,29,30 Second, unlike the traditional Cox proportional hazard model, our predictive models could not provide valued levels (95% CIs and P-values) to assess the overall statistical significance of the predictions made by the prediction models. Instead, we used recall, precision, F1, and area under the ROC as metrics to evaluate the performance of the prediction models. Third, certain health-related behaviors such as smoking and drinking alcohol have been suggested to increase the risk of pancreatic cancer6–8; however, the NHIRD did not contain any information regarding this. Therefore, we cannot confirm if adding these factors might have improved the values of the metrics or the ROC curves for the prediction models. Instead, we used alcohol-related illness to decrease the effect of alcohol in possible associations. Fourth, some undetermined factors, such as family history of pancreatic cancer, diet, and physical exercise, which may be related to pancreatic cancer,7,8 were also unavailable in the NHIRD for data extraction. We could not control these factors in the analyses either. Finally, the prediction models in this study did not take into account time series information, which means that we did not track the progression of particular subjects over time. We only considered individual subject data from 2000 to 2012.
Conclusion
This study compared models for the prediction of pancreatic cancer risk in patients with T2DM. Our analysis indicated that the LR model rather than ANN model provided a more appropriate method for predicting pancreatic cancer in patients with T2DM in Taiwan. Our findings may increase the prognosis of pancreatic cancer through surveillance, early diagnosis, and treatment in people with certain risk factors. Further investigations from other countries are required to determine if our findings are applicable elsewhere.
Abbreviations
ANN, artificial neural network; ICD-9-CM, ICD, ninth revision, clinical modification; LR, logistic regression; NHIRD, National Health Insurance Research Database; T2DM, type 2 diabetes
Acknowledgments
This work was supported by grants from the Ministry of Health and Welfare, Taiwan (MOHW107-TDU-B-212-123004), China Medical University Hospital (DMR-107-192), Academia Sinica Stroke Biosignature Project (BM10701010021), MOST Clinical Trial Consortium for Stroke (MOST 107-2321-B-039 -004-), Tseng-Lien Lin Foundation, Taichung, Taiwan, and Katsuzo and Kiyo Aoshima Memorial Funds, Japan. The funders had no role in the study design, data collection and analysis, decision to publish, or preparation of the manuscript. No additional external funding was received for this study.
Author contributions
All authors have contributed significantly, and all authors are in agreement with the content of the manuscript. MHH, LMS, and CHK contributed to the conception/design. CHK contributed to the provision of study materials. All authors contributed to data analysis, drafting or revising the article, gave final approval of the version to be published, and agree to be accountable for all aspects of the work.
Disclosure
The authors report no conflicts of interest in this work.
References
Stathopoulos GP, Androulakis N, Souglakos J, Stathopoulos J, Georgoulias V. Present treatment and future expectations in advanced pancreatic cancer. Anticancer Res. 2008;28(2B):1303–1308. | ||
Yousaf U, Christensen ML, Engholm G, Storm HH. Suicides among Danish cancer patients 1971–1999. Br J Cancer. 2005;92(6):995–1000. | ||
Ilic M, Ilic I. Epidemiology of pancreatic cancer. World J Gastroenterol. 2016;22(44):9694–9705. | ||
Cancer Statistics [homepage on the Internet]. Cancer Incidence Trends. Taiwan Cancer Registry. Available from: http://tcr.cph.ntu.edu.tw/main.php?Page=A5B2. Accessed July 8, 2018. | ||
Cancer Statistics Annual Report [homepage on the Internet]. Taiwan Cancer Registry. Available from: http://tcr.cph.ntu.edu.tw/main.php?Page=N2. Accessed July 8, 2018. | ||
Pandol S, Gukovskaya A, Edderkaoui M, et al. Epidemiology, risk factors, and the promotion of pancreatic cancer: role of the stellate cell. J Gastroenterol Hepatol. 2012;27(Suppl 2):127–134. | ||
Becker AE, Hernandez YG, Frucht H, Lucas AL. Pancreatic ductal adenocarcinoma: risk factors, screening, and early detection. World J Gastroenterol. 2014;20(32):11182–11198. | ||
Hassan MM, Bondy ML, Wolff RA, et al. Risk factors for pancreatic cancer: case-control study. Am J Gastroenterol. 2007;102(12):2696–2707. | ||
Carreras-Torres R, Johansson M, Gaborieau V, et al. The role of obesity, type 2 diabetes, and metabolic factors in pancreatic cancer: a Mendelian randomization study. J Natl Cancer Inst. 2017;109(9). | ||
Makhoul I, Yacoub A, Siegel E. Type 2 diabetes mellitus is associated with increased risk of pancreatic cancer: a veteran administration registry study. SAGE Open Med. 2016;4:205031211668225. | ||
Li D. Diabetes and pancreatic cancer. Mol Carcinog. 2012;51(1):64–74. | ||
Song S, Wang B, Zhang X, et al. Long-term diabetes mellitus is associated with an increased risk of pancreatic cancer: a meta-analysis. PLoS One. 2015;10(7):e0134321. | ||
Steyerberg EW, Eijkemans MJ, Harrell FE, Habbema JD. Prognostic modelling with logistic regression analysis: a comparison of selection and estimation methods in small data sets. Stat Med. 2000;19(8):1059–1079. | ||
Tu JV. Advantages and disadvantages of using artificial neural networks versus logistic regression for predicting medical outcomes. J Clin Epidemiol. 1996;49(11):1225–1231. | ||
Charlson ME, Pompei P, Ales KL, Mackenzie CR. A new method of classifying prognostic comorbidity in longitudinal studies: development and validation. J Chronic Dis. 1987;40(5):373–383. | ||
Deyo RA, Cherkin DC, Ciol MA. Adapting a clinical comorbidity index for use with ICD-9-CM administrative databases. J Clin Epidemiol. 1992;45(6):613–619. | ||
Young BA, Lin E, von Korff M, et al. Diabetes complications severity index and risk of mortality, hospitalization, and healthcare utilization. Am J Manag Care. 2008;14(1):15–23. | ||
Fan RE, Chang KW, Hsieh CJ, et al. LIBLINEAR: a library for large linear classification. J Mach Learn Res. 2008;9:1871–1874. | ||
Kingma DP, Ba LJ. Adam: A method for stochastic optimization. 3rd International Conference for Learning Representations. May 7–9, 2015; San Diego, CA. | ||
Klambauer G, Unterthiner T, Mayt A, et al. Self-normalizing neural networks. Advances in Neural Information Processing Systems. 2017;971–980. | ||
Srivastava N, Hinton G, Krizhevsky A. Dropout: a simple way to prevent neural networks from overfitting. J Mach Learn Res 2014;15:1929–1958. | ||
He K, Zhang X, Ren S, et al. Delving deep into rectifiers: surpassing human-level performance on imagenet classification. Proceedings of the IEEE International Conference on Computer Vision. 2015;1026–1034. | ||
Pedregosa F, Varoquaux G, Gramfort A. Scikit-learn: machine learning in python. J Mach Learn Res. 2011;12:2825–2830. | ||
Abadi M, Barham P, Chen J. et al. TensorFlow: a system for large-scale machine learning. 12th USENIX Symposium on Operating Systems Design and Implementation (OSDI’16); November 2–4, 2016 Savannah, GA, USA, 265–283. | ||
He H, Garcia EA. Learning from imbalanced data. IEEE Trans Knowl Data Eng. 2009;21:1263–1284. | ||
Hanley JA, Mcneil BJ. The meaning and use of the area under a receiver operating characteristic (ROC) curve. Radiology. 1982;143(1):29–36. | ||
Liao KF, Lai SW, Li CI, Chen WC, Ci L. Diabetes mellitus correlates with increased risk of pancreatic cancer: a population-based cohort study in Taiwan. J Gastroenterol Hepatol. 2012;27(4):709–713. | ||
Er KC, Hsu CY, Lee YK, Huang MY, Su YC. Effect of glycemic control on the risk of pancreatic cancer: a nationwide cohort study. Medicine. 2016;95(24):e3921. | ||
Chen MJ, Tsan YT, Liou JM, et al. Statins and the risk of pancreatic cancer in Type 2 diabetic patients: a population-based cohort study. Int J Cancer. 2016;138(3):594–603. | ||
Kao CH, Sun LM, Chen PC, et al. A population-based cohort study in Taiwan: use of insulin sensitizers can decrease cancer risk in diabetic patients? Ann Oncol. 2013;24(2):523–530. | ||
Tseng CH. New-onset diabetes with a history of dyslipidemia predicts pancreatic cancer. Pancreas. 2013;42(1):42–48. | ||
Sharma A, Kandlakunta H, Nagpal SJS, et al. Model to determine risk of pancreatic cancer in patients with new-onset diabetes. Gastroenterology. 2018;155(3):730–739. | ||
Ahmed FE. Artificial neural networks for diagnosis and survival prediction in colon cancer. Mol Cancer. 2005;4:29. | ||
Cheng CA, Chiu HW. An artificial neural network model for the evaluation of carotid artery stenting prognosis using a national-wide database. Conf Proc IEEE Eng Med Biol Soc. 2017;2017:2566–2569. | ||
Rau HH, Hsu CY, Lin YA, et al. Development of a web-based liver cancer prediction model for type II diabetes patients by using an artificial neural network. Comput Methods Programs Biomed. 2016;125:58–65. | ||
Ayer T, Chhatwal J, Alagoz O, et al. Informatics in radiology: comparison of logistic regression and artificial neural network models in breast cancer risk estimation. Radiographics. 2010;30(1):13–22. |
 © 2018 The Author(s). This work is published and licensed by Dove Medical Press Limited. The full terms of this license are available at https://www.dovepress.com/terms.php and incorporate the Creative Commons Attribution - Non Commercial (unported, v3.0) License.
By accessing the work you hereby accept the Terms. Non-commercial uses of the work are permitted without any further permission from Dove Medical Press Limited, provided the work is properly attributed. For permission for commercial use of this work, please see paragraphs 4.2 and 5 of our Terms.
© 2018 The Author(s). This work is published and licensed by Dove Medical Press Limited. The full terms of this license are available at https://www.dovepress.com/terms.php and incorporate the Creative Commons Attribution - Non Commercial (unported, v3.0) License.
By accessing the work you hereby accept the Terms. Non-commercial uses of the work are permitted without any further permission from Dove Medical Press Limited, provided the work is properly attributed. For permission for commercial use of this work, please see paragraphs 4.2 and 5 of our Terms.