")
Back to Journals » International Journal of Nanomedicine » Volume 15
Development of a Novel Homogeneous Nanoparticle-Based Assay for Rapid and High-Throughput Quantitation of the sST2 Protein in Human Serum
Received 10 October 2020
Accepted for publication 11 December 2020
Published 30 December 2020 Volume 2020:15 Pages 10539—10546
DOI https://doi.org/10.2147/IJN.S285899
Checked for plagiarism Yes
Review by Single anonymous peer review
Peer reviewer comments 2
Editor who approved publication: Dr Thomas Webster
Shenxia Gao, Junpu Li
The Clinical Laboratory, Tianjin Chest Hospital, Tianjin, People’s Republic of China
Correspondence: Junpu Li
The Clinical Laboratory, Tianjin Chest Hospital, No. 261 Taierzhuang South Road, Jinnan District, Tianjin 300222, People’s Republic of China
Tel/Fax +86 22-88185111
Email [email protected]
Purpose: The suppression of tumorigenicity 2 (ST2) protein is a member of the interleukin-1 receptor family with the transmembrane (ST2L) and soluble (sST2) subtypes and plays an important role in several diseases. Therefore, the present study aimed to establish and validate a novel amplified luminescent proximity homogeneous immunoassay (AlphaLISA) for the detection of sST2 in human serum.
Materials and Methods: Based on a sandwich-type immunoassay format, sST2 was captured using two different anti-sST2 antibodies. One of the antibodies was biotinylated while the other one was coated with AlphaLISA chemibeads. Thereafter, multiple tests were conducted to optimize the working conditions and validate analytical performance.
Results: The optimum concentration of the biotinylated antibodies was 1 μg/mL while the optimal dilution ratio for the anti-sST2 antibodies and conjugated chemibeads was 1:500. In addition, the optimal antigen-antibody reaction time was 15 minutes (min). Notably, the developed method showed a short turnaround time of about 25 min. Moreover, the assay exhibited high sensitivity with a limit of detection (LOD) of 0.176 ng/mL and a limit of quantification (LOQ) of 0.8 ng/mL. Furthermore, the intra-assay precision and inter-assay precision values were 5.29– 7.10% and 9.41%– 13.66%, respectively. It is also noteworthy that the test results deviated by less than ± 10% when samples had ≤ 10.0 ng/mL of triglycerides, ≤ 0.5 mmol/L of bilirubin, ≤ 5.0 g/L of triglyceride, and ≤ 250 μg/L of biotin. Additionally, the developed assay was almost consistent with the commercially available PresageTM ST2 assay kit, with a Spearman correlation coefficient of 0.916 and an R2 of 0.963 as well as a slope of 0.957 from linear regression analysis.
Conclusion: The present study showed that the sandwich AlphaLISA is a rapid, high-throughput, and reliable test for studying the levels of sST2 in a variety of diseases.
Keywords: sST2, nanoparticles, homogeneous, chemiluminescence immunoassay
Introduction
The suppression of tumorigenicity 2 (ST2) protein belongs to the Interleukin-1 Receptor-like-1 (IL1RL1) superfamily. In addition, the ST2 gene, located on the human chromosome 2q12, is expressed in four protein isoforms and its two main products are a transmembrane receptor (ST2L) and a soluble, serum circulating receptor (sST2).1,2 Previous studies demonstrated that sST2 is involved in homeostasis/pathogenesis of various cancers as well as inflammatory and cardiovascular diseases.3 Moreover, it was shown that sST2 values have low biological variability and are independent of age, renal function, and body mass index, hence displaying important features of a biomarker.4,5
In a bid to develop sST2 as a potential biomarker for the detection/diagnosis, treatment, and monitoring of a range of clinical conditions, particularly cardiac diseases, a robust method that is highly accurate, sensitive, and gives high throughput is needed. Notably, current analytical methods for sST2 are mainly Enzyme-Linked Immunoassays (ELISA), among which the Presage ST2 assay (Critical Diagnostics, San Diego, CA, USA) is the only FDA-approved and CE-marked method currently available in the market.6,7 Nonetheless, the method has a number of limitations including lack of concordance across platforms, insufficient capture of protein markers to the surface-anchored antibodies, a relatively large sample volume, and long diffusion times required for antigen-antibody binding. Additionally, ELISAs are heterogeneous methods that inevitably require multiple and time-consuming incubation as well as wash cycles.8 Consequently, all these factors affect the quality of the results and limit their subsequent application.
Therefore, to address these limitations, the present study developed an amplified luminescent proximity homogeneous immunoassay (AlphaLISA) for the quantification of sST2. This was achieved through a nanoparticle-based technology, in which the proximity (<200 nm) of 2 types of beads could lead to the emission of light through Chemiluminescence (CL). This AlphaLISA technology developed from the Luminescent Oxygen Channeling Immunoassay (LOCI) simplifies the analysis process and directly generates detection signals without resorting to the separation steps of the detectably labeled specific binding members.9–13 Therefore, contrary to the conventional ELISA techniques, the proposed methodology exhibited the advantages of simpler and faster analysis. Consequently, the purpose of the present study was to establish and validate the characteristics of this novel immunoassay for the determination of sST2 concentrations in human serum.
Materials and Methods
Chemicals and Apparatus
Streptavidin-coated sensibeads, unconjugated chemibeads and 96-well microplates were provided by Beyond Biotech (Shanghai, China). In addition, the recombinant human ST2 protein (cat. no. ab233601) with a purity of >95% (from SDS-PAGE analysis) and anti-ST2 antibodies (cat. no. ab233433 and cat. no. ab196525) were purchased from Abcam (Cambridge, UK). On the other hand, EZ-LinkTM Sulfo-NHS-LC-LC-Biotin (cat. no. 21,338) was purchased from Thermo Fisher Scientific, Inc. (Waltham, MA, USA). The interfering substances, including triglycerides, bilirubin, hemoglobin, and biotin were bought from Sigma Aldrich (St. Louis, MO, USA). Additionally, Bovine Serum Albumin (BSA) and Proclin 300 were sourced from Solarbio (Beijing, CN). The dilution solution for the biotinylated anti-sST2 antibodies and anti-sST2 antibodies-bound chemibeads was 0.01 M Phosphate-buffered Saline (PBS, pH7.4) with 0.5% (w/v) BSA and 0.1% (v/v) Proclin 300. The sST2-depleted serum was also provided by Beyond Biotech (Shanghai, China). Moreover, highly purified distilled and de-ionized water, produced through Direct-Q 3UV (Millipore) was used throughout the study. All the other chemicals were of analytical grade and used as received. Furthermore, the PresageTM ST2 assay kit that served as a comparative method was provided by Critical Diagnostics (San Diego, CA, USA). Finally, the AlphaLISA signal was measured on the Light Initiated Chemiluminescent Assay (LICA) system (Beyond Biotech).
Clinical Samples
Serum samples were obtained from the Tianjin Chest Hospital and included 42 patients with heart failure and 10 healthy subjects. Briefly, blood was collected into vacutainers containing a separating gel with a serum separator. They were then centrifuged at 3500 rpm for 5 min and the supernatants (serum) stored in aliquots at −20°C for subsequent steps. Additionally, sample pools at high (141.63 ng/mL) and low (35.27 ng/mL) concentration levels were prepared by spiking mixed samples, in order to perform all the method development and validation experiments. Repeated freezing/thawing was avoided. Moreover, written informed consent was provided by all patients while collection and storage of serum samples was approved by the Ethics Committee of Tianjin Chest Hospital.
Biotinylation of Anti-ST2 Polyclonal Antibodies
Anti-ST2 polyclonal antibodies were biotinylated according to the manufacturer’s protocol. Briefly, a 10 mM solution of the biotin reagent was prepared by dissolving 2.0 mg of EZ-Link Sulfo-NHS-LC-LC-Biotin in 0.3 mL of 0.01 M PBS. Thereafter, an appropriate volume of the anti-ST2 polyclonal antibody solution was added into the biotin reagent solution at a molar ratio of 1:20, before incubation on ice for 2 hours (h). In order to remove non-reacted biotin, the labeled antibodies were further purified by dialysis (molecular weight cutoff of 10 kDa) using 0.01 M PBS (pH7.4). The prepared biotinylated anti-ST2 antibodies were then stored at 4°C for further use.
Coupling of Monoclonal Anti-ST2 Antibodies to Chemibeads
Prior to labeling, the chemibeads (1 mg) were washed twice with ultrapure water through a brief vortex. Afterwards, the pre-washed beads were resuspended in 0.05 M carbonate buffer (pH9.6). The obtained solution was then added to 0.05 mg of monoclonal anti-ST2 antibodies after which the mixture was incubated under agitation at 37°C for 24 h. Afterwards, an aqueous solution of NaBH4 (10 μL, 8 mg/mL) was dropped into the mixture and incubation continued for 2 h at Room Temperature (RT). In order to eliminate nonspecific binding and block unconjugated sites, a solution of glycine (40 μL, 75 mg/mL) was added to the reaction before incubation at RT for 1 h. The resulting conjugate was then centrifuged (10 min, 5000×g) and washed with ultrapure water. Finally, the beads were dispersed in 200 μL of storage buffer containing 20mM HEPES, 0.2% (w/t) BSA, and 0.1% (v/v) Proclin-300 at a concentration of 5 mg/mL and stored at 4°C.
The AlphaLISA sST2 Procedure
The diagrammatic summary of the creation and application of the proposed AlphaLISA sST2 with a sandwich chemiluminescent assay format is illustrated in Figure 1. Briefly, a mixture of 20 μL serum sample or sST2 standards, 20 μL biotinylated antibodies, and 25 μL suspension of antibodies-conjugated chemibeads was added into a 96-microtiter well plate. The plate was then incubated under agitation at 37°C for 15 min to form a sandwich of immuno-complexes. Thereafter, 150 μL (100 μg/mL) of streptavidin-coated sensibeads was added and incubated in the dark at 37°C while shaking for another 10 min. Finally, a chemiluminescence reaction was produced and the signal intensity was determined as the Relative Light Units (RLU), using a LICA reader. The concentration of sST2 in serum was then calculated based on the standard calibration curve.
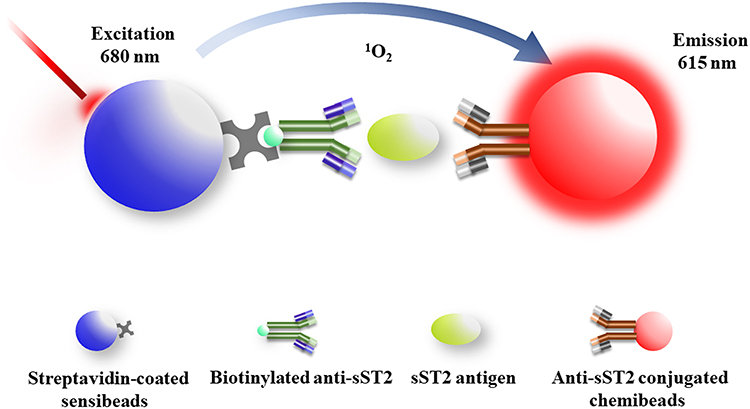 |
Figure 1 Schematic representation of AlphaLISA for the measurement of sST2 in a double-antibody sandwich format. |
Statistical Analysis
The samples and standards were assayed in duplicate. In addition, continuous variables were presented as mean ± 2 Standard Deviation (SD). A standard curve was then constructed by plotting the logarithm of RLU (Y) against the logarithm of analyte concentration (X) and fitting the results into a four-parameter logistic model using the ELISACalc data program. Additionally, Spearman correlation was performed to examine the relationship between the proposed method and the commercially available Presage™ sST2 assay kit. The equation was generated through simple linear regression analysis. Moreover, Bland-Altman analysis was used to evaluate the consistency of the two detection methods. Analyses were performed using the GraphPad Prism software, version 7.0 (San Diego, California, USA). Statistical significance was considered as two-sided P < 0.05.
Results
Optimization of AlphaLISA sST2
In order to develop a highly effective AlphaLISA sST2, the effects of several factors that could affect the sensitivity of the method were studied and optimized. Such included the concentration of biotinylated anti-sST2 antibodies, dilution ratios of the chemibeads coated with anti-sST2 antibodies and the incubation time of the first reaction step.
Optimization of the Concentration of Biotinylated Anti-sST2 Antibodies
Appropriate concentrations of antibodies were crucial for the sensitivity of the immunoassay. Therefore, biotinylated anti-sST2 antibodies were diluted to 0.2, 1, and 5 μg/mL to obtain the titration curves shown in Figure 2A. The results revealed that the CL signal intensity increased with increasing concentrations of the biotinylated antibodies within the range of 0.2–1 μg/mL. However, a decrease in CL signal intensity was observed when the concentration of biotinylated antibodies was higher than 1μg/mL. Consequently, the optimal titration level for the biotinylated anti-sST2 antibodies was chosen to be 1 μg/mL for use in subsequent experiments.
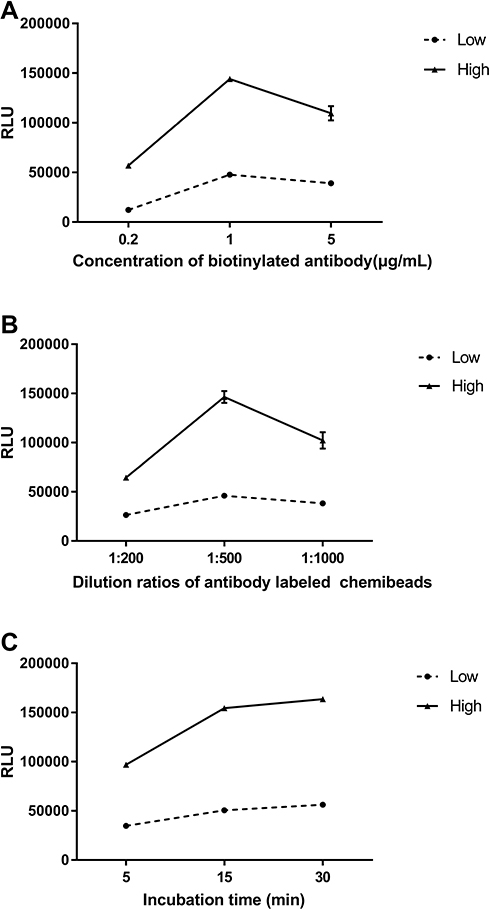 |
Figure 2 Optimization of the AlphaLISA sST2 working conditions. The effect of a single variable on the intensity of CL was examined by making the other factors constant. (A) Effect of the concentration of biotinylated anti-sST2 antibodies; (B) Effect of the dilution ratios of chemibeads coated with anti-sST2 antibodies; (C) Effect of incubation time. The error bars of some points were invisible because they were shorter than the height of the symbol. Low: low levels of sST2 serum pool (35.27 ng/mL); High: high levels of sST2 serum pool (141.63 ng/mL). |
Optimization of the Dilution Ratios for the Chemibeads Coated with Anti-sST2 Antibodies
It is noteworthy that an appropriate quantity of chemibeads is essential for analytical performance. For instance, an excess amount of chemibeads might increase the probability of random collision between two types of nanoparticles, resulting in an increase in the background signal and a decrease in sensitivity. On the other hand, an extremely low amount of chemibeads might decrease the intensity of CL, thus reducing the sensitivity of the assay. The results demonstrated that the CL signal reached a maximum at the dilution ratio of 1:500 (Figure 2B). Therefore, the dilution titration of 1:500 at a concentration of 10 μg/mL was used as the optimal dilution ratio for the anti-sST2 antibody-conjugated chemibeads.
Optimization of Incubation Time
The study then investigated the length of the immunoreaction step between the antigens and antibodies in order to assess the effect of incubation time on the performance of the assay. Figure 2C shows that the value of CL increased with incubation time between 5 and 15 min. However, only a slight increase in CL intensity was observed after 15 min, indicating that the reaction had reached an equilibrium. Therefore, an incubation time of 15 min was used in the subsequent steps.
Validation of AlphaLISA sST2
After the optimal working conditions for sST2 were established, the analytical performance of AlphaLISA sST2 was investigated. This involved a series of experimental parameters, including the calibration curve, sensitivity, precision, recovery, anti-interference, analysis of clinical samples, and method comparison. Notably, validation of performance was mainly conducted in accordance with provisions of the Clinical and Laboratory Standards Institute (CLSI).
The Standard Curve
Figure 3 illustrates the AlphaLISA sST2 standard curve obtained from a series of dilutions of ST2 standards under optimal reaction conditions. The ST2 protein was diluted proportionally in sST2-depleted serum to create 6 working standards with specific concentrations of 0, 1, 5, 25, 100, and 400 ng/mL. Additionally, the line of fit was obtained using the formula; Y= (5.59–2.63)/[1 + (X/10.06)−0.69] + 2.63, with a correlation coefficient of 0.998. Notably, the intensity of CL saturation or hook effect was observed after the concentration of ST2 exceeded 400 ng/mL.
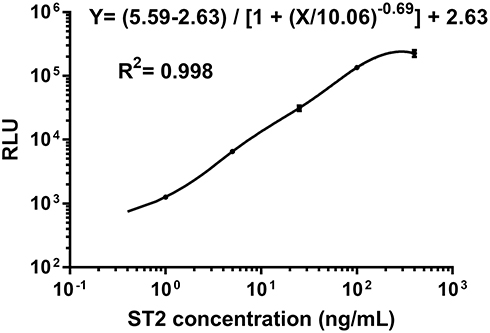 |
Figure 3 The standard calibration curve generated using the AlphaLISA with solutions containing recombinant ST2 at selected concentrations. |
Sensitivity of AlphaLISA sST2
The Limit of Detection (LOD) for the sST2 assay corresponded to the minimum dose distinguishable from 0 or the minimum detected concentration. It was assessed by adding 2 SD to the mean value of twenty zero standard replicates and calculating the corresponding concentration based on the dose–response curve. As a result, the LOD of the current assay system was found to be 0.176 ng/mL.
Additionally, the ST2 protein was diluted with sST2-free serum samples to achieve 5 solutions of 0.10, 0.20, 0.40, 0.6, and 0.80 ng/mL, in order to determine the Limit of Quantification (LOQ) of the test. The obtained low-level samples were tested in duplicates in five consecutive days. In addition, the Coefficient of Variation (CV) for each sample was calculated using the following formula: CV(%)= (SD/mean)×100. Moreover, the LOQ was obtained by plotting CV against the mean concentration and the concentration whose corresponding CV was <20% was identified as the LOQ. Consequently, an LOQ of 0.8 ng/mL was obtained, as shown in Figure S1.
Imprecision of AlphaLISA sST2
Intra-assay variation was examined by analyzing 20 replicates of serum pools containing a low or high concentration (35.27 or 141.63 ng/mL, respectively) of sST2, in a single run. On the other hand, inter-assay variation was examined by running the serum pools in a similar manner but on five separate occasions. The intra- and inter-assay CV values ranged between 5.29–7.10% and 9.41–13.66%, respectively (Table 1). Therefore, the results showed acceptable imprecision given that both CVs were below or close to 15%.
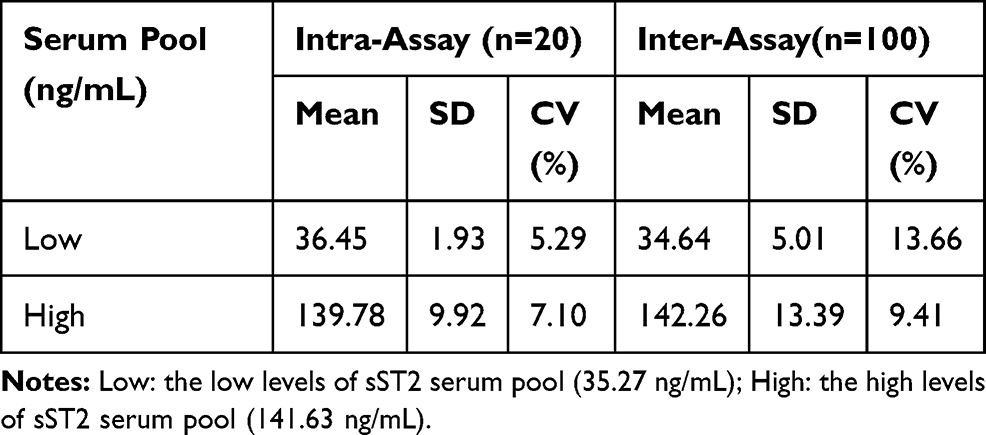 |
Table 1 Intra- and Inter-Assay CV for AlphaLISA sST2 Using Repetitive Measurements |
Recovery of AlphaLISA sST2
The recovery rate is an important indicator of the testing accuracy of detection systems. Therefore, five solutions were prepared for the recovery study. The first and fifth solutions were the above-mentioned (previous section) serum pools with low and high concentration of sST2, respectively. However, the second solution was obtained by spiking the first solution with the fifth one at a volume ratio of 3:1 to obtain the mixture. Similarly, the third and fourth solutions were obtained by mixing the first and fifth ones at a volume ratio of 2:2 and 1:3, respectively. The results revealed that all recoveries were within 90–110% and are shown in Table 2.
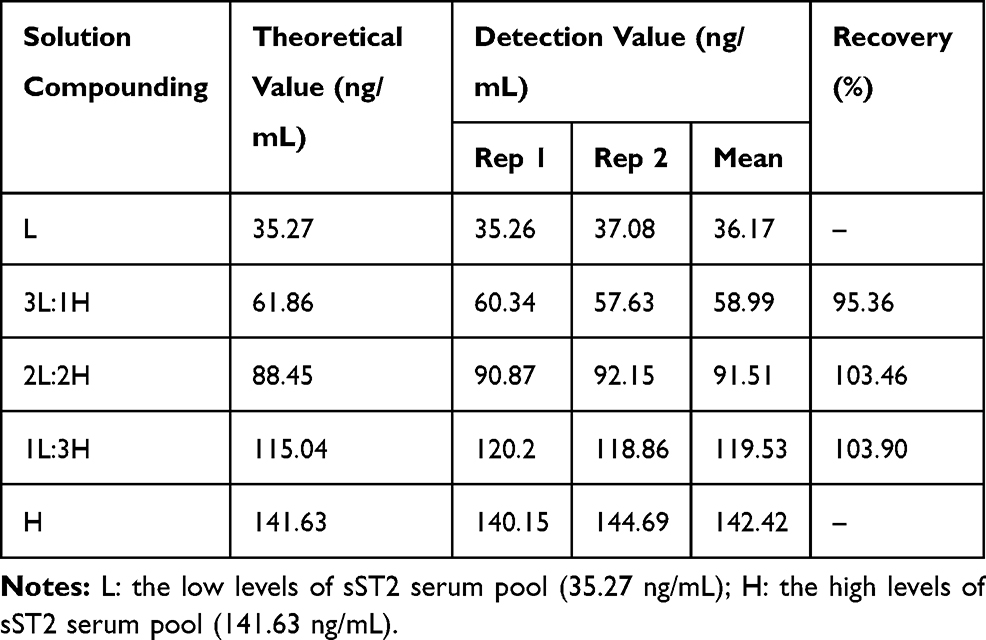 |
Table 2 Recovery of AlphaLISA sST2 |
Anti-Interference Capability of AlphaLISA sST2
Sample components, including structurally similar analytes, degradants, metabolites, impurities, or matrix components may affect the quantitation of the analyte of interest. Therefore, the test for interference was performed by adding known amounts of triglycerides, bilirubin, hemoglobin, and biotin to serum pools.14 Additionally, the rate of interference was calculated based on the percentage difference before and after adding the interfering substance. Notably, the rate of interference was shown to be acceptable as it was within the range of ± 10%. Moreover, no significant difference was observed in the presence of triglycerides, bilirubin, hemoglobin, and biotin up to the concentrations of 10.0 g/L, 0.5 mmol/L, 5.0 g/L, and 250 μg/L, respectively (Figure S2).
Analysis of Clinical Samples
AlphaLISA was then used to determine the concentration of sST2 in samples obtained from 42 patients with acute or chronic heart failure and 10 healthy individuals. No significant difference was obtained in the serum sST2 levels of patients with heart failure and healthy individuals, as shown in Figure S3 (P=0.052).
Correlation Between AlphaLISA sST2 and the Presage™ sST2 Assay
In order to further validate the assay, the levels of sST2 in 52 clinical serum samples were evaluated in parallel using the present method (X-axis) and the Presage™ ST2 ELISA assay (Y-axis) as a reference. The Presage™ ST2 method is currently the only FDA-approved and CE-marked assay in the market. Interestingly, the results demonstrated some similarity between the two methods (r=0.916, P<0.0001). Additionally, a good linear relationship was observed between the methods (Figure 4A) and the corresponding equation for the linear regression curve was Y= 0.96X+1.56 (R2=0.963, P<0.0001). Bland-Altman analysis further validated the results, with a mean bias of 0.265 ng/mL and a 95% limits of agreement value of between −11.97 and 12.50 (Figure 4B).
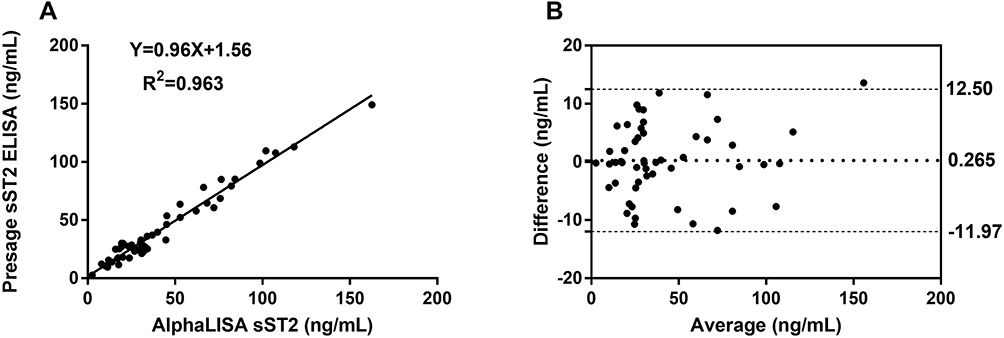 |
Figure 4 Graphical comparisons between the novel method and commercial ELISA kits in the determination of sST2 concentration in serum samples. (A) Linear regression analysis of the present method and reference products in the detection of sST2; (B) Bland-Altman plot of the present method and reference products in the detection of sST2 levels in serum samples. The data is presented as mean values from duplicate measurements. |
Discussion
sST2 is recognized as a noninvasive diagnostic and prognostic marker of a range of diseases. Over the recent years, a better understanding of this biomarker as well as its diverse clinical applications have raised the need for a more rapid, high-throughput and sensitive method for its detection. Consequently, the present study for the first time developed a method that established a homogeneous chemiluminescent sandwich immunoassay for the rapid quantitative detection of sST2. Notably, this method eliminated the tedious wash steps required in the currently used ELISA-based assays. The AlphaLISA technology is a beads based method with simple, hypersensitive, and high-throughput screening characteristics.10–13 In addition, this analysis method is mainly composed of two types of polystyrene microparticles, namely sensibeads and chemibeads. Sensibeads are modified with phthalocyanine as a photosensitizer, which can transform adjacent ambient oxygen (O2) to an excited form of singlet oxygen (1O2) under irradiation at 680 nm. Therefore, when the two nanospheres are close to each other through the biological interaction of antigen-antibody and biotin-streptavidin, the singlet oxygen molecules transfer to the surface of the chemibeads within a distance of 200 nm then react with thioxene derivatives and Eu (III) dopant to generate 520–620 nm of light emission.
Unlike the typical ELISA method which inevitably requires multiple washing cycles and incubation steps,6 the AlphaLISA technique is a homogeneous immunoassay procedure that does not require any separation or washing step. It instead employs a two-step chemiluminescence assay as a detection technique using polystyrene microparticles. Consequently, this mix-and-read property led to the rapid quantitation of sST2 within as little as 25 min and was therefore more time efficient. Moreover, the present sST2 assay in a plate format offered a higher throughput compared to the conventional single-tube detection methods, such as the Chemiluminescent Immunoassay (CLIA) and Electrochemiluminescence (ECLIA).
The AlphaLISA sST2 assay also showed good sensitivity with an LOD of 0.176 ng/mL and an LOQ of 0.8 ng/mL, which is great considering the increasing need for a highly sensitive measurement. Additionally, the precision results showed that the assay had good performance, evidenced by the low intra-and inter-assay CVs which were all below 15%. These therefore indicated that the developed AlphaLISA sST2 method complied with the generally accepted standards.
Given that the AlphaLISA sST2 technique is a wash-free method, it is possible that it is more susceptible to interference from abnormal clinical samples that could result from jaundice, hemolysis, and hyper-lipemic blood. In addition, biotin causes interference in many streptavidin-biotin-based immunoassays, resulting in false-decrease results in sandwich immunoassays.15,16 Nonetheless, no significant interference was observed from the parameters assayed in this study, within the indicated ranges of concentration.
Moreover, applicability of the assay for the detection of sST2 was investigated using sera from patients with heart failure and healthy controls. The results revealed no significant difference in the concentration of sST2 between the two groups, indicating that it might not have been a diagnostic maker of heart failure in the study population. Recent studies demonstrated that an elevated concentration of soluble ST2 was a predictor of adverse cardiovascular outcomes in both acute and chronic heart failure.17–21 Therefore, sST2 may be a prognostic biomarker that can help in therapeutic decision-making in both chronic and acute heart failure.
Furthermore, the validity of AlphaLISA sST2 was further confirmed by the good, overall correlation analysis results (r =0.916 and P<0.0001) obtained between the developed method and the only commercially approved kit (Presage™ ST2 Assay Kit). Satisfactory results were also obtained from Bland-Altman analysis.
Conclusion
The study for the first time developed an AlphaLISA immunoassay for measuring the concentration of sST2 in human serum. The assay exhibited acceptable analytical characteristics, and was largely similar to the standard method, making it promising as an alternative for ELISA in both research and clinical practice.
Acknowledgments
The authors gratefully acknowledge the technical help of Beyond, Shanghai, China.
Disclosure
The authors report no conflicts of interest for this work.
References
1. Tominaga S, Inazawa J, Tsuji S. Assignment of the human ST2 gene to chromosome 2 at q11.2. Hum Genet. 1996;97(5):561–563. doi:10.1007/BF02281860
2. Iwahana H, Yanagisawa K, Ito-Kosaka A, et al. Different promoter usage and multiple transcription initiation sites of the interleukin-1 receptor-related human ST2 gene in ut-7 and tm12 cells. Eur J Biochem. 1999;264(2):397–406. doi:10.1046/j.1432-1327.1999.00615.x
3. Homsak E, Gruson D. Soluble ST2: a complex and diverse role in several diseases. Clin Chim Acta. 2020;507:75–87. doi:10.1016/j.cca.2020.04.011
4. Alan HBW, Wians F, Jaffe A. Biological variation of galectin-3 and soluble ST2 for chronic heart failure: implication on interpretation of test results. Am Heart J. 2013;165(6):995–999. doi:10.1016/j.ahj.2013.02.029
5. Dieplinger B, Egger M, Poelz W, et al. Long-term stability of soluble ST2 in frozen plasma samples. Clin Biochem. 2010;43(13–14):1169–1170. doi:10.1016/j.clinbiochem.2010.05.019
6. Dieplinger B, James LJ, Steinmair M, et al. Analytical and clinical evaluation of a novel high-sensitivity assay for measurement of soluble ST2 in human plasma-the Presage ST2 assay. Clin Chim Acta. 2009;409:33–40. doi:10.1016/j.cca.2009.08.010
7. Mueller T, Dieplinger B. The Presage(®) ST2 assay: analytical considerations and clinical applications for a high-sensitivity assay for measurement of soluble ST2. Expert Rev Mol Diagn. 2013;13(1):13–30. doi:10.1586/erm.12.128
8. Liu H, Rong P, Jia H, et al. A wash-free homogeneous colorimetric immunoassay method. Theranostics. 2016;6(1):54–64. doi:10.7150/thno.13159
9. Ullman EF, Kirakossian H, Switchenko AC, et al. Luminescent oxygen channeling assay (LOCI): sensitive, broadly applicable homogeneous immunoassay method. Clin Chem. 1996;42(9):1518–1526. doi:10.1093/clinchem/42.9.1518
10. Zhao H, Lin G, Liu T, et al. Rapid quantitation of human epididymis protein 4 in human serum by amplified luminescent proximity homogeneous immunoassay (AlphaLISA). J Immunol Methods. 2016;437:64–69. doi:10.1016/j.jim.2016.08.006
11. Hou C, Zhao L, Geng F, et al. Donor/acceptor nanoparticle pair-based singlet oxygen channeling homogenous chemiluminescence immunoassay for quantitative determination of bisphenol A. Anal Bioanal Chem. 2016;408(30):8795–8804. doi:10.1007/s00216-016-9584-y
12. Liu T, Huang H, Dong Z, et al. Development of an amplified luminescent proximity homogeneous assay for quantitative determination of hepatitis B surface antigen in human serum. Clin Chim Acta. 2013;426:139–144. doi:10.1016/j.cca.2013.09.013
13. Li P, Chen Z, Liu B, et al. Establishment of a novel homogeneous nanoparticle-based assay for sensitive procalcitonin detection of ultra low-volume serum samples. Int J Nanomedicine. 2018;13(13):5395–5404. doi:10.2147/IJN.S173776
14. Chen J, Zhang H, Chen W. Chemiluminescence immunoassay for sensing lipoprotein-associated phospholipase A2 in cardiovascular risk evaluation. Clin Chim Acta. 2019;488:143–149. doi:10.1016/j.cca.2018.11.013
15. Willeman T, Casez O, Faure P, et al. Evaluation of biotin interference on immunoassays: new data for troponin I, digoxin, NT-Pro-BNP, and progesterone. Clin Chem Lab Med. 2017;55(10):e226–e229. doi:10.1515/cclm-2016-0980
16. Piketty ML, Polak M, Flechtner I, et al. False biochemical diagnosis of hyperthyroidism in streptavidin-biotin-based immunoassays: the problem of biotin intake and related interferences. Clin Chem Lab Med. 2017;55(6):780–788. doi:10.1515/cclm-2016-0606
17. Mueller T, Dieplinger B, Gegenhuber A, et al. Increased plasma concentrations of soluble ST2 are predictive for 1-year mortality in patients with acute destabilized heart failure. Clin Chem. 2008;54:752–756. doi:10.1373/clinchem.2007.096560
18. Pascual-Figal DA, Ordonez-Llanos J, Tornel PL, et al. Soluble ST2 for predicting sudden cardiac death in patients with chronic heart failure and left ventricular systolic dysfunction. J Am Coll Cardiol. 2009;54:2174–2179. doi:10.1016/j.jacc.2009.07.041
19. Yancy CW, Jessup M, Bozkurt B, et al. 2013 ACCF/AHA guideline for the management of heart failure: a report of the American College of Cardiology Foundation/American Heart Association Task Force on practice guidelines. J Am Coll Cardiol. 2013;62:147–239. doi:10.1016/j.jacc.2013.05.019
20. Aimo A, Vergaro G, Passino C, et al. Prognostic value of soluble suppression of tumorigenicity-2 in chronic heart failure: a meta-analysis. JACC Heart Fail. 2017;5:280–286. doi:10.1016/j.jchf.2016.09.010
21. Gruson D, Lepoutre T, Ahn SA, Rousseau MF. Increased soluble ST2 is a stronger predictor of long-term cardiovascular death than natriuretic peptides in heart failure patients with reduced ejection fraction. Int J Cardiol. 2014;172(1):250–252. doi:10.1016/j.ijcard.2013.12.101
 © 2020 The Author(s). This work is published and licensed by Dove Medical Press Limited. The full terms of this license are available at https://www.dovepress.com/terms.php and incorporate the Creative Commons Attribution - Non Commercial (unported, v3.0) License.
By accessing the work you hereby accept the Terms. Non-commercial uses of the work are permitted without any further permission from Dove Medical Press Limited, provided the work is properly attributed. For permission for commercial use of this work, please see paragraphs 4.2 and 5 of our Terms.
© 2020 The Author(s). This work is published and licensed by Dove Medical Press Limited. The full terms of this license are available at https://www.dovepress.com/terms.php and incorporate the Creative Commons Attribution - Non Commercial (unported, v3.0) License.
By accessing the work you hereby accept the Terms. Non-commercial uses of the work are permitted without any further permission from Dove Medical Press Limited, provided the work is properly attributed. For permission for commercial use of this work, please see paragraphs 4.2 and 5 of our Terms.