")
Back to Journals » Cancer Management and Research » Volume 10
Development and validation of nomograms for predicting overall and breast cancer-specific survival among patients with triple-negative breast cancer
Authors Guo LW , Jiang LM, Gong Y , Zhang HH, Li XG, He M, Sun WL, Ling H, Hu X
Received 2 July 2018
Accepted for publication 2 October 2018
Published 19 November 2018 Volume 2018:10 Pages 5881—5894
DOI https://doi.org/10.2147/CMAR.S178859
Checked for plagiarism Yes
Review by Single anonymous peer review
Peer reviewer comments 4
Editor who approved publication: Dr Rituraj Purohit
Lin-Wei Guo,1,2,* Lin-Miao Jiang,3,* Yue Gong,1,2,* Hong-Hua Zhang,4 Xiao-Guang Li,1 Min He,1,2 Wei-Li Sun,1 Hong Ling,1,2 Xin Hu1,2
1Key Laboratory of Breast Cancer in Shanghai, Department of Breast Surgery, Fudan University Shanghai Cancer Center, Shanghai, China; 2Department of Oncology, Shanghai Medical College, Fudan University, Shanghai, China; 3Institute for Medical Informatics, Biometry and Epidemiology, Ludwig-Maximilians Universität, Munich, Germany; 4Department of Orthopaedic Surgery, Tongji Hospital, Tongji Medical College, Huazhong University of Science and Technology, Wuhan, Hubei, China
*These authors contributed equally to this work
Purpose: TNBC is generally more aggressive than other BC subtypes and has limited therapeutic options. We aimed to construct comprehensive and reliable nomograms to predict the OS and BCSS of TNBC patients to offer clinicians therapeutic guidance for improving the prognosis of TNBC patients.
Patients and methods: We used the SEER 19 Cancer Registry to identify 21,419 eligible TNBC patients diagnosed from January 1, 2010 to December 31, 2015, and divided the database randomly into a training cohort (n=10,709) and a validation cohort (n=10,710). The log-rank test and Cox analysis together with a competing risk model were utilized to identify independent prognostic factors for OS and BCSS, which were then integrated to construct nomograms.
Results: According to the training cohort, except for laterality, the following factors were all predictive of OS and BCSS: age at diagnosis, race, tumor size, number of positive lymph nodes, grade, and histological subtype. The 1-, 3-, and 5-year probabilities of BC-specific mortality were 2.7%, 12.5%, and 17.1%, respectively. The precision of the nomograms was assessed by the C-index value and calibration plot diagrams. The C-index value were 0.779 for OS and 0.793 for BCSS in the internal validation and 0.774 for OS and 0.792 for BCSS in the external validation. Both internal and external calibration plot diagrams showed good consistency between the actual and predicted outcomes, especially for 3- and 5-year OS and BCSS.
Conclusion: These nomograms hold promise as a novel and accurate tool in predicting OS and BCSS of TNBC patients and could be used in clinical practice to assist clinicians in developing more effective therapeutic strategies and to evaluate prognostic personally.
Keywords: TNBC, nomogram, SEER, cancer-specific survival, prognosis
Introduction
With an estimated 1.8 million new patients each year, BC is the most prevalent cancer in women worldwide.1 TNBC, which is a distinct heterogeneous subtype, accounts for 15%–20% of all BC cases. TNBC is characterized by ≤1% positive immunohistochemical expression of the estrogen receptor, progesterone receptor, and no amplification of human epidermal growth receptor 2 (HER-2).2 Thus, unlike luminal or HER-2+ BC, TNBC does not respond to hormonal therapy (such as tamoxifen or aromatase inhibitors) or targeted therapy (such as trastuzumab or lapatinib). Cytotoxic chemotherapy remains the cornerstone for the treatment of TNBC.3
TNBC is characterized by its aggressive behavior and a poor prognosis; distant visceral metastases can also occur and are most frequently found in the lungs and central nervous system and less frequently in bone.4 The overall distant recurrence risk of TNBC reaches a peak within the first 3 years post surgery and becomes less common after 5 years.5–7 Although the lifetime with metastasis and recurrence in TNBC is much lower than that in other subtypes, TNBC has few treatment options and shows a lack of durable treatment responses.8,9 Due to its particularly malignant behavior, it is important to categorize TNBC patients according to their individual characteristics to better assess prognosis.
Nomogram is a concrete graphical representation that integrates several independent prognostic factors to predict a specific end point. In this study, we aimed to construct and validate reliable nomograms based on a substantial TNBC patient record from the SEER 19 Cancer Registry and to compare our nomograms with the traditional TNM staging system in an effort to help clinicians precisely identify high-risk TNBC patients whose survival outcomes might be improved by therapy.
Patients and methods
Study cohorts
SEER is one of the most representative large-scale tumor registration databases in North America, and it contains a large amount of evidence-based medical data. The clinicopathological information of 21,419 TNBC patients in our study was collected from the SEER program from January 1, 2010 to December 31, 2015. The inclusion criteria were as follows: 1) female; 2) BC as the first and only cancer diagnosis; 3) diagnosis confirmed by positive histology other than by autopsy or a death certificate; 4) older than 20 years; 5) unilateral BC; 6) histological grade I–III; and 7) histological subtype of infiltrating ductal carcinoma (IDC), infiltrating lobular carcinoma (ILC), or others. Patients with unknown or ambiguous information were excluded.
We analyzed the patients’ characteristics according to the following seven factors: age (20–39, 40–59, 60–79, or ≥80 years), race (white, black, or others), tumor size (≤2 cm, 2–5 cm, or >5 cm), number of positive regional nodes (0, 1–3, 4–9, or ≥10), laterality (left or right), grade (I–III), and histology (IDC, ILC, or others). Due to the large number of patients and their unknown identity as SEER database does not hold identifying patient information, written inform consent was waived, and the study was approved by the ethics committee of Shanghai Cancer Center of Fudan University.
Statistical analyses
Construction of the nomogram
The eligible patients (n=21,419) were randomly divided into the following two equal-sized groups using the function “sample.int” in R: a training cohort (n=10,709) and a validation cohort (n=10,709). The primary outcomes of this study were OS and BCSS.
OS was defined as the total survival time from diagnosis to BC-related or other causes of death, the last date of follow-up, or December 31, 2015, if the last follow-up exceeded this date. In the training cohort, univariate prognostic factors were determined using Kaplan–Meier plots and compared using log-rank tests. Significant factors with two-sided P-value of <0.05 were entered into the multivariable analysis. With clinical relevance taken into account, the associated factors identified by the multivariate analysis through Cox proportional hazards models were used to construct a nomogram for OS using the R package “rms”.
BCSS was defined as the time from the date of diagnosis to the date of death attributed to BC, and deaths from other causes were regarded as competing risks. We used the CIF to assess the probability of death. A sub-distribution analysis of competing risks was performed to construct a competing risk model;10 Gray’s11 test was conducted to analyze differences in CIF among groups. Thus, a nomogram was developed by the integration of prognostic factors with a significant P-value to predict 1-, 3-, and 5-year BCSS via the R package “cmprsk”.
Validation of the nomogram
To ensure the predictive accuracy of the nomogram, we validated the models both internally (1,000 bootstrap resamples in the training cohort) and externally (in the validation cohort). The degree of fit was assessed by calibration diagrams and the C-index value. A calibration diagram was plotted with observed survival against the nomogram-predicted probability of survival from the model. The C-index value was calculated to assess the discriminatory and predictive ability of the model. The C-index value varies from 0.5, which represents random chance, to 1.0, which indicates a perfect fit. Typically, a C-index value of >0.7 suggests a reasonable estimation. Validation and calibration of the models were also conducted with the R package “rms”.
Comparison of nomograms
We compared the discrimination and prediction ability between the traditional TNM prognostic models and our new predictive models based on the C-index value with the R package “rcorrp.cens” in both the training and validation cohort.
We conducted all statistical analyses with R software, version 3.4.2, and SPSS software, version 23 (IBM Corporation, Armonk, NY, USA).
Results
Demographics and clinicopathological characteristics
Through rigorous screening, we identified 21,419 eligible TNBC patients in the SEER database who were diagnosed from 2010 to 2015. The patients were randomly divided into a training cohort and a validation cohort, with 10,709 patients in the training cohort and 10,710 in the validation cohort. The median age at diagnosis was 57 years (IQR, 47–66 years), and the median survival time was 29 months (IQR, 14–48 months) in both cohorts. By the date of last follow-up, 2,728 (12.74%) patients in the whole cohort died, with 2,219 (10.36%) deaths attributed to BC and the remaining 509 (2.38%) attributed to other causes. Detailed baseline characteristics are listed in Table 1.
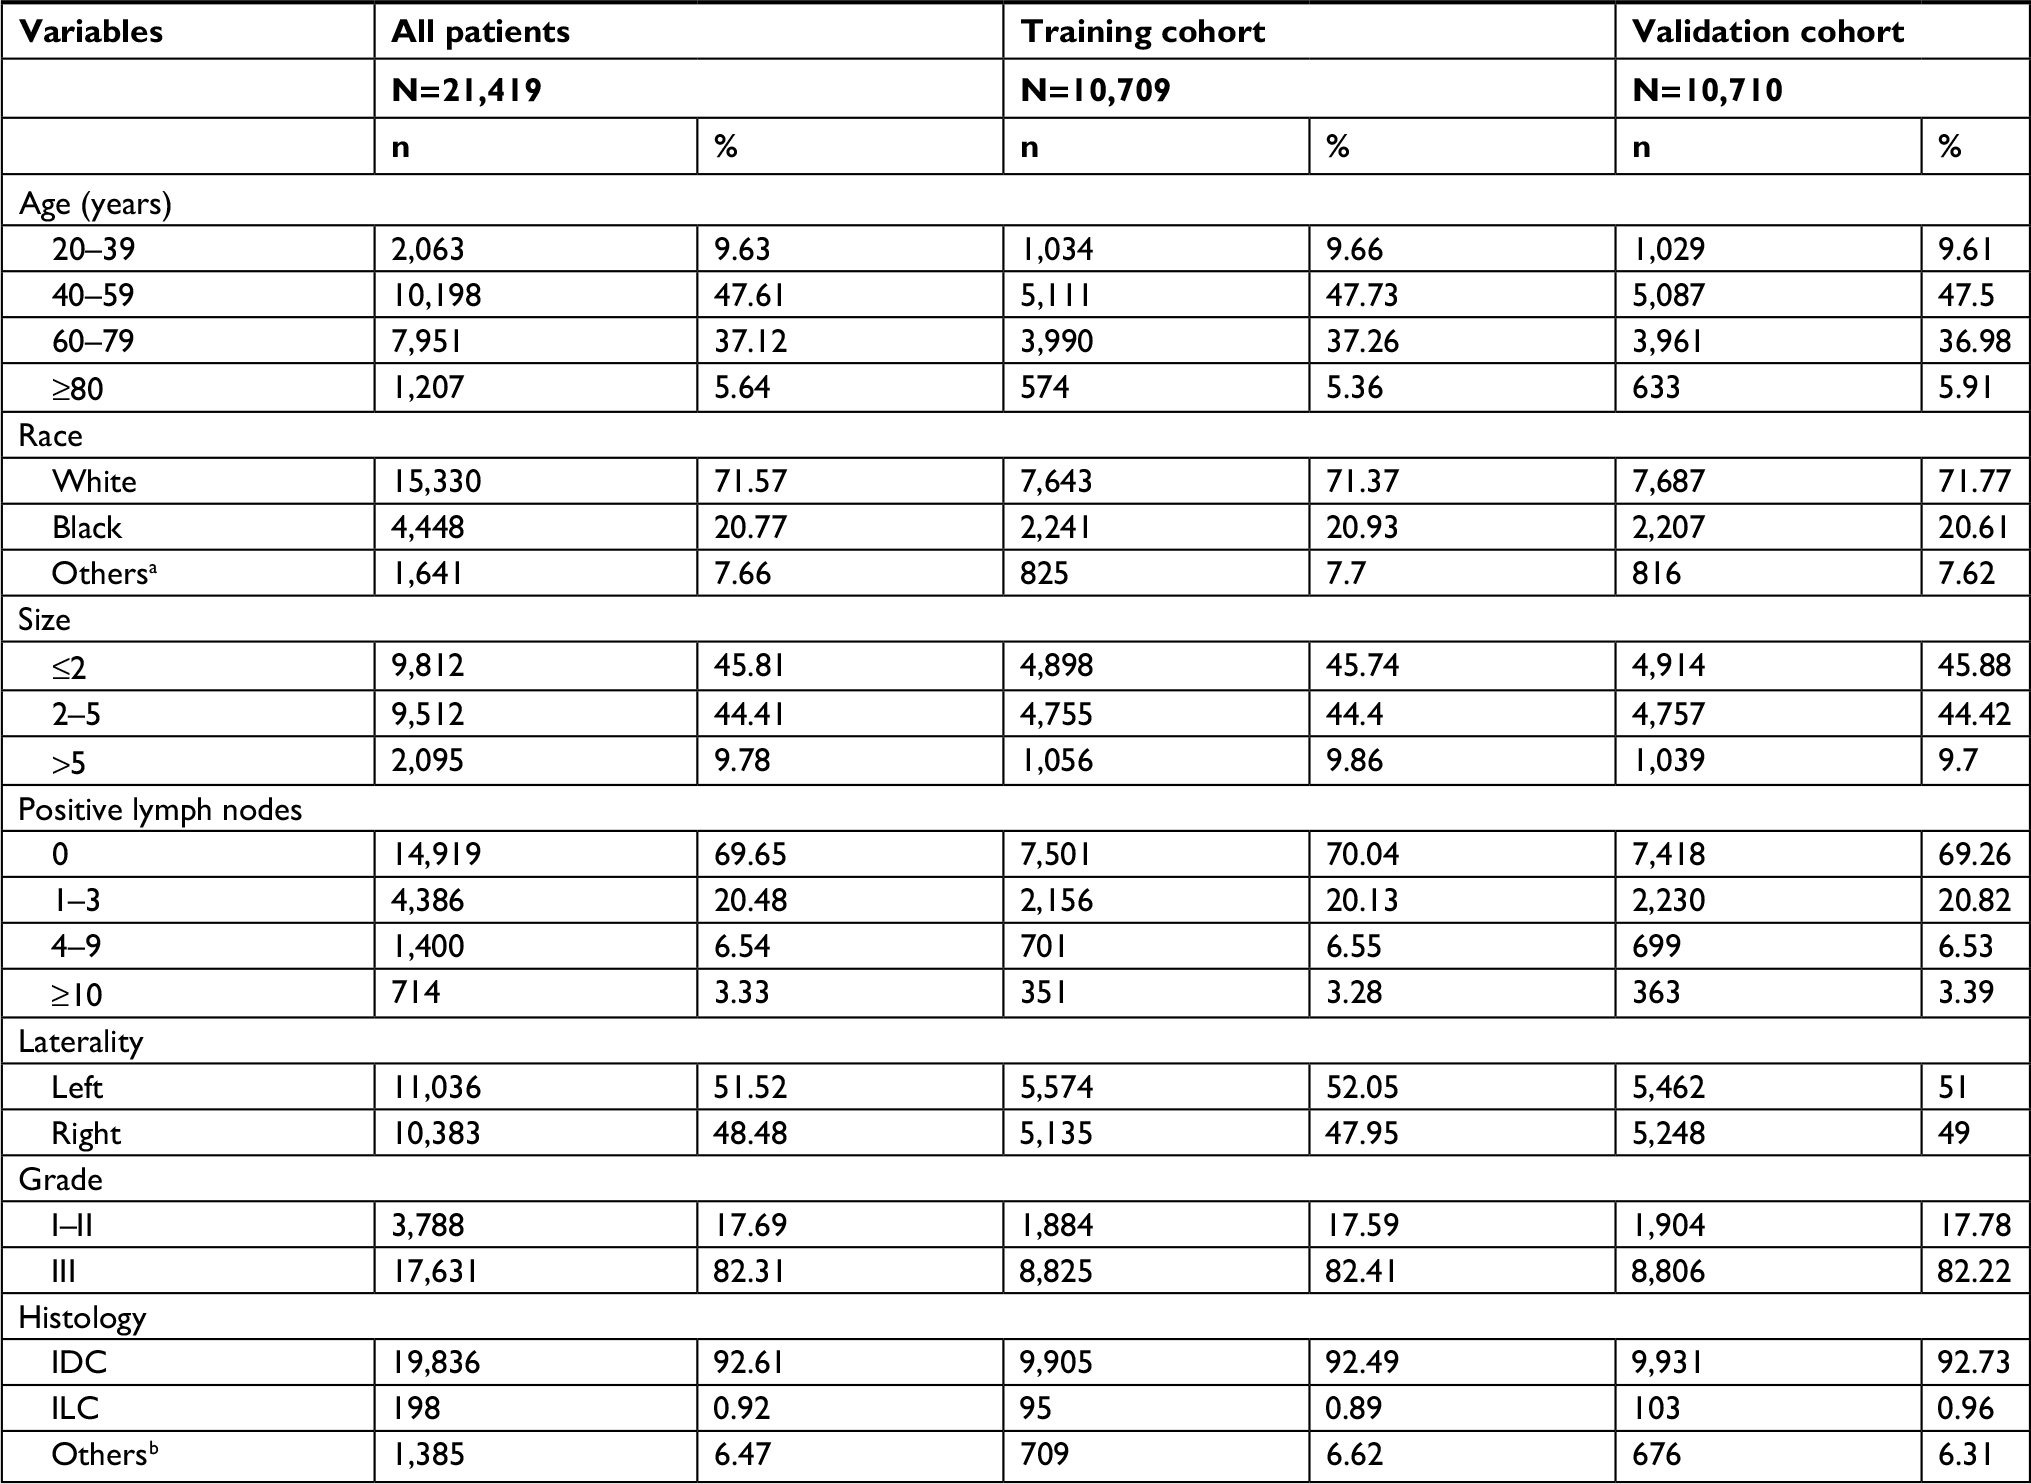 | Table 1 Patients’ demographics and clinicopathological characteristics Notes: aAmerican Indian/Alaskan native and Asian/Pacific Islander. bOther histologies of invasive BC except IDC and ILC. |
Factors associated with OS
For the training cohort, data on age at diagnosis, race, tumor size, number of positive lymph nodes, laterality, grade, and histology were collected. The log-rank univariate test showed that, except for laterality, the remaining variables should be included in the multivariate analysis (Cox proportional hazards model), and each of these factors was subsequently confirmed to be independent prognostic factors associated with OS (Table 2).
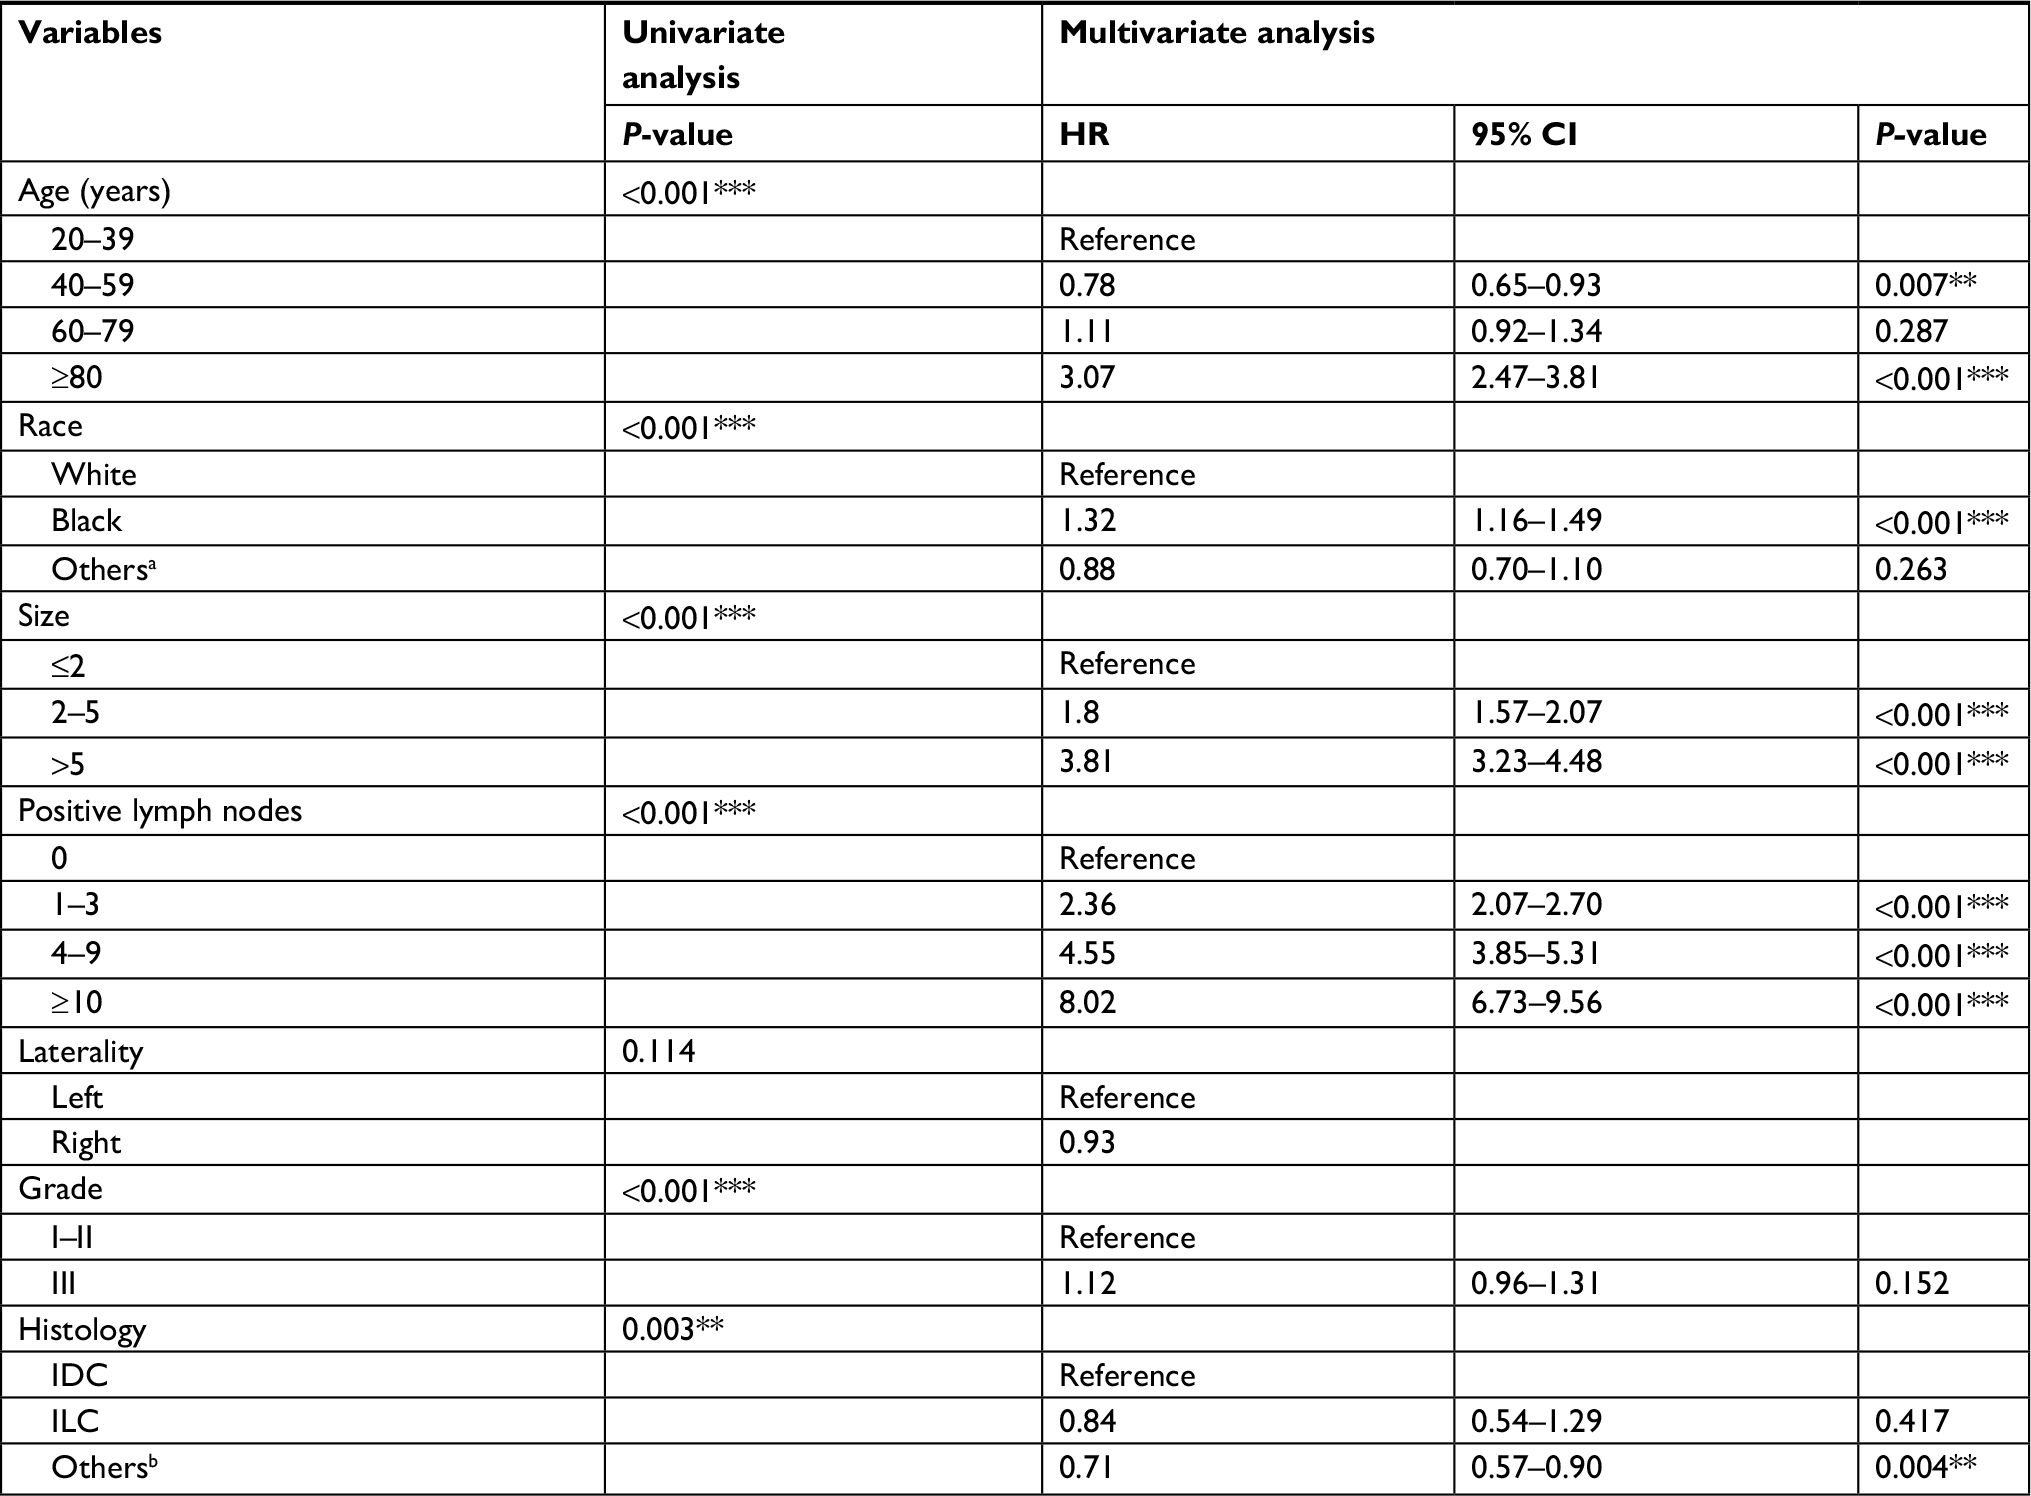 | Table 2 Univariate and multivariate analyses of OS in the training cohort Notes: aAmerican Indian/Alaskan native and Asian/Pacific Islander. bOther histologies of invasive BC except IDC and ILC. Two-sided P-values <0.05; **two-sided P-values <0.01; ***two-sided P-values <0.001. |
Factors associated with BCSS
Estimates of the probabilities of death resulting from BC and other causes according to clinical characteristics are listed in Table 3. The 1-, 3-, and 5-year probabilities of death from BC were 2.7%, 12.5%, and 17.1%, respectively, while the cumulative incidences of death from other causes were 0.9%, 2.4%, and 3.8%, respectively. Age, tumor size, and number of positive lymph nodes had strong correlations with the probability of death (P<0.001 for all outcomes), while laterality was not associated with death. Patients of the black race, those with histological grade III tumors, IDC, or ILC, had a higher cumulative incidence of death attributed to BC (P<0.001).
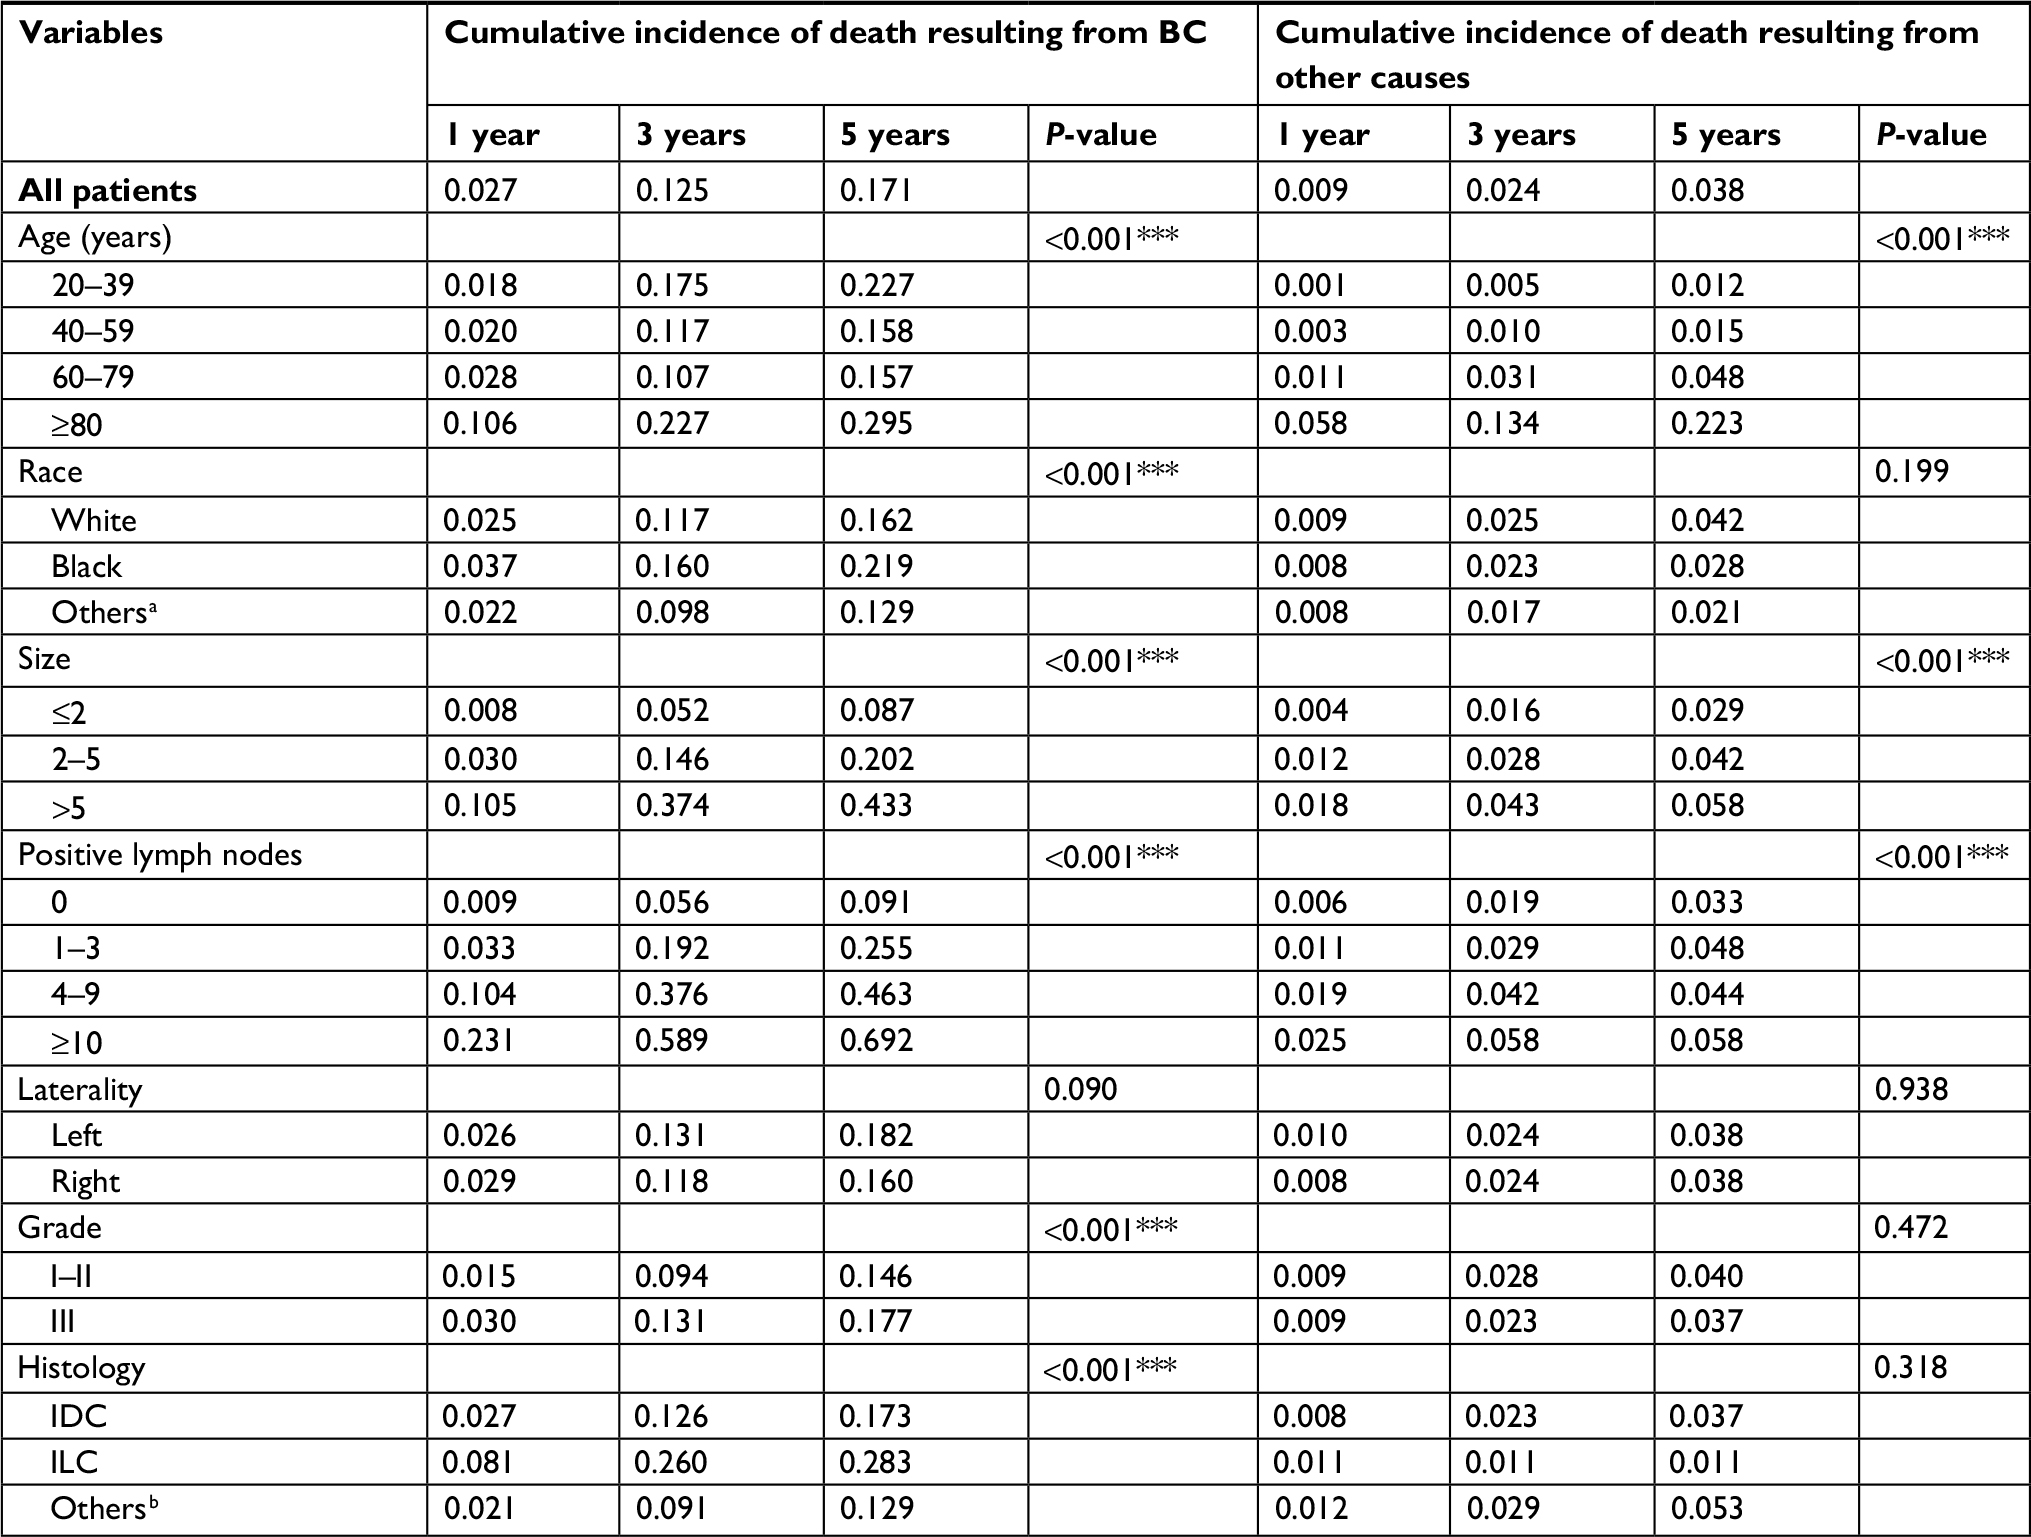 | Table 3 The 1-, 3-, and 5-year cumulative incidence of death among patients in the training cohort Notes: aAmerican Indian/Alaskan native and Asian/Pacific Islander. bOther histologies of invasive BC except IDC and ILC. Two-sided P-values <0.05; two-sided P-values <0.01; ***two-sided P-values <0.001. |
Nomogram construction and validation
Only the variables that were significantly associated with OS and BCSS (P<0.05) were included in the construction of nomograms to predict 1-, 3-, and 5-year survival (Figure 1). Figure 1 shows that the number of positive lymph nodes was the strongest contributor to survival outcome, followed by age at diagnosis and tumor size. The C-index values of the nomograms in the training cohort were 0.779 (95% CI, 0.766–0.792) for OS and 0.793 (95% CI, 0.780–0.807) for BCSS. For the validation cohort, the C-index values were 0.774 (95% CI, 0.761–0.787) for OS and 0.792 (95% CI, 0.778–0.806) for BCSS. Both internal and external calibration plot diagrams showed good consistency between the actual and predicted outcomes, especially for 3- and 5-year OS and BCSS (Figures 2 and 3).
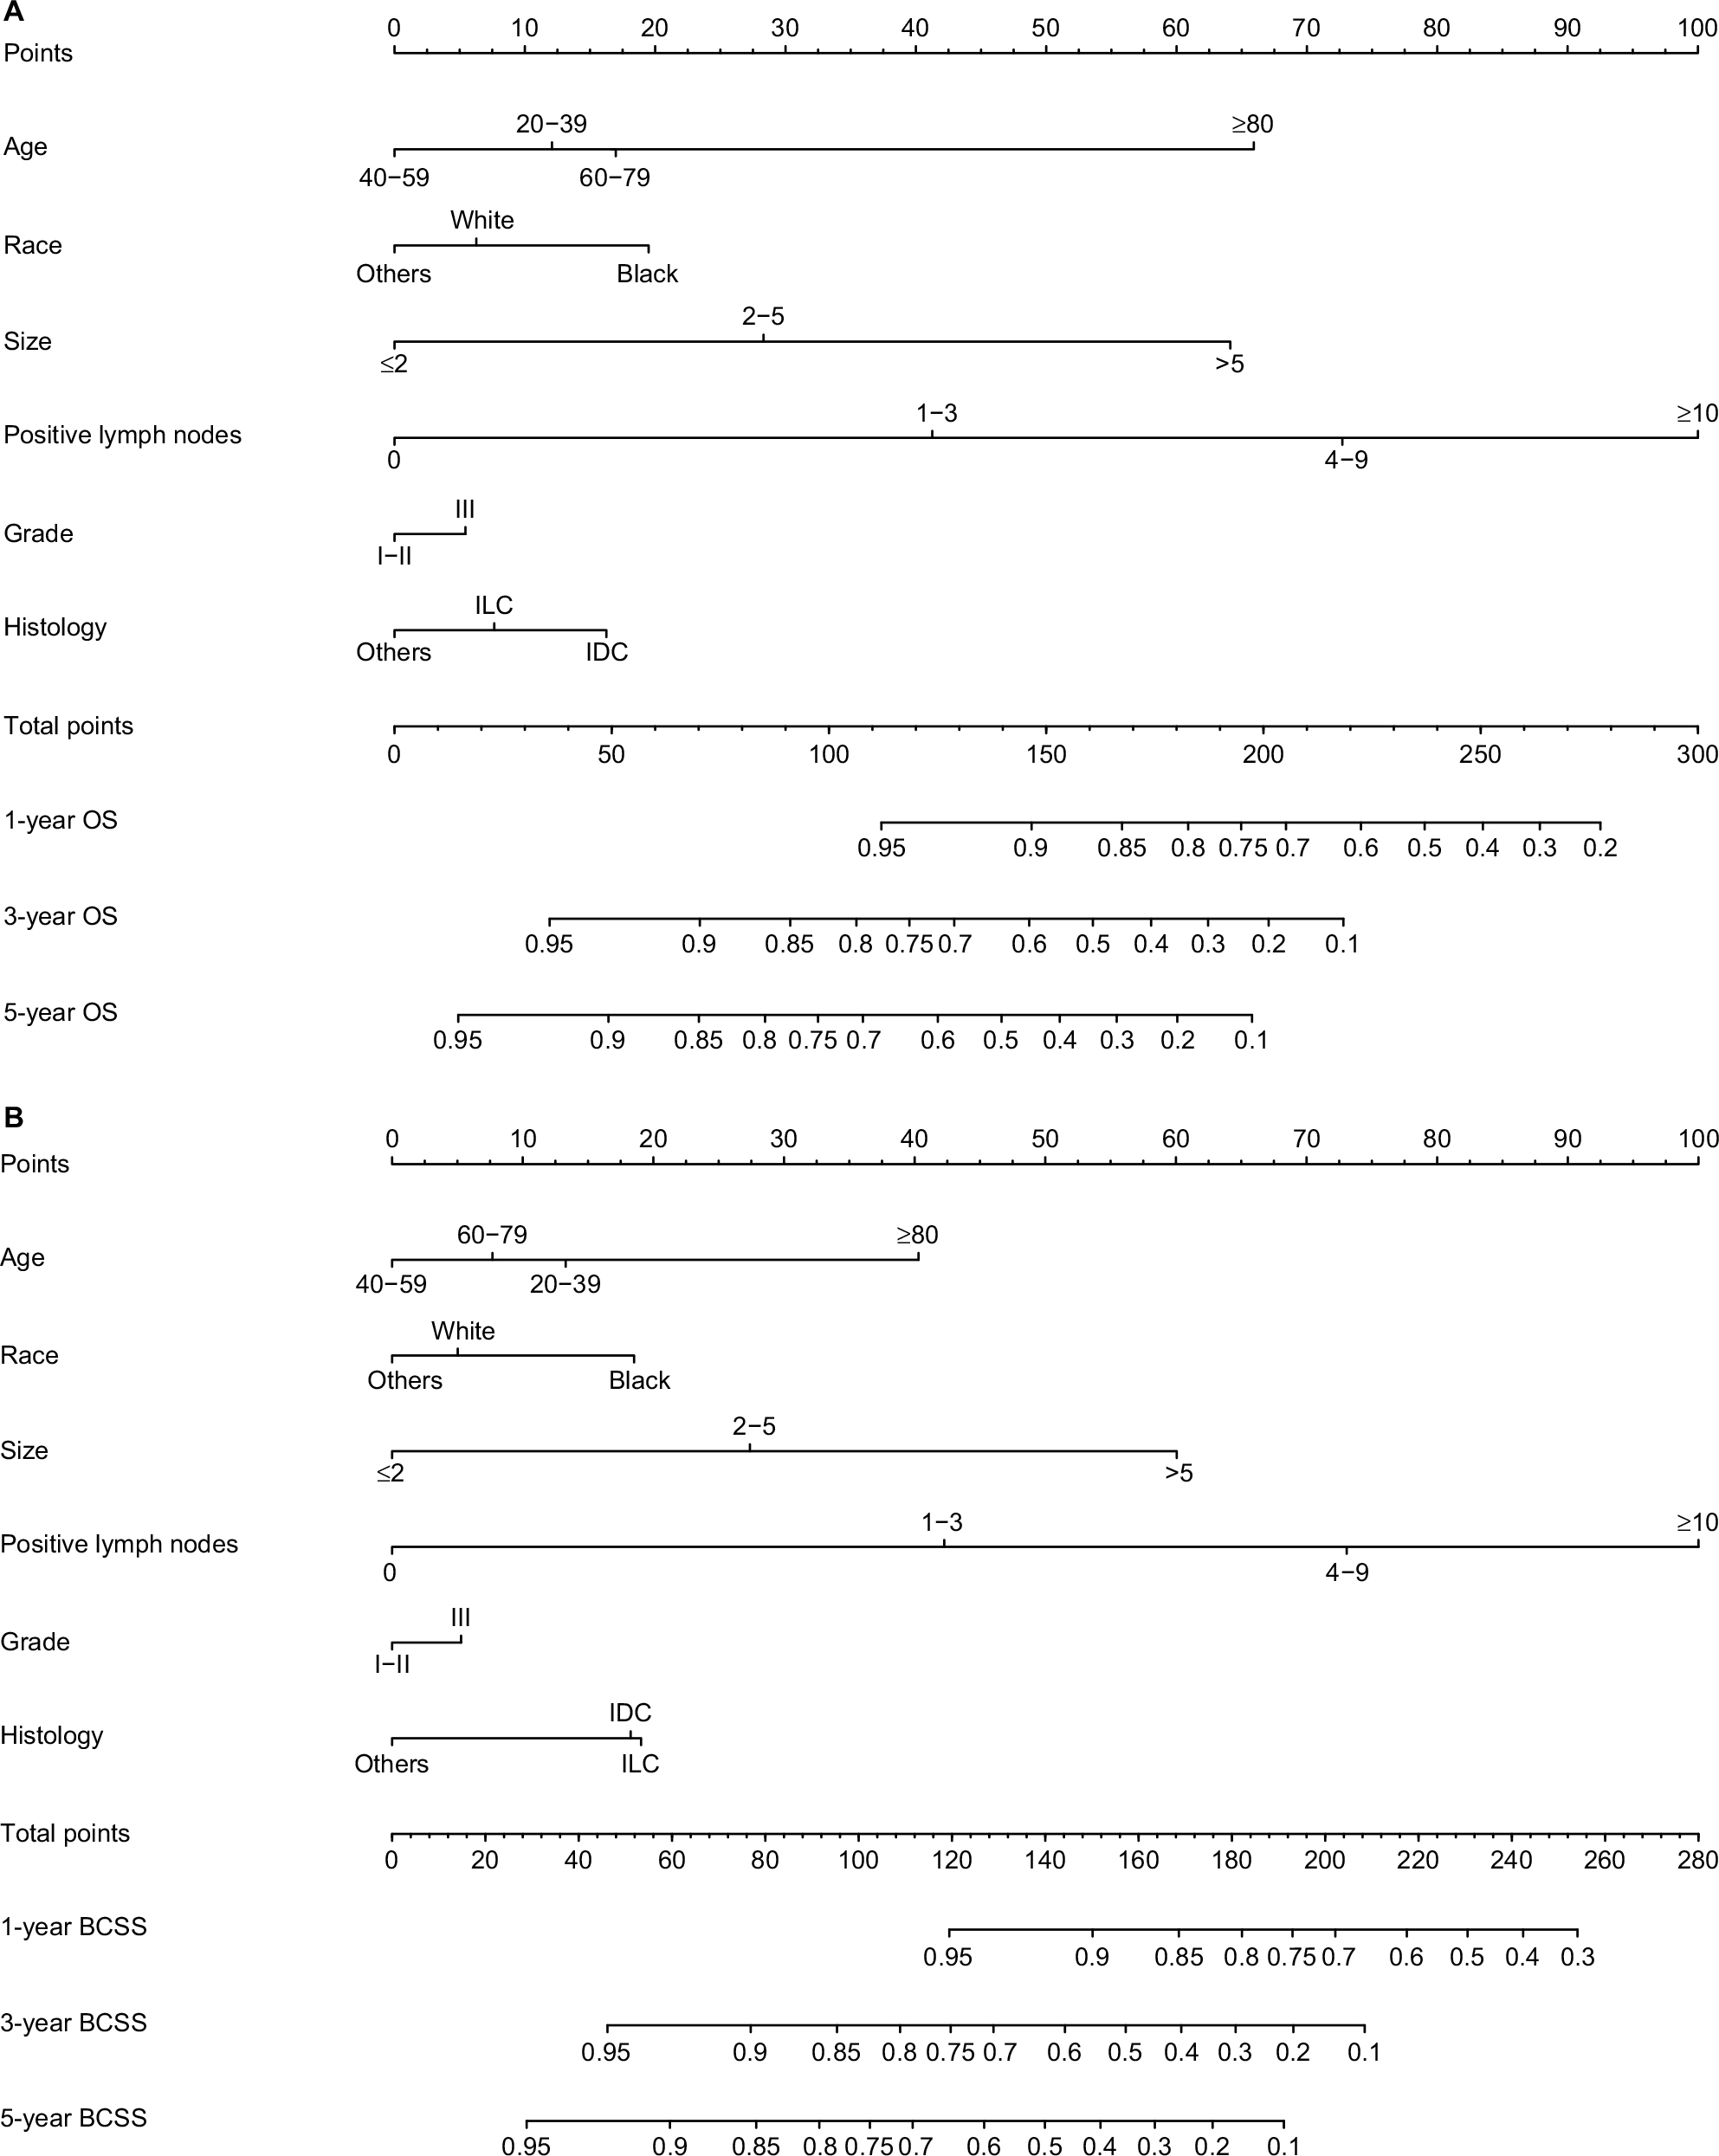 | Figure 1 Nomograms for predicting the 1-, 3-, and 5-year (A) OS and (B) BCSS of TNBC patients with independent prognostic factors. |
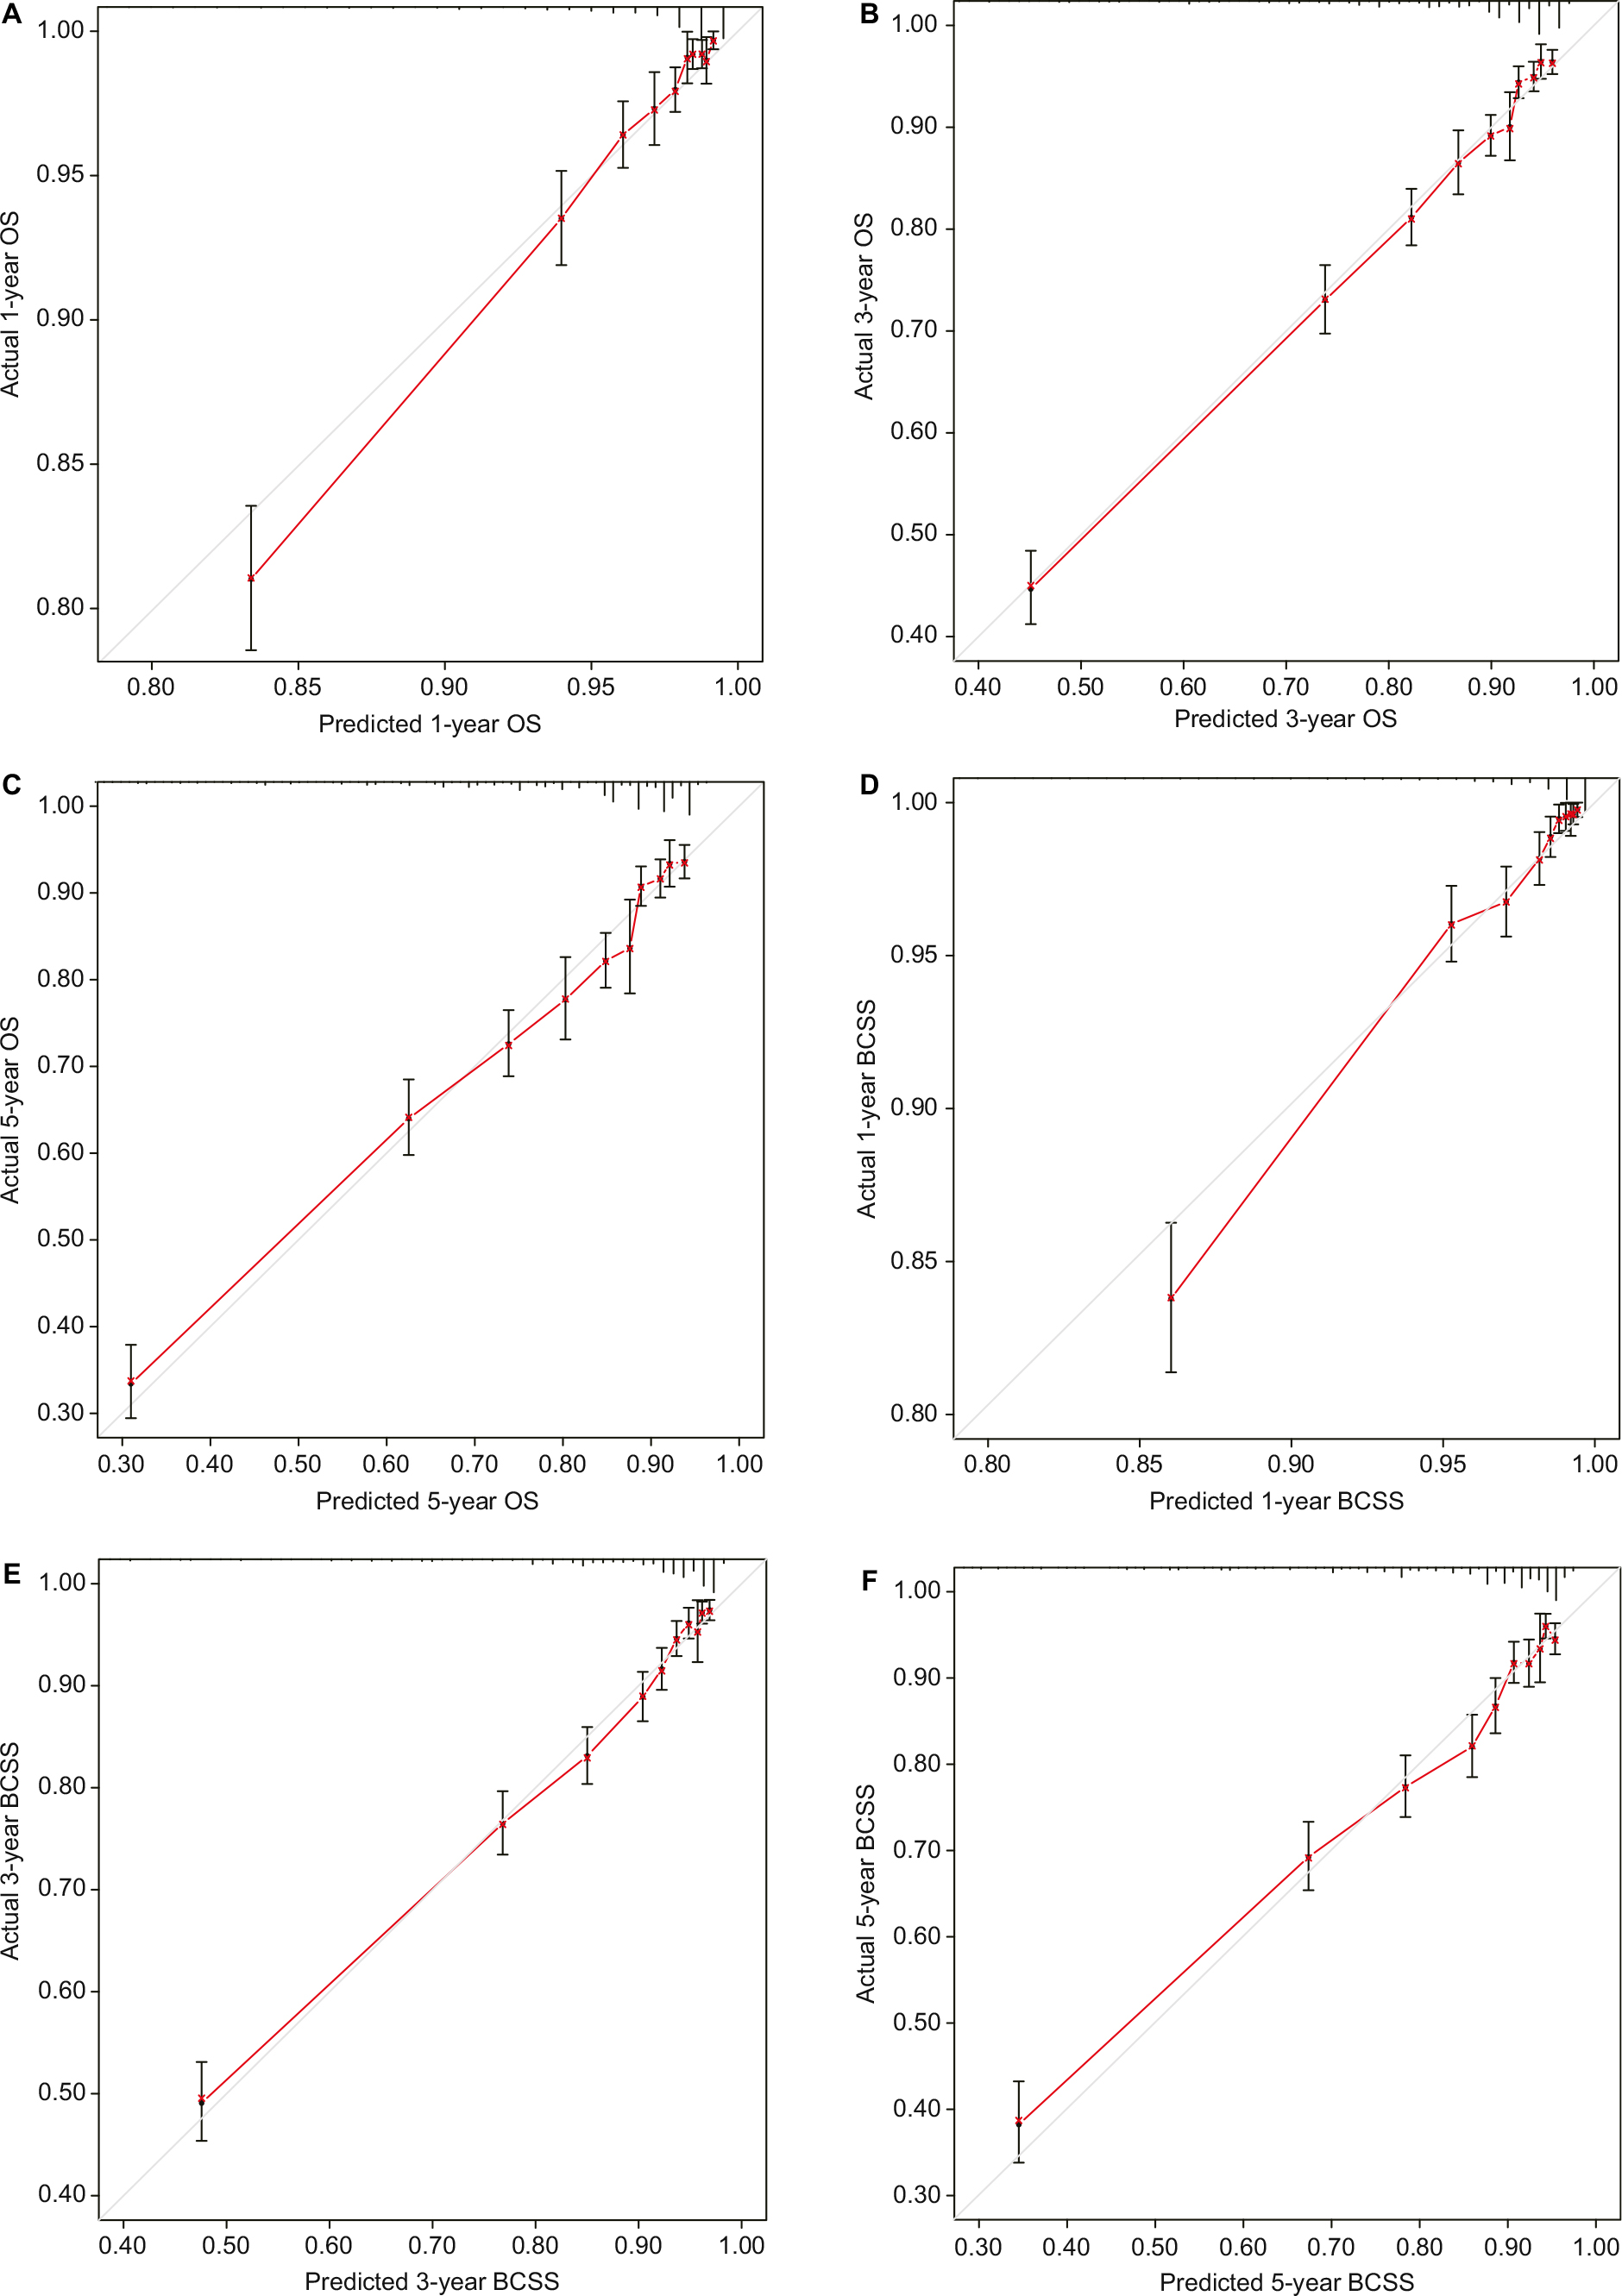 | Figure 2 Internal calibration curves for the 1-, 3-, and 5-year OS (A–C) and BCSS (D–F). Notes: The 45° line represents an ideal match between the actual survival (Y-axis) and the nomogram-predicted survival (X-axis). The perpendicular line indicates the 95% CIs. |
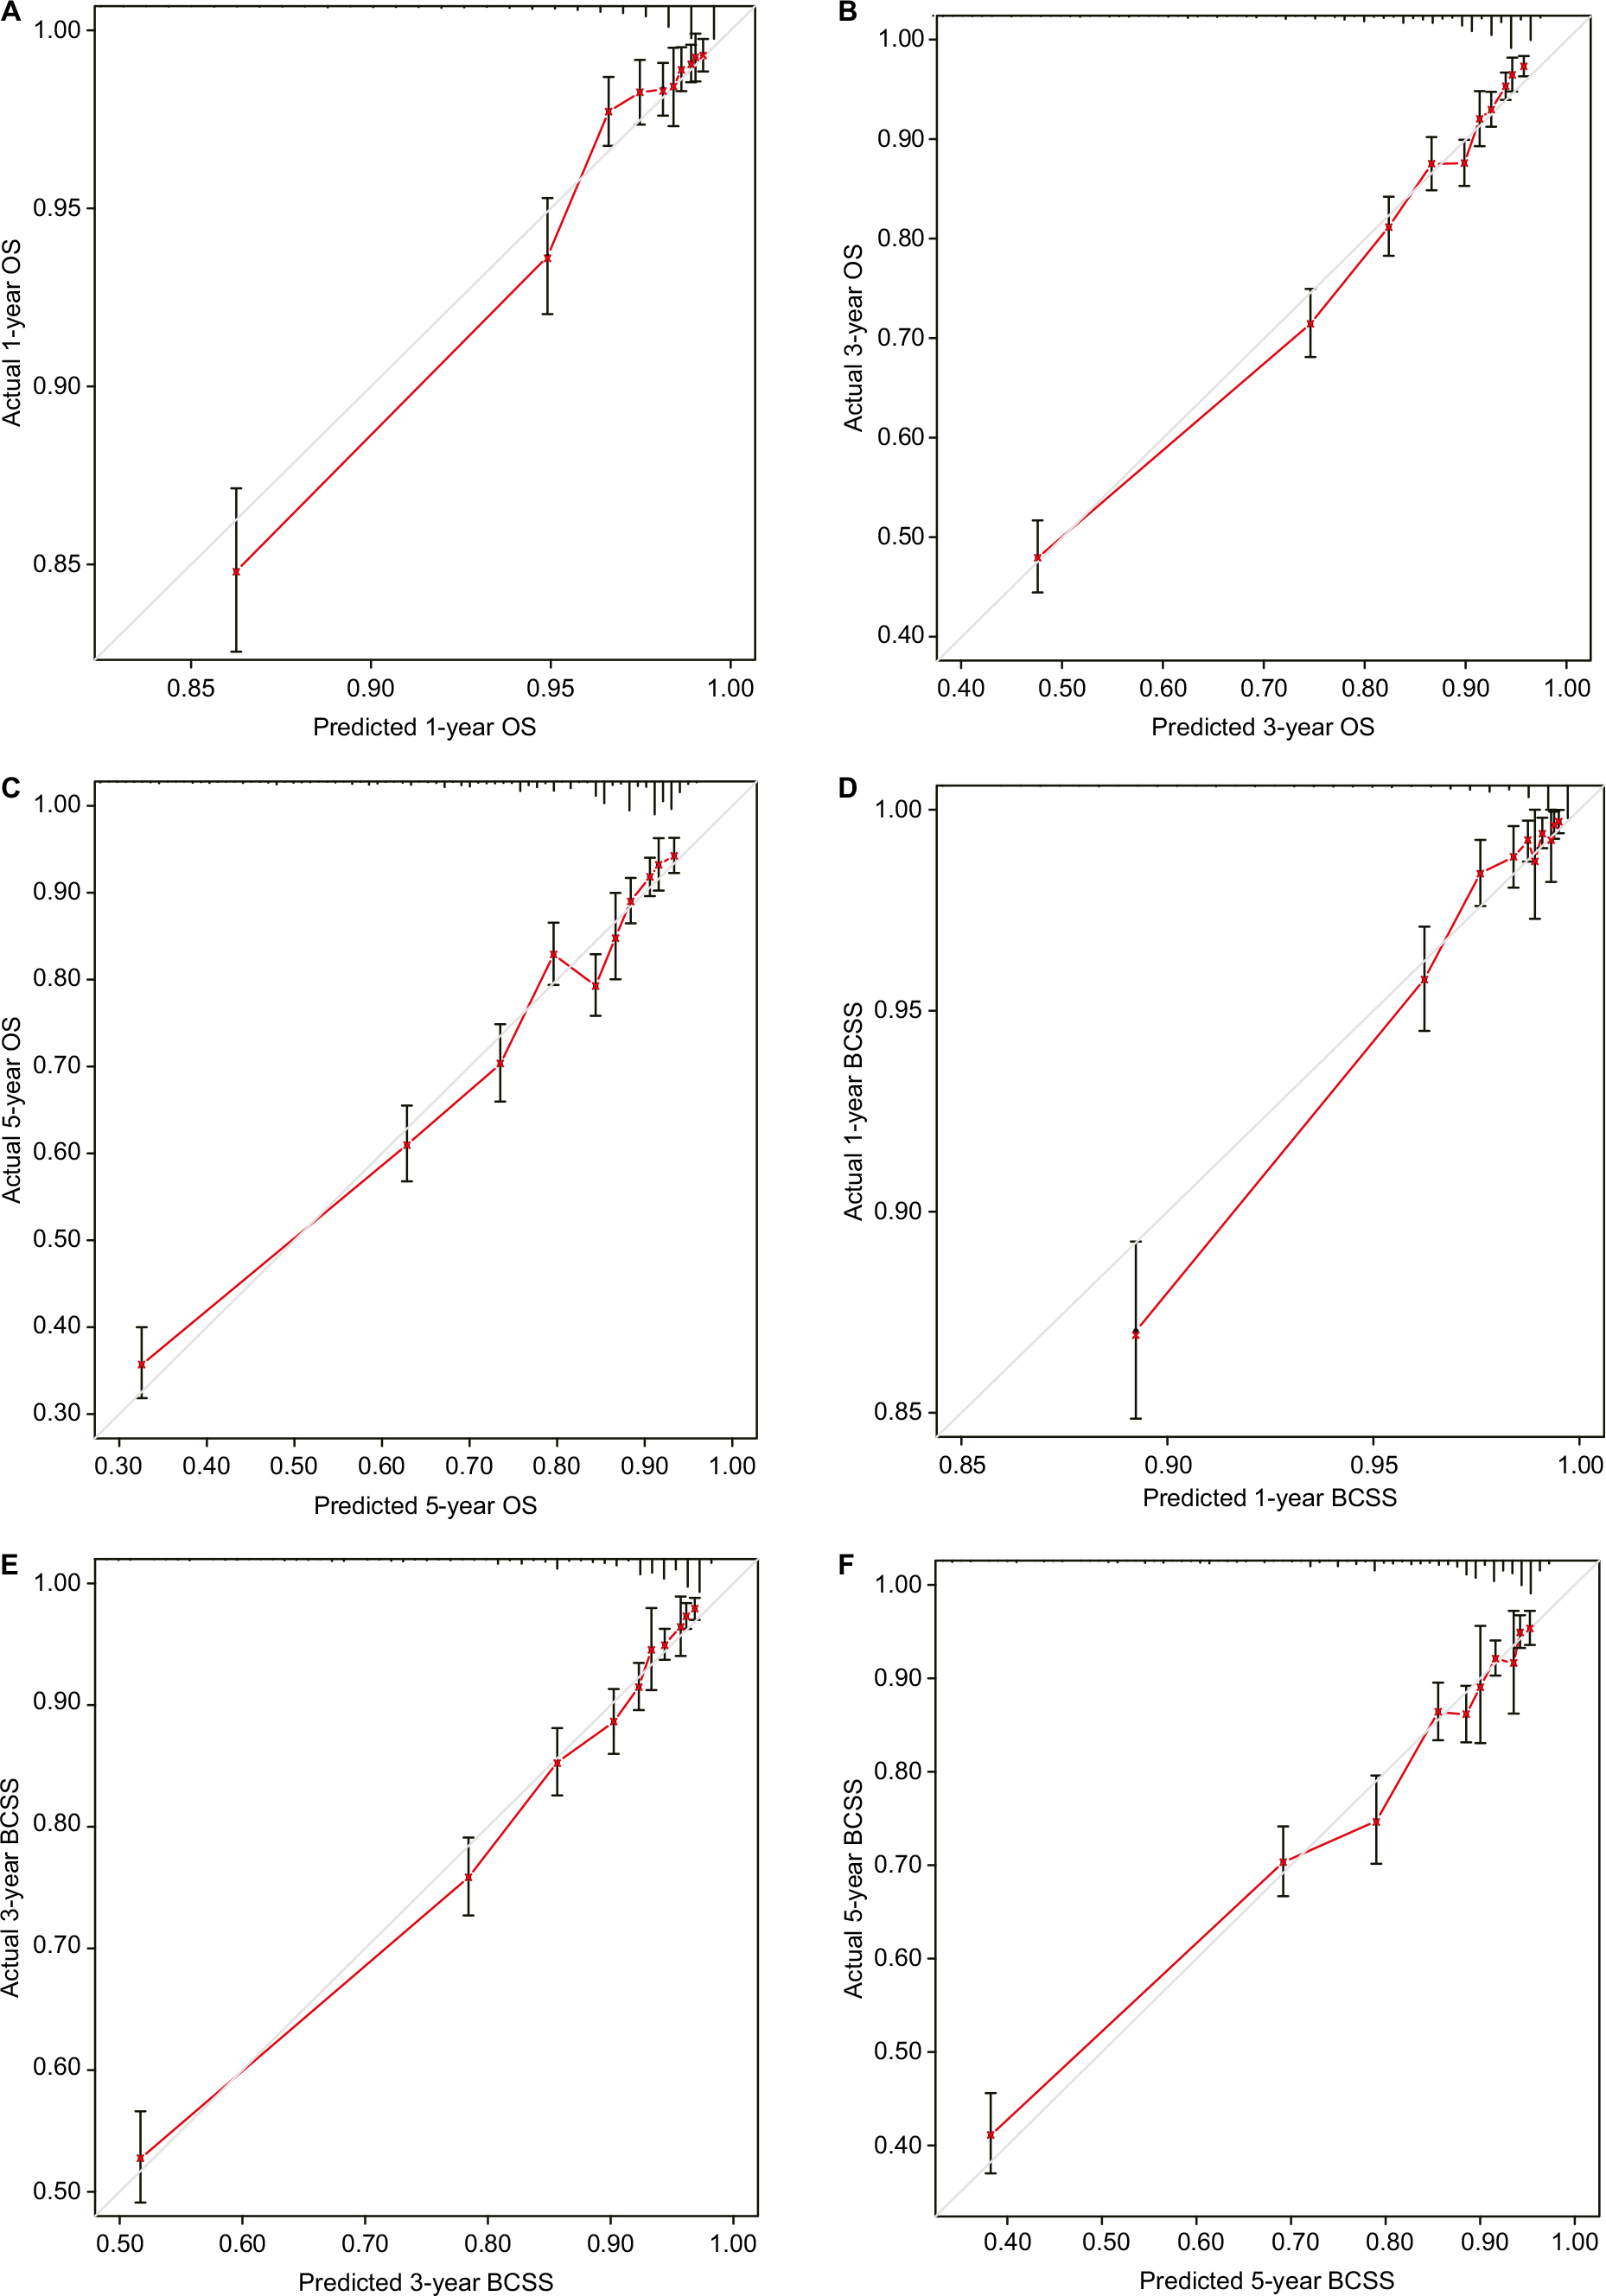 | Figure 3 External calibration curves for the 1-, 3-, and 5-year OS (A–C) and BCSS (D–F). Notes: The 45° line represents an ideal match between the actual survival (Y-axis) and the nomogram-predicted survival (X-axis). The perpendicular line indicates the 95% CIs. |
Comparison of nomograms
The C-index values of the TNM system nomograms for OS and BCSS were, respectively, 0.753 (95% CI, 0.740–0.767) and 0.781 (95% CI, 0.767–0.795) in the training cohort, which represented a statistically significant decrease (P<0.001) compared with the nomograms that included all independent prognostic factors. Significant differences in C-index value were also found in the validation cohort, with TNM system nomograms showing C-index values of 0.751 (95% CI, 0.737–0.765) for OS and 0.787 (95% CI, 0.773–0.801) for BCSS (P<0.001; Table S1).
To demonstrate the applied value of the nomograms that included all meaningful variables, two normal TNBC patients were used as examples. One patient was a 45-year-old, white, IDC patient with a 1 cm grade I tumor and five positive lymph nodes, while the other was a 65-year-old, black, IDC patient with a 6 cm grade III tumor and two positive lymph nodes. According to the nomograms consisting of tumor size (T) and number of positive lymph nodes (N) only (Figure S1), the first patient received 105 points with corresponding 1-, 3-, and 5-year OS probabilities of 0.85–0.90, 0.50–0.60, and 0.40–0.50 and 1-, 3-, and 5-year BCSS predictions of 0.90–0.95, 0.60, 0.40–0.50, respectively. The second patient received 70 points with significantly different 1-, 3-, and 5-year OS predictions of 0.90–0.95, 0.75–0.80, and 0.60–0.70 and 1-, 3-, and 5-year BCSS predictions of >0.95, 0.80–0.85, and 0.70–0.75, respectively. However, according to the nomograms including six prognostic factors, the first patient scored 127.5 points for both OS and BCSS, indicating that the 1-year OS and BCSS probabilities were greater than 0.90–0.95, those for 3-year OS and BCSS ranged from 0.70 to 0.75, and those for 5-year OS and BCSS were ~0.60. For the second patient, the respective OS and BCSS scores were 125 and 115 points, and the corresponding predictions for 1-, 3-, and 5-year OS and BCSS were very similar to the first patient. Although both patients had the same stage IIIA disease, the prognostic outcomes obtained by the TN nomograms were quite different. However, the nomograms containing six independent prognostic factors resulted in very similar predicted outcomes, which can be partially attributed to the patients’ individual clinicopathological characteristics.
Discussion
In the present study, 21,419 eligible patients with TNBC from the SEER database were enrolled and analyzed. Except for laterality, various independent prognostic factors, including age at diagnosis, race, tumor size, number of positive lymph nodes, grade, and histological subtype were closely correlated with the OS and BCSS outcomes of TNBC. We included these risk factors in the construction of nomograms, and both the C-index values and the calibration diagrams showed satisfactory robustness when applied to both internal and external validation cohorts. Due to the early metastasis and recurrence features of TNBC, it is imperative to establish a reliable prediction model to guide clinicians in accurately evaluating the patients’ condition and rapidly providing effective treatments in an individualized manner. However, no prognostic nomogram has been constructed to date for TNBC patients, and this was therefore a top priority in our study.
The log-rank test and Cox proportional hazards regression were used to identify the independent prognostic factors for OS, but these tools cannot be applied to BCSS because non-BC-specific death might preclude the possibility of death resulting from BC, and censoring these data could lead to biased results. Therefore, a competing risk model was introduced. In this study, the 1-, 3-, and 5-year probabilities of death were 3.6%, 14.9%, and 20.9%, respectively, and the 1-, 3-, and 5-year cumulative incidences of death from BC were 2.7%, 12.5%, and 17.1%, respectively, indicating a nearly four-fold higher risk of death attributed to BC than from other causes. In addition, the 3-year cumulative incidence of death resulting from BC was 3.6 times that of the 1-year incidence, while the 5-year probability of death from BC showed a 36.8% increase compared with the 3-year incidence. These results show strong concordance with the classical conclusions that TNBC is associated with an early peak of recurrence in the first 2 or 3 years after diagnosis, which becomes uncommon after 5 years.
Currently, the data are limited and conflicting regarding the prognostic impact of age in patients with TNBC. Two large Korean registry-based studies found that an age of <35 years was a poor prognosticator in patients with luminal or HER-2 overexpression BC subtypes but not in those with TNBC (HR, 1.21; 95% CI, 0.88–1.67; P=0.240).12 In contrast, in 1,732 patients with primary TNBC treated between 1982 and 2008, Liedtke et al13 reported that the median disease-free survival for patients aged 31–40 years was 4 years (95% CI, 2–5), whereas it was 8 years (95% CI, 5–14; P=0.0003) and 7 years (95% CI, 6, not reached) for patients aged 41–50 or 51–60 years at the time of diagnosis, respectively; these data are highly consistent with our study. In our nomograms, the HRs of OS and BCSS in different age groups formed a U-shaped curve, with younger and older patients experiencing worse survival while patients aged 40–59 years had the best survival. The unique gene expression profile of TNBC could explain this phenomenon, as specific proliferation-related and stroma-related gene signatures seem to be clinically relevant in patients aged ≤40 years as well as in the older age groups.14 In addition, as we know from previous studies, TNBC occurs more commonly in people of black ethnicities.8,9,15 In our study, black ethnicity also contributed to a particularly aggressive cancer behavior, which could be associated with parity, lack of breast-feeding initiation, and obesity as well as genomic differences that make TNBC in black patients more aggressive than TNBC in white patients,16–18 with several reports reaching the same conclusion.19–22
It has been reported that the association between nodal spread and tumor size is not present in TNBC, suggesting that the TNM staging system may not be sufficient for predicting therapeutic outcome in TNBC patients.23,24 In a retrospective cohort of 391 TNBC patients with 73.3 months of follow-up, the relapse-free survival curves generated by the TNM staging system were intermingled and showed overlap from stages I to IIIA, only substantially separating between stages I–IIIA and IIIB–IIIC.25 The eighth edition of the American Joint Committee on Cancer staging manual includes both the anatomic staging system and a newly proposed prognostic staging system that incorporates ER, PR, HER-2 status, and histological grade.26 Although TNBC patients are one stage higher than patients with luminal or HER-2 overexpression BC according to the eighth edition,27 the emergence of nonanatomic components of TNBC has allowed clinicians to understand why survival can vary greatly among TNBC patients of the same stage.28 Therefore, the development of a robust model including both the prognostic staging system and nonanatomic components is urgently needed to provide more accurate indications for prognosis and adjuvant treatments.
There are some limitations to our study. First, although information on radiation therapy and chemotherapy can be accessed from the SEER database, these data are not recommended to be included in the survival analysis due to the incompleteness of the variables and biases associated with who receives treatment according to the SEER program. The database also does not provide details of local recurrence, which prevented us from generating an individualized estimate of the risk of recurrence. Inherent biases are also unavoidable in any retrospective study, and thus, a large-scale, multicenter prospective investigation should be conducted to confirm our results. Third, the follow-up period was relatively short, as the data on HER-2 status were not available in the SEER database until 2010. Thus, we were only able to focus on the short-term prognosis of TNBC patients. Finally, although we randomly divided eligible patients into training and validation cohorts to evaluate the nomograms internally and externally, some deficiencies remained. It would be better to verify the nomograms prospectively or at least in another independent population-based database.
Conclusion
We found six independent prognostic factors (age at diagnosis, race, tumor size, number of positive lymph nodes, grade, and histological subtype) for OS and BCSS of TNBC patients and used these indicators to develop and validate two prognostic nomograms based on a large population cohort. Our developed nomograms performed excellently in both training and validation cohorts for predicting the 1-, 3-, and 5-year OS and BCSS, which may help clinicians evaluate patient prognosis and tailor individualized therapeutic regimens.
Abbreviations
AJCC, American Joint Committee on Cancer; BC, breast cancer; BCSS, BC-specific survival; CIF, cumulative incidence function; HER-2, human epidermal growth factor 2; IDC, infiltrating ductal carcinoma; ILC, infiltrating lobular carcinoma; OS, overall survival; SEER, Surveillance, Epidemiology, and End Results; TNBC, triple-negative breast cancer.
Acknowledgments
This study was supported by grants from the Ministry of Science and Technology of China (National Key R&D Program of China, MOST2016YFC0900300 to XH), the National Natural Science Foundation of China (81602311 to HL, 81672601 to XH), and the Shanghai Committee of Science and Technology Funds (15410724000 to XH, 18ZR1407500 to MH). The authors would like to thank the SEER program developers for providing open access to the database. The authors are also very grateful to Tian-Jian Yu for his help and support.
Disclosure
The authors report no conflicts of interest in this work.
References
Fitzmaurice C, Dicker D, Pain A. The global burden of cancer 2013 global burden of disease cancer collaboration. Jama Oncol. 2015;1(4):505–527. | ||
Hammond ME, Hayes DF, Dowsett M, et al. American Society of Clinical Oncology/College of American Pathologists guideline recommendations for immunohistochemical testing of estrogen and progesterone receptors in breast cancer. Arch Pathol Lab Med. 2010;134(6):907–922. | ||
Andreopoulou E, Schweber SJ, Sparano JA, McDaid HM. Therapies for triple negative breast cancer. Expert Opin Pharmacother. 2015;16(7):983–998. | ||
Foulkes WD, Smith IE, Reis-Filho JS. Triple-negative breast cancer. N Engl J Med. 2010;363(20):1938–1948. | ||
Dent R, Trudeau M, Pritchard KI, et al. Triple-negative breast cancer: clinical features and patterns of recurrence. Clin Cancer Res. 2007;13(15 Pt 1):4429–4434. | ||
Wang SL, Li YX, Song YW, et al. Triple-negative or HER2-positive status predicts higher rates of locoregional recurrence in node-positive breast cancer patients after mastectomy. Int J Radiat Oncol Biol Phys. 2011;80(4):1095–1101. | ||
Montagna E, Maisonneuve P, Rotmensz N, et al. Heterogeneity of triple-negative breast cancer: histologic subtyping to inform the outcome. Clin Breast Cancer. 2013;13(1):31–39. | ||
Dent R, Trudeau M, Pritchard KI, et al. Triple-negative breast cancer: clinical features and patterns of recurrence. Clin Cancer Res. 2007;13(15 Pt 1):4429–4434. | ||
Carey LA, Perou CM, Livasy CA, et al. Race, breast cancer subtypes, and survival in the Carolina Breast Cancer Study. JAMA. 2006;295(21):2492–2502. | ||
Fine JP, Gray RJ. A proportional hazards model for the subdistribution of a competing risk. J Am Stat Assoc. 1999;94(446):496–509. | ||
Gray RJ. A Class of $K$-sample tests for comparing the cumulative incidence of a competing risk. The Annals of Statistics. 1988;16(3):1141–1154. | ||
Kim EK, Noh WC, Han W, Noh DY. Prognostic significance of young age (<35 years) by subtype based on ER, PR, and HER2 status in breast cancer: a nationwide registry-based study. World J Surg. 2011;35(6):1244–1253. | ||
Liedtke C, Hess KR, Karn T, et al. The prognostic impact of age in patients with triple-negative breast cancer. Breast Cancer Res Treat. 2013;138(2):591–599. | ||
Azim HA, Michiels S, Bedard PL, et al. Elucidating prognosis and biology of breast cancer arising in young women using gene expression profiling. Clin Cancer Res. 2012;18(5):1341–1351. | ||
Bauer KR, Brown M, Cress RD, Parise CA, Caggiano V. Descriptive analysis of estrogen receptor (ER)-negative, progesterone receptor (PR)-negative, and HER2-negative invasive breast cancer, the so-called triple-negative phenotype: a population-based study from the California cancer Registry. Cancer. 2007;109(9):1721–1728. | ||
Ambrosone CB, Zirpoli G, Ruszczyk M, et al. Parity and breastfeeding among African-American women: differential effects on breast cancer risk by estrogen receptor status in the Women’s Circle of Health Study. Cancer Causes Control. 2014;25(2):259–265. | ||
Brewster AM, Chavez-Macgregor M, Brown P, Epidemiology BP. Epidemiology, biology, and treatment of triple-negative breast cancer in women of African ancestry. Lancet Oncol. 2014;15(13):e625–e634. | ||
Keenan T, Moy B, Mroz EA, et al. Comparison of the genomic landscape between primary breast cancer in African American versus white women and the association of racial differences with tumor recurrence. J Clin Oncol. 2015;33(31):3621–3627. | ||
Lund MJ, Trivers KF, Porter PL, et al. Race and triple negative threats to breast cancer survival: a population-based study in Atlanta, GA. Breast Cancer Res Treat. 2009;113(2):357–370. | ||
Bauer KR, Brown M, Cress RD, Parise CA, Caggiano V. Descriptive analysis of estrogen receptor (ER)-negative, progesterone receptor (PR)-negative, and HER2-negative invasive breast cancer, the so-called triple-negative phenotype: a population-based study from the California cancer Registry. Cancer. 2007;109(9):1721–1728. | ||
Carey LA, Perou CM, Livasy CA, et al. Race, breast cancer subtypes, and survival in the Carolina Breast Cancer Study. JAMA. 2006;295(21):2492–2502. | ||
Sachdev JC, Ahmed S, Mirza MM, Farooq A, Kronish L, Jahanzeb M. Does race affect outcomes in triple negative breast cancer? Breast Cancer. 2010;4:23–33. | ||
Amin MB, Greene FL, Edge SB, et al. The Eighth Edition AJCC Cancer Staging Manual: Continuing to build a bridge from a population-based to a more “personalized” approach to cancer staging. CA Cancer J Clin. 2017;67(2):93–99. | ||
Perou CM, Sørlie T, Eisen MB, et al. Molecular portraits of human breast tumours. Nature. 2000;406(6797):747–752. | ||
Park YH, Lee SJ, Cho EY, et al. Clinical relevance of TNM staging system according to breast cancer subtypes. Ann Oncol. 2011;22(7):1554–1560. | ||
Giuliano AE, Edge SB, Hortobagyi GN. Eighth edition of the AJCC cancer staging manual: breast cancer. Ann Surg Oncol. 2018;25(7):1783–1785. | ||
Giuliano AE, Connolly JL, Edge SB, et al. Breast Cancer-Major changes in the American Joint Committee on Cancer eighth edition cancer staging manual. CA Cancer J Clin. 2017;67(4):290–303. | ||
Bagaria SP, Ray PS, Sim MS, et al. Personalizing breast cancer staging by the inclusion of ER, PR, and HER2. JAMA Surg. 2014;149(2):125–129. |
Supplementary materials
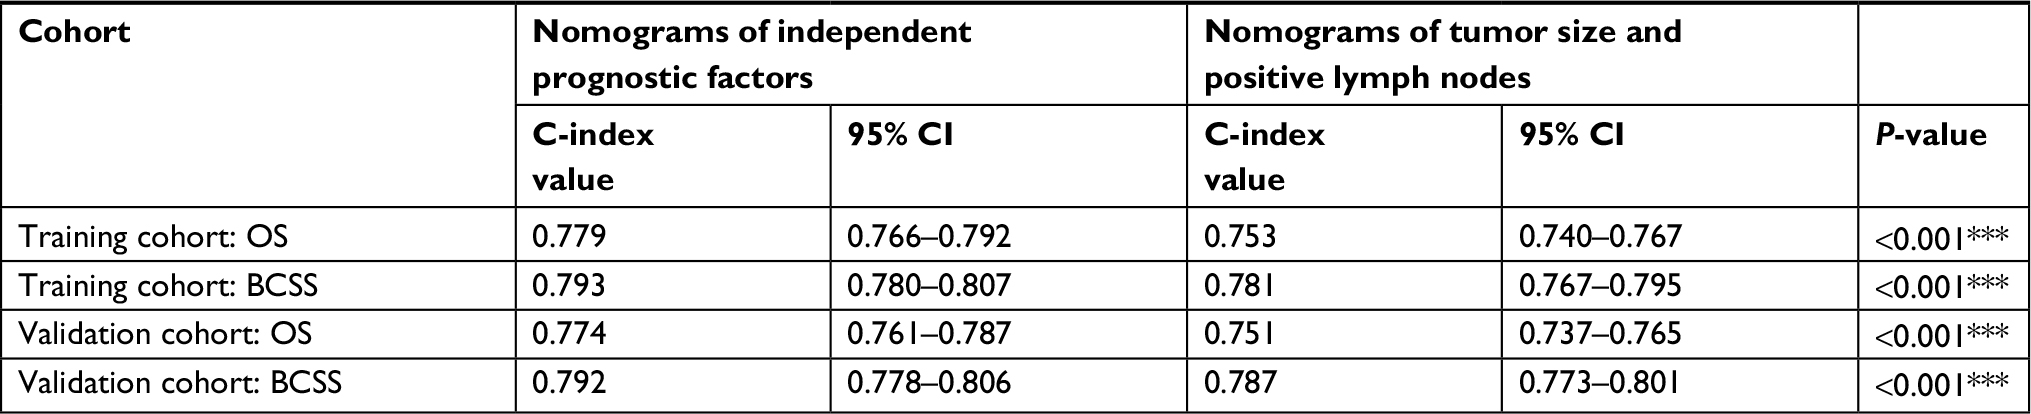 | Table S1 Comparison of C-index values between nomograms of independent prognostic factors and nomograms of tumor size and the number of positive lymph nodes Note: ***Two-sided P-values <0.001. |
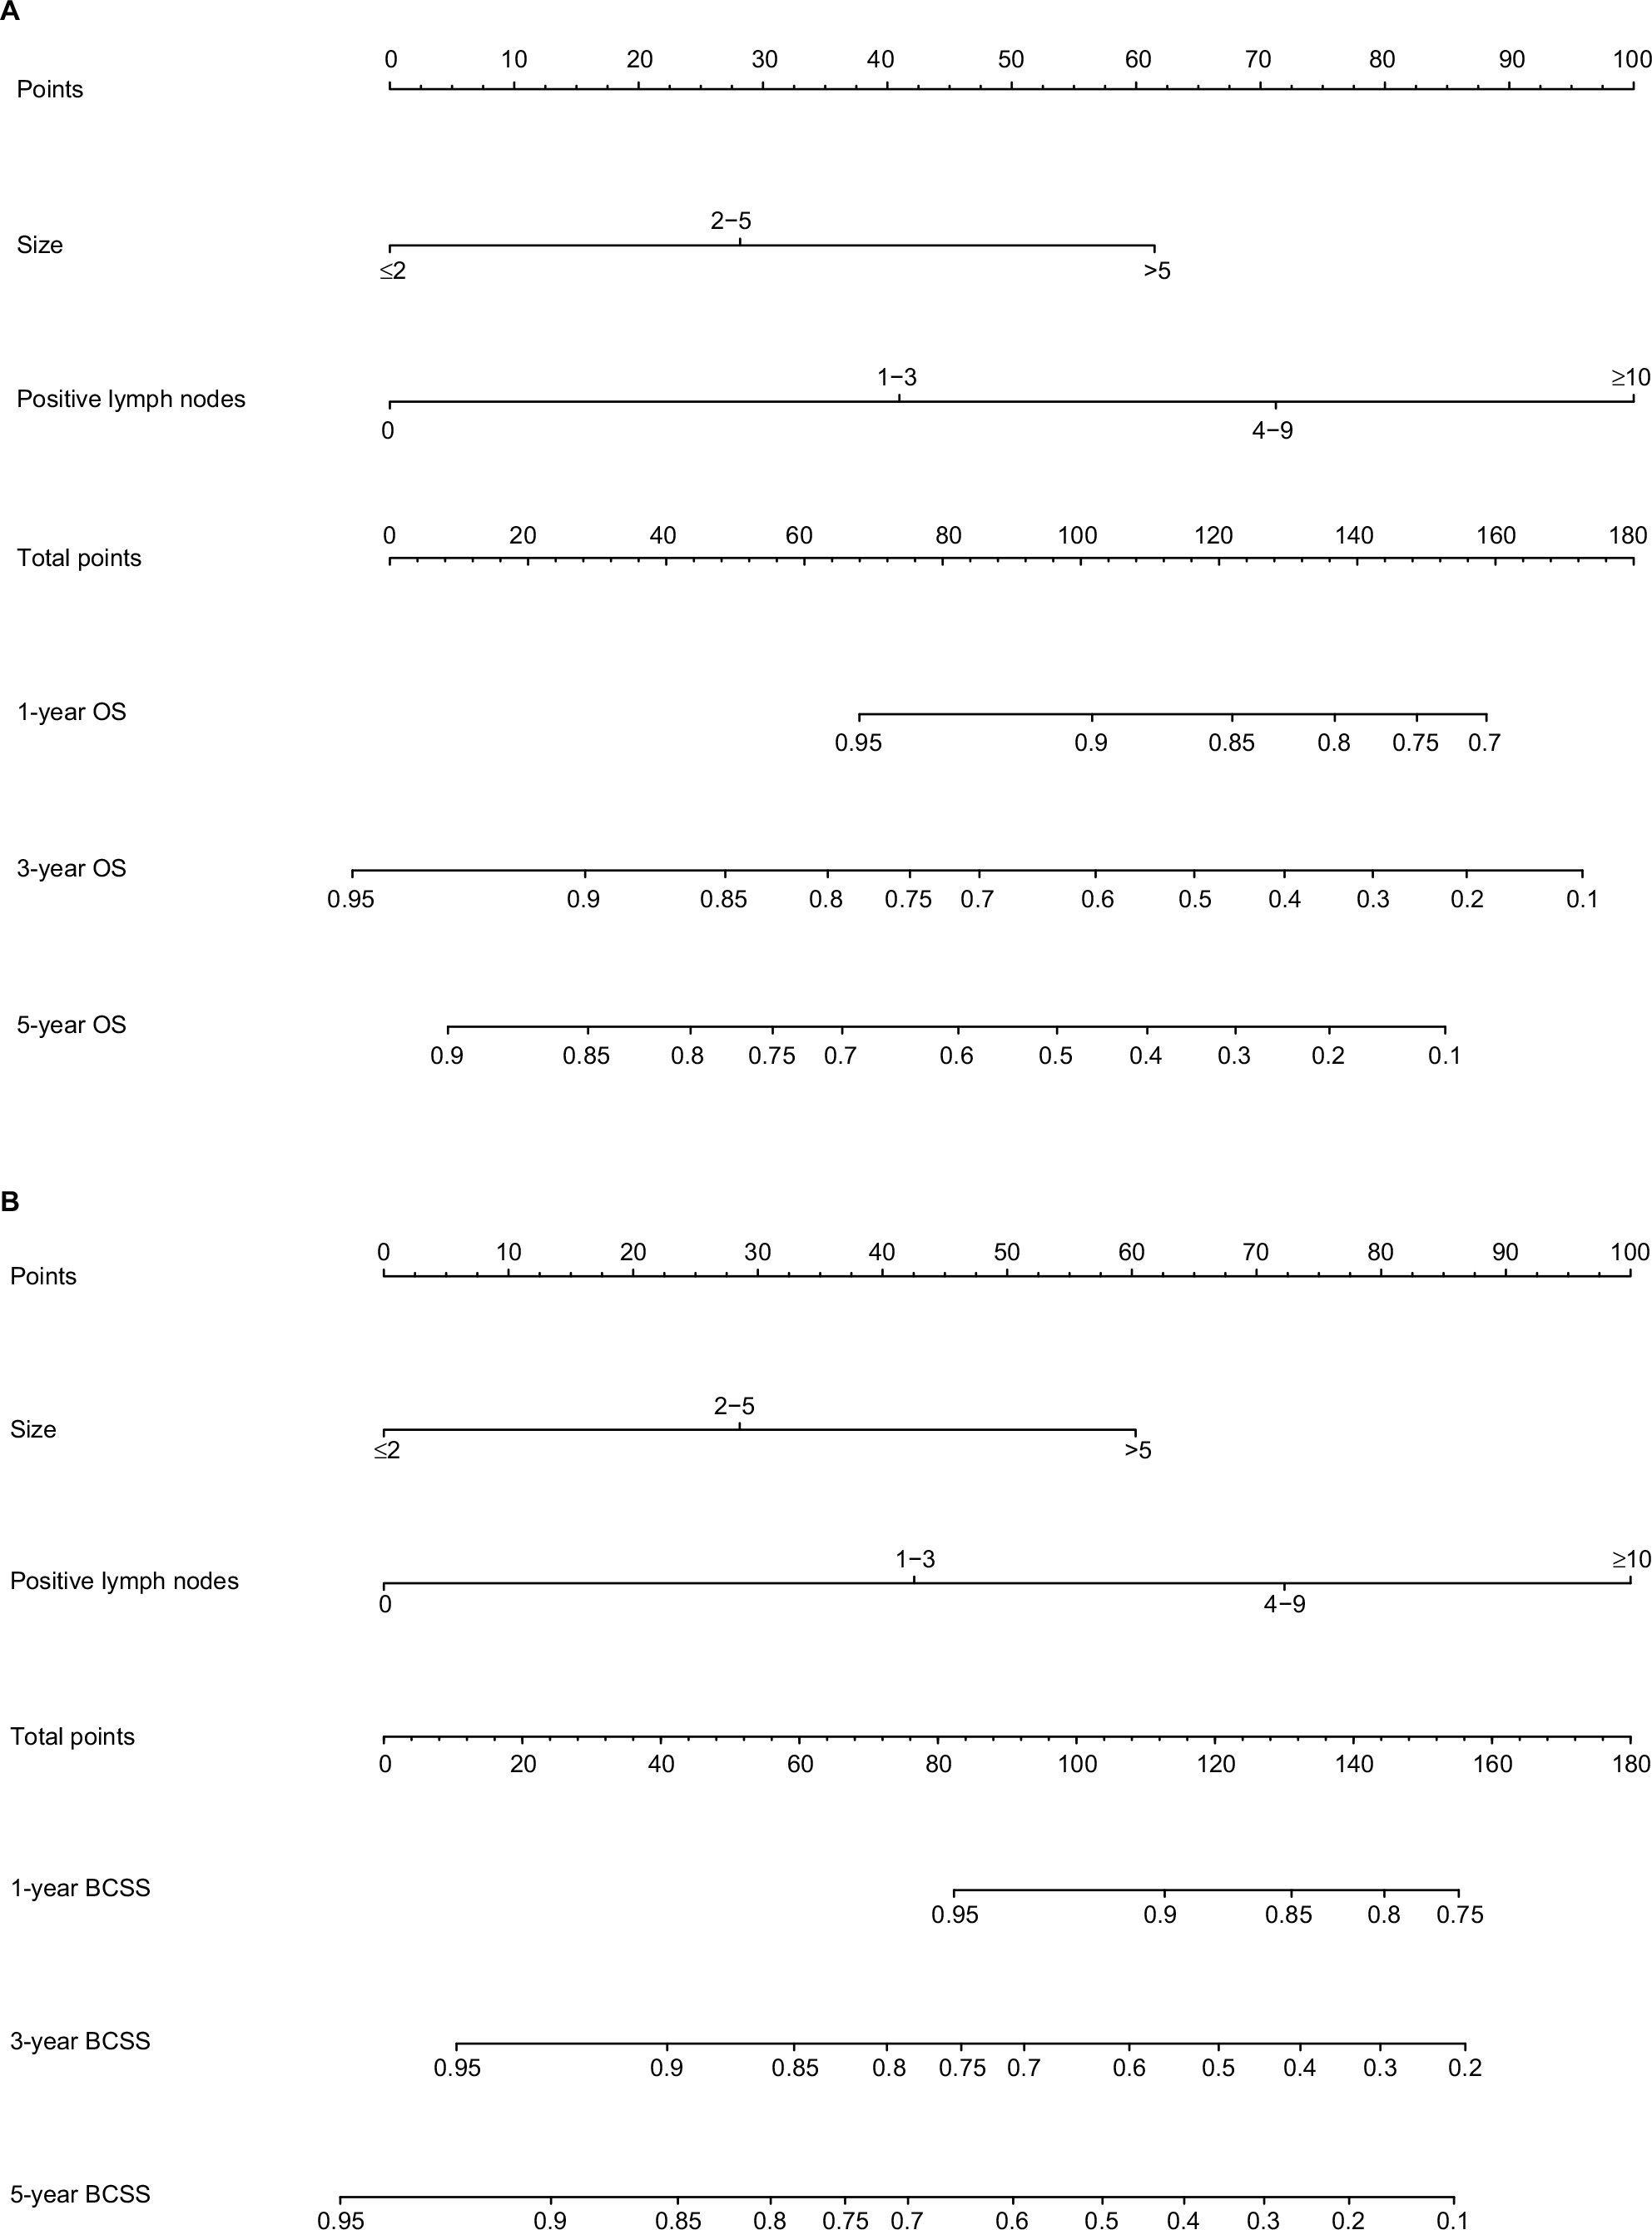 | Figure S1 Nomograms for predicting the 1-, 3-, and 5-year (A) OS and (B) BCSS of TNBC patients with tumor size and the number of positive lymph nodes. |
 © 2018 The Author(s). This work is published and licensed by Dove Medical Press Limited. The full terms of this license are available at https://www.dovepress.com/terms.php and incorporate the Creative Commons Attribution - Non Commercial (unported, v3.0) License.
By accessing the work you hereby accept the Terms. Non-commercial uses of the work are permitted without any further permission from Dove Medical Press Limited, provided the work is properly attributed. For permission for commercial use of this work, please see paragraphs 4.2 and 5 of our Terms.
© 2018 The Author(s). This work is published and licensed by Dove Medical Press Limited. The full terms of this license are available at https://www.dovepress.com/terms.php and incorporate the Creative Commons Attribution - Non Commercial (unported, v3.0) License.
By accessing the work you hereby accept the Terms. Non-commercial uses of the work are permitted without any further permission from Dove Medical Press Limited, provided the work is properly attributed. For permission for commercial use of this work, please see paragraphs 4.2 and 5 of our Terms.