")
Back to Journals » Cancer Management and Research » Volume 11
Development and validation of CT imaging–based preoperative nomogram in the prediction of unfavorable high-grade small renal masses
Authors Xie H, Li G, Liu K, Wang Z, Shang Z, Liu Z, Xiong Z, Quan C, Niu Y
Received 8 September 2018
Accepted for publication 7 December 2018
Published 25 September 2019 Volume 2019:11 Pages 8731—8741
DOI https://doi.org/10.2147/CMAR.S186914
Checked for plagiarism Yes
Review by Single anonymous peer review
Peer reviewer comments 2
Editor who approved publication: Professor Lu-Zhe Sun
Hui Xie,* Gang Li,* Kangkang Liu, Zhun Wang, Zhiqun Shang, Zihao Liu, Zhilei Xiong, Changyi Quan, Yuanjie Niu
Department of Urology, Tianjin Institute of Urology, The Second Hospital of Tianjin Medical University, Tianjin 300211, People’s Republic of China
*These authors contributed equally to this work
Correspondence: Yuanjie Niu
Department of Urology, Tianjin Institute of Urology, The Second Hospital of Tianjin Medical University, No. 23, Pingjiang Road, Hexi District, Tianjin 300211, People’s Republic of China
Tel +86 1 520 221 6807
Email [email protected]
Purpose: In recent years, there has been an increase in the incidence of small renal masses (SRMs) and nephrectomy was the standard management of this disease in the past. Currently, the use of active surveillance has been recommended as an alternative option in the case of some patients with SRMs due to its heterogenicity. However, limited studies focused on the regarding risk stratification. Therefore, in the current study, we developed a nomogram for the purpose of predicting the presence of high-grade SRMs on the basis of the patient information provided (clinical information, hematological indicators, and CT imaging data).
Patients and methods: A total of 329 patients (consisting of development and validation cohort) who had undergone nephrectomy for SRMs between January 2013 and May 2016 retrospectively were recruited for the present study. All preoperative information, including clinical predictors, hematological indicators, and CT predictors, were obtained. Lasso regression model was used for data dimension reduction and feature selection. Multivariable logistic regression analysis was applied for the establishment of the predicting model. The performance of the nomogram was assessed with respect to its calibration and discrimination properties and externally validated.
Results: The predictors used in the assessment of the nomogram included tumor size, CT tumor contour, CT necrosis, CT tumor exophytic properties, and CT collecting system oppression. Based on these parameters, the nomogram was evaluated to have an effective discrimination and calibration ability, and the C-index was found to be 0.883 after internal validation and 0.887 following external validation.
Conclusion: Based on the aforementioned findings, it can be concluded that CT imaging–based preoperative nomogram is an effective predictor of SRMs and hence can be used in the preoperative evaluation of SRMs, due to its calibration and discrimination abilities.
Keywords: renal cell carcinoma, small renal masses, SRMs, nomogram, tumor histology, CT
Introduction
Due to the widespread use of cross-sectional abdominal imaging over the last couple of decades, there has been an increase in the diagnosis of small renal masses (SRMs), which are tumors of 4 cm or less.1 However, previous studies have suggested that 20–30% of SRMs are benign, even the majority of the tumors of which were found to be low-grade cancers with a low-malignancy potential.2–4 Actually, American Society of Clinical Oncology Clinical Practice Guideline has recommended that active surveillance should be an initial management option for SRM patients who have significant comorbidities and limited life expectancy.5 Meanwhile, guidelines for renal mass and localized renal cancer provided by American Urological Association Education and Research also suggested that active surveillance has emerged as an initial management strategy for patients with cT1a (<4 cm). Not just those with limited life expectancy or poor performance status, active surveillance can also be an acceptable initial option for management in all patients when the oncologic risks are particularly low.6 However, there is a low specificity in defining high-risk patients. Previous studies suggested that tumor size and the grade of the tumors were significant clinical predictors for metastasis.2,7,8 Therefore, preoperative prediction of high-grade tumor is of high significance.
Currently, no urine or serum diagnostic markers have been reported for the diagnosis of renal cell carcinoma (RCC). The application of renal mass biopsy (RMB) has increased in recent years but this method has limited accuracy when detecting high-grade and potentially aggressive tumors.9–11 Therefore, the limited but potentially useful information of the characteristics and radiographic characteristics of patients are becoming increasingly significant. There has been accumulating evidence highlighting the potential relationship that might exist between hematological indicators and histological subtype of renal masses. Saroha et al reported that a low absolute lymphocyte count (ALC) was associated with the high-grade pathological type in patients with clear cell renal carcinoma.12 Moreover, Karlo et al developed a nomogram with a concordance index of 0.829 based on the analysis of clinical and CT data to determine treatment regimens for indolent renal cortical tumors before treatment.13
The technique of nomogram has been applied and validated in patients with variable tumor sizes and clinical stages. However, the greatest value of the nomogram would lie in differentiating between benign vs malignant and high-grade vs low-grade tumors in patients with SRMs. Fuhrman grade is the most significant prognostic variable to predict clinical outcomes in renal cancers, and it is also an independent risk factor predicting prognosis in major surgical series.14 Herein, we construct a nomogram for patients with SRMs to predict the high-grade histopathological subtype based on the clinical and CT characteristics of patients.
Materials and methods
Patients
The experimental protocols of the present study had been approved by our institutional review board. The included patients were diagnosed with SRMs (tumors 4 cm or less) who had undergone nephrectomy (radical or partial) at our institution between January 2013 and May 2016. Patients with multiple masses, where metastasis is detected or suspected, were excluded from the study. A total of 329 patients whose preoperative imaging and hematological indicators were available within 1 week prior to surgery were included in the cohort study. The total cohort subjects were then randomly assigned to the development cohort (217 patients) and validation cohort (112 patients) groups. The final model was assessed by development cohort, followed by the external validation in the validation cohort. The study was approved by the research ethics committee of Tianjin medical university. Written informed consents were obtained from patients before enrolling into the study. We also have complied with the World Medical Association Declaration of Helsinki regarding the ethical conduct of research involving human subjects.
The clinical presentations of patients were categorized as symptomatic or asymptomatic. Tumors with manifestations, including hematuria, pain, and fever or weight loss, were identified as symptomatic. Tumors with Fuhrman grade I and II or benign pathology were classified as low grade as well as indolent tumors. Grade III and IV neoplasms, sarcomatoid features, and papillary type II presence were defined as high grade as well as aggressive tumors. Histological subtype and Fuhrman grade of all tumors were assessed by board-certified pathologists in our institutional.
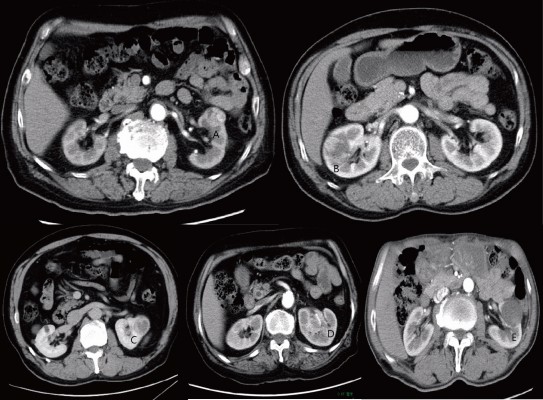
All CT images consisted of nonenhanced imaging of the abdomen as well as contrast-enhanced imaging that were obtained during the nephrographic and urographic phases following the administration of iodinated contrast agent. All CT data were analyzed by board-certified radiologists without any knowledge of clinical or histopathological features. The criteria of the radiographic features had been previously introduced.13 In this study, the features were as follows:
- The largest tumor diameter on the CT imaging;
- The presence of necrosis (a tumor was deemed as necrotized if ill-defined; hypodense areas of the tumor did not enhance at all during the nephrographic and urographic phase);
- Tumor’s contour, recorded as either ill-defined or well-defined (ill-defined tumor contour was recorded if the tumor was not clearly delineated from all adjacent anatomical structures during the nephrographic phrase);
- Tumor exophytic properties were defined as the tumor contour profile highlighting the outline of the kidney on CT imaging.
- CT collecting system oppression was defined as direct contact and oppression between the tumor and the collecting system.
Figure 1 Illustrates examples of all the features.
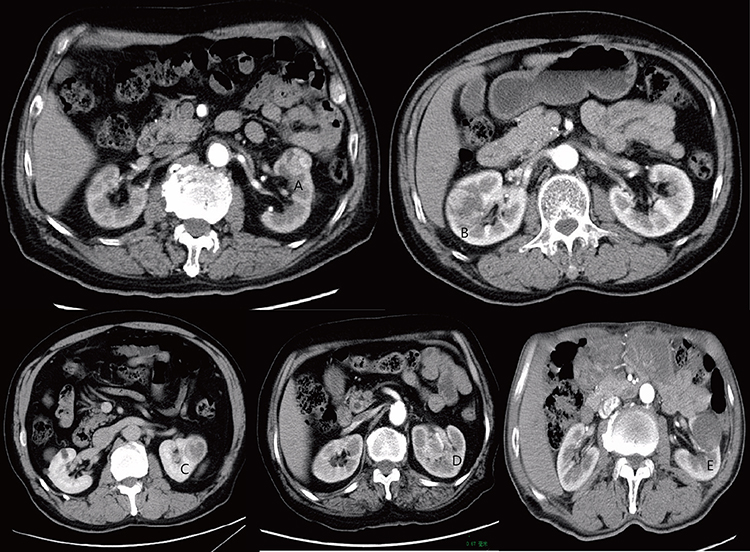 |
Figure 1 Predictive features on CT imaging as assessed: (A and B) exophytic properties; (C) necrosis and well-defined tumor contour; (D) ill-defined tumor contour; and (E) collecting system oppression. |
The purpose of this study was to design a preoperative nomogram for the prediction of the unfavorable high-grade histopathological subtype of SRMs. The clinical predictors (i.e., age, gender, body mass index (BMI), presentation mode), hematological indicators (i.e., ALC, neutrophil-to-lymphocyte ratio (NLR)), and predictors derived from CT imaging (i.e., tumor size, necrosis, tumor contour, tumor exophytic properties, collecting system oppression) were combined in order to evaluate the prediction model.
Statistical analysis
Fisher’s exact test was applied to assess the differences between high-grade and low-grade tumors with respect to the distribution of gender, presentation mode, necrosis, tumor contour, tumor exophytic properties, and collecting system oppression. Wilcoxon rank sum test was applied to analyze the differences in age, BMI, tumor size, ALC, and NLR between patients with high-grade tumors and those with low-grade tumors. The least absolute shrinkage and selection operator (LASSO) method was adopted to select the most effective predictive features based on the development cohort due to its performance in the regression of high-dimensional data.15 Multivariable logistic regression analysis was then performed for the development of the diagnostic model to predict high-grade tumors. To improve the quality of the quantitative tool, we developed a nomogram on the basis of multivariable logistic analysis in the development cohort. Calibration curves were plotted to assess the calibration of the nomogram. External validation was performed with the use of the data obtained from the validation cohort. The C-index was employed as an indicator to present predictive accuracy, which is critical for the area under the receiver operating characteristic curve. The C-index ranges from 0.5 (equivalent to a coin toss) to 1 (perfect prediction).
Statistical analysis was conducted with R software (version3.4.4; http://www.Rproject.org). Two-sided p-values <0.05 were considered to indicate statistically significant differences.
Results
Associations of clinical predictors with histopathological subtype of tumors
Table1 shows the demographic and histopathological information on 329 patients with SRM treated with nephrectomy. The clinical, hematological and CT characteristics of all patients that were taken into consideration during the development and validation of the cohort are summarized in Table 2. There were no significant differences in the prevalence of high-grade tumors between the two cohorts. No significant differences were observed in gender (p=0.155), age (p=0.580), BMI (p=0.064), and clinical presentation mode (p=0.113) between the patients with high-grade tumors and those with low-grade tumors. No significant differences were found in ALC (p=0.154) and NLR (p=0.064) between patients with high-grade tumors and those with low-grade tumors. However, low-grade tumors were significantly smaller than high-grade tumors (2.9±0.8 cm vs 3.5±0.4 cm; p<0.001). As for the predictors derived from CT imaging, the presence of necrosis, ill-defined tumor contour, tumor exophytic properties, and collecting system oppression was significantly associated with high-grade tumors (all p≤0.05, Table 2).
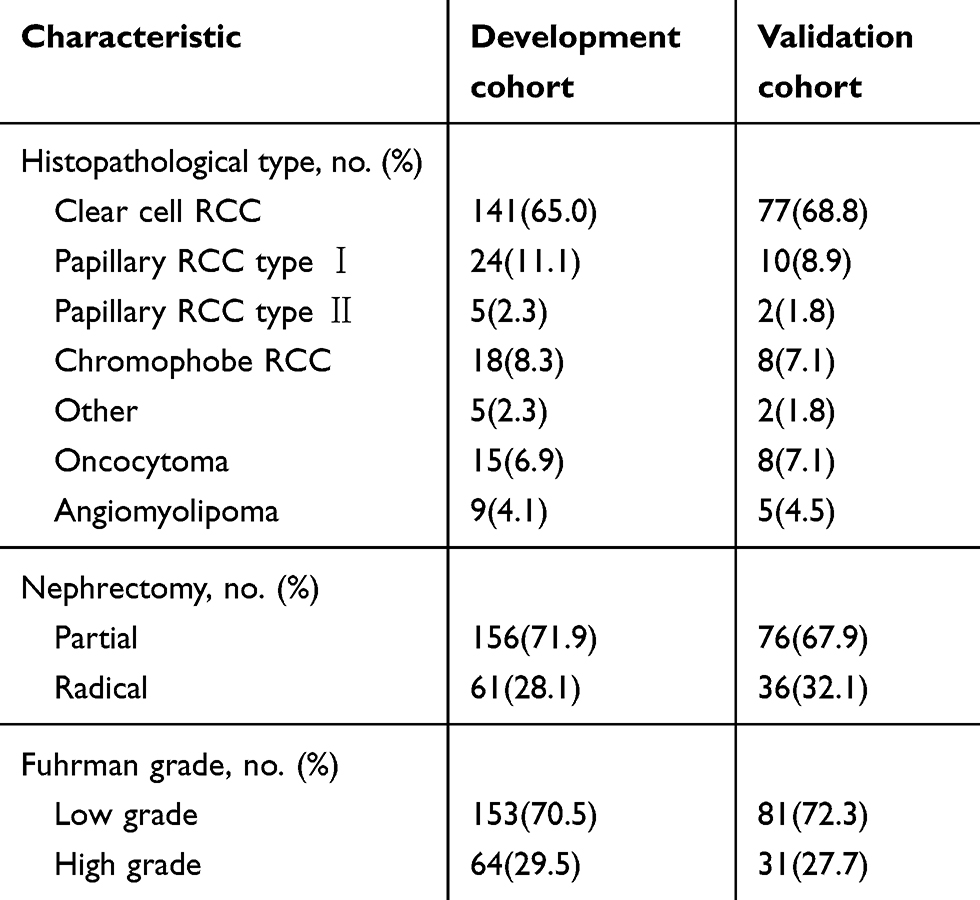 |
Table 1 Demographic and histopathological information on development and validation cohort |
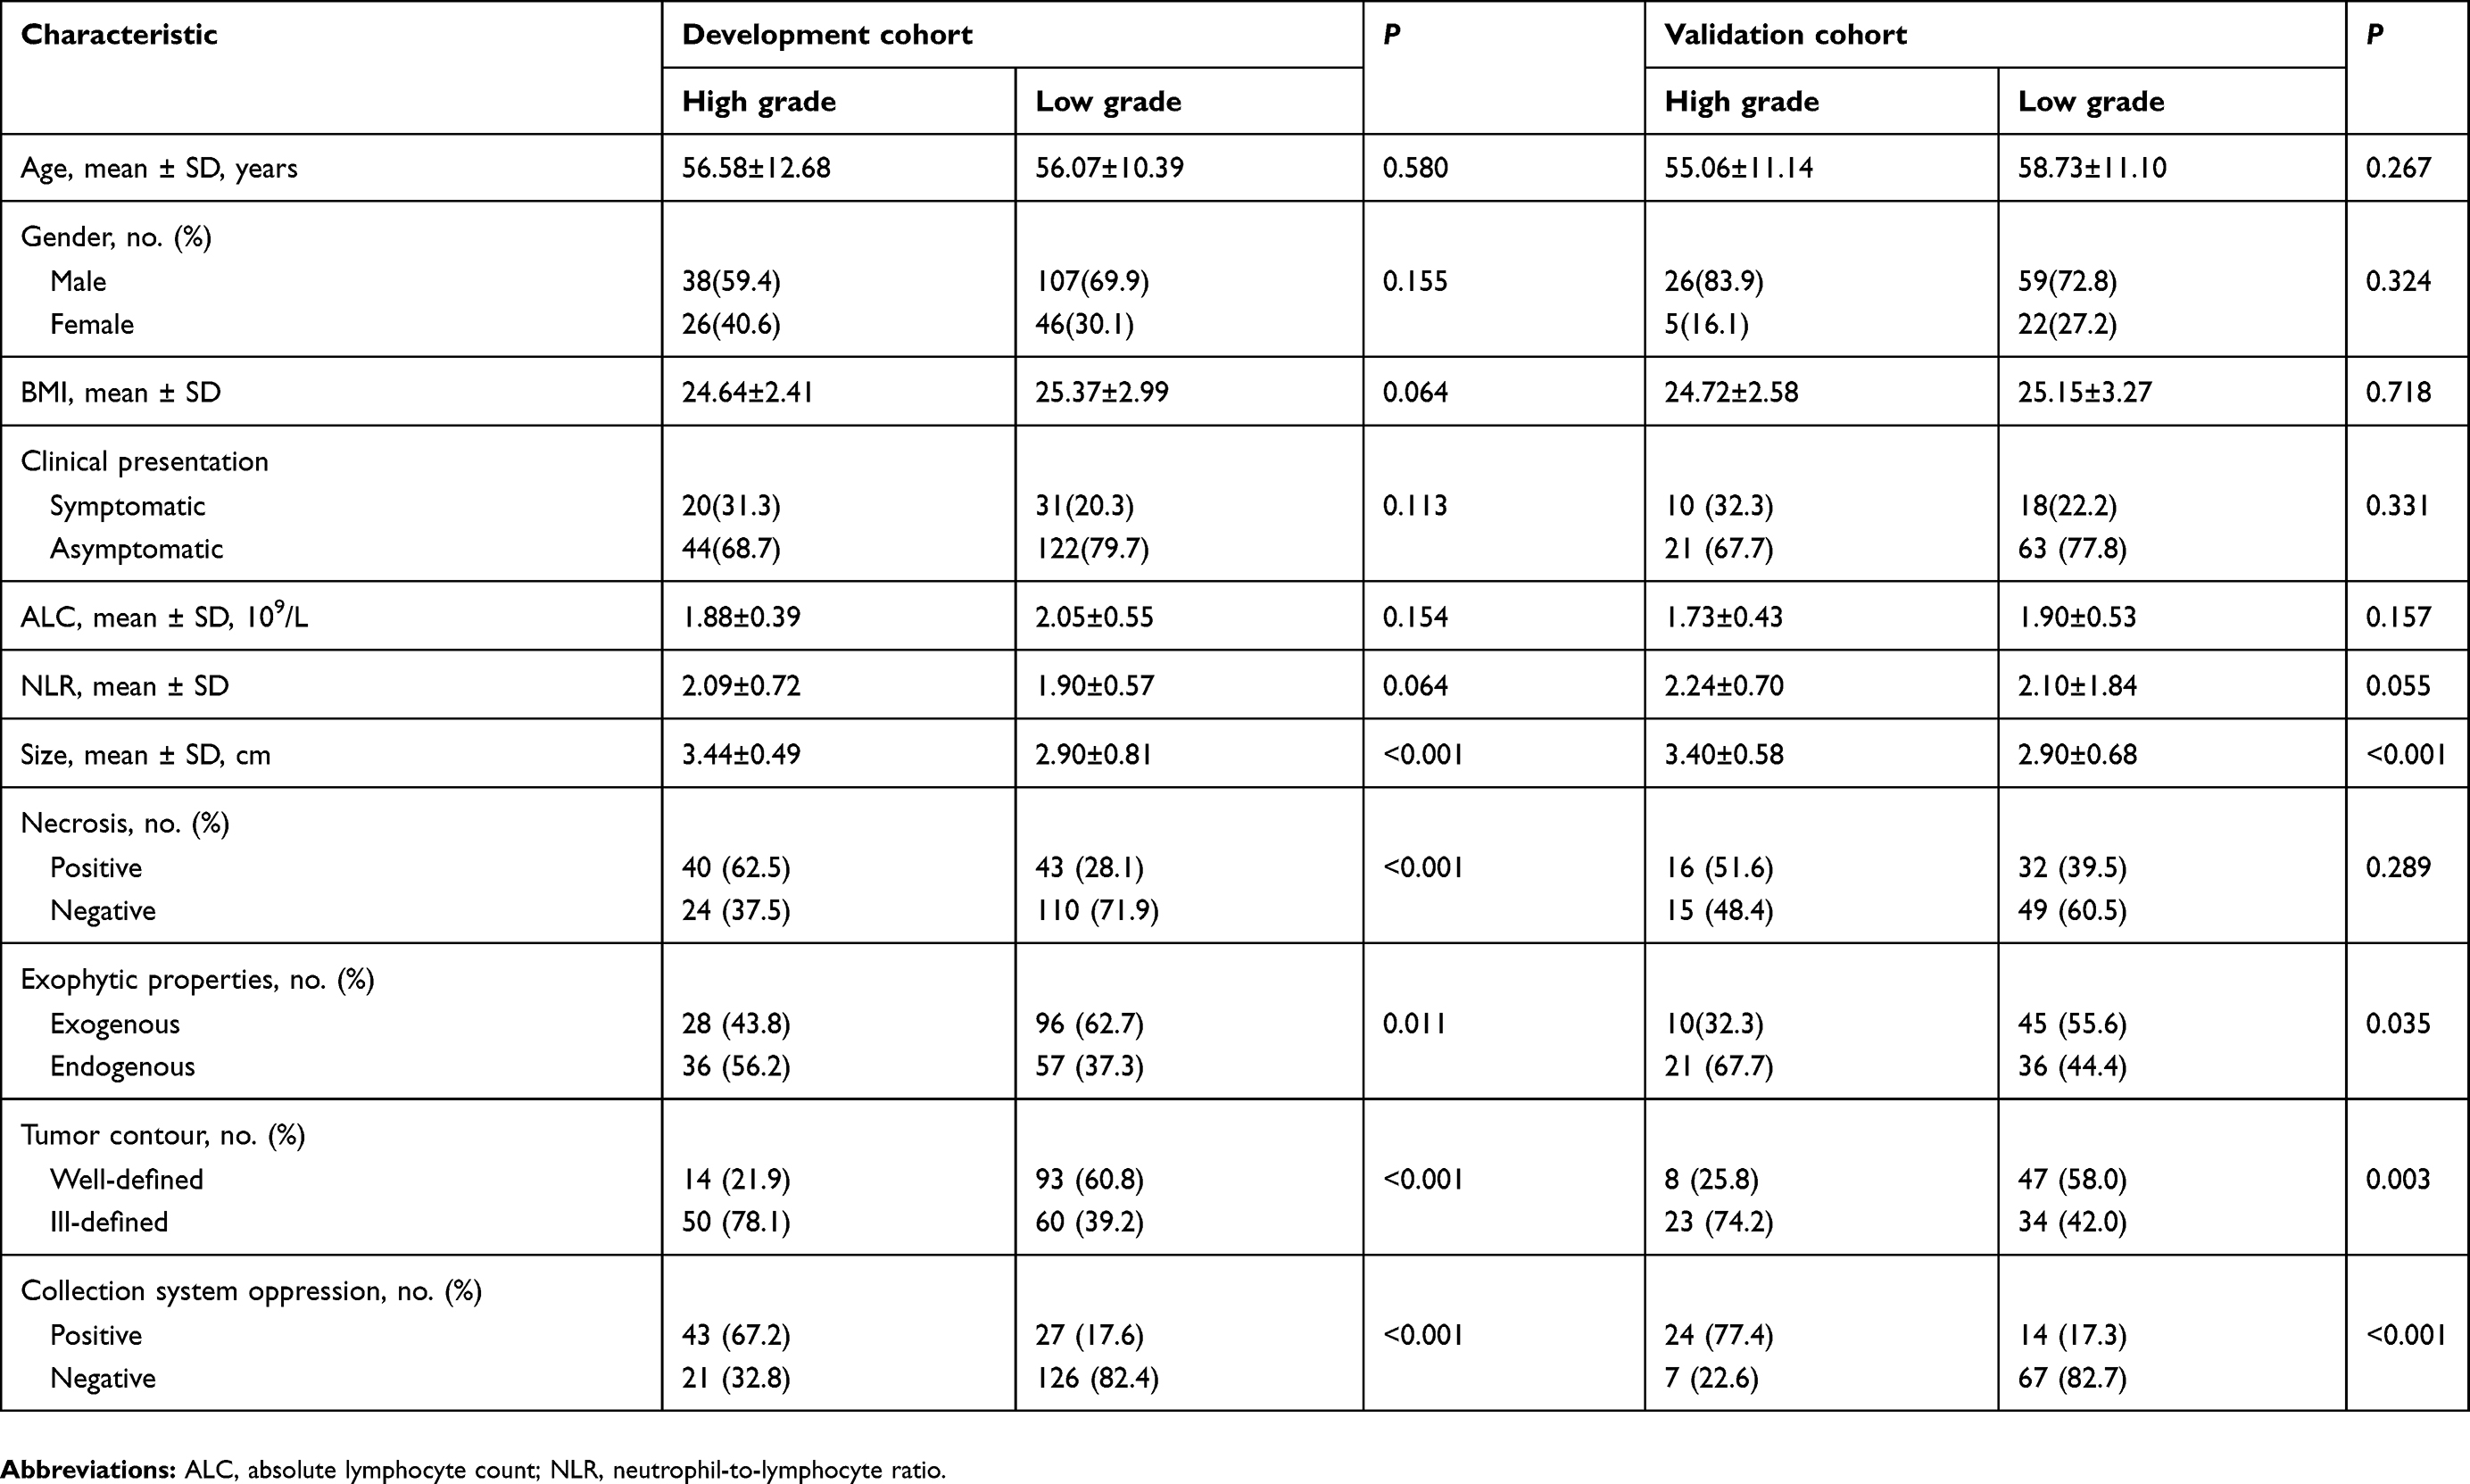 |
Table 2 Characteristics of patients in the development and validation cohort |
Feature selection and predictive nomogram development
All the 12 clinical, hematological, and CT features were reduced to 4 potential predictors on the basis of information of patients in the development cohort (Figure 2A and B). These features were nonzero coefficients in the LASSO logistic regression model. According to the incremental discrimination of the model and our clinical experience, the tumor exophytic properties of CT examination were added into the final nomogram. The predictors included in the final model were CT tumor size, CT necrosis, CT tumor contour, CT tumor exophytic properties, and CT collecting system oppression. A multivariable logistic regression model was established to predict the binary outcome of tumor histopathological subtype (Table 3), which was presented as the nomogram (Figure 3).
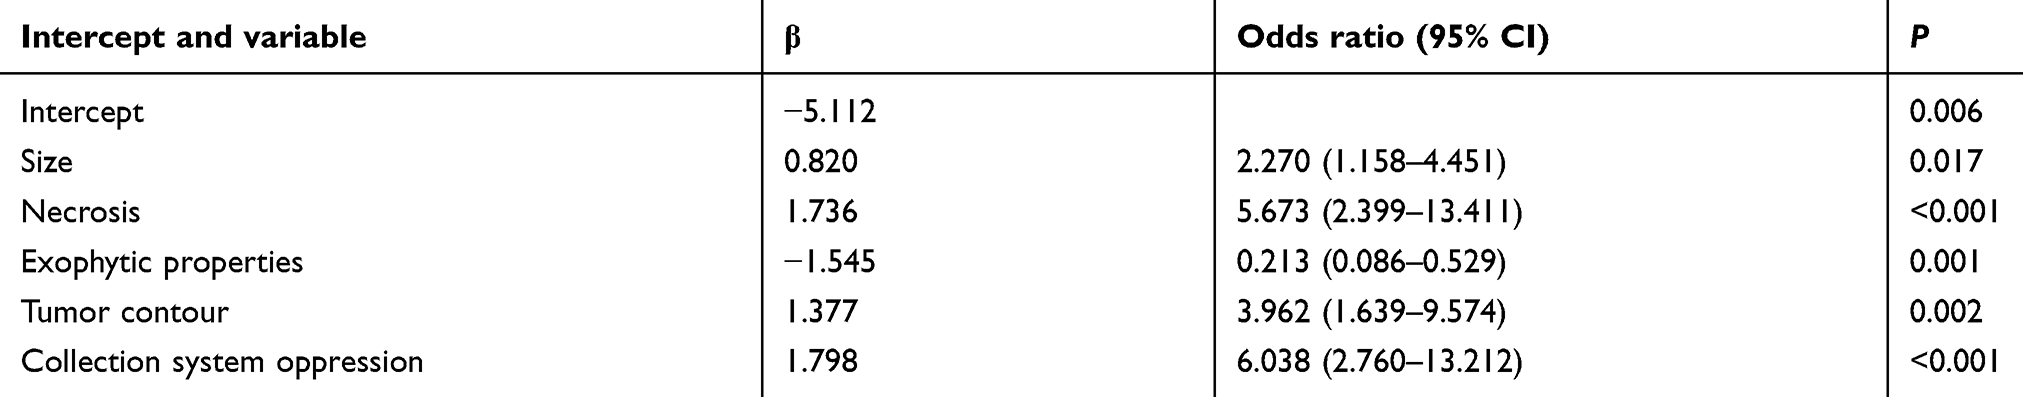 |
Table 3 Risk features for high-grade small renal mass |
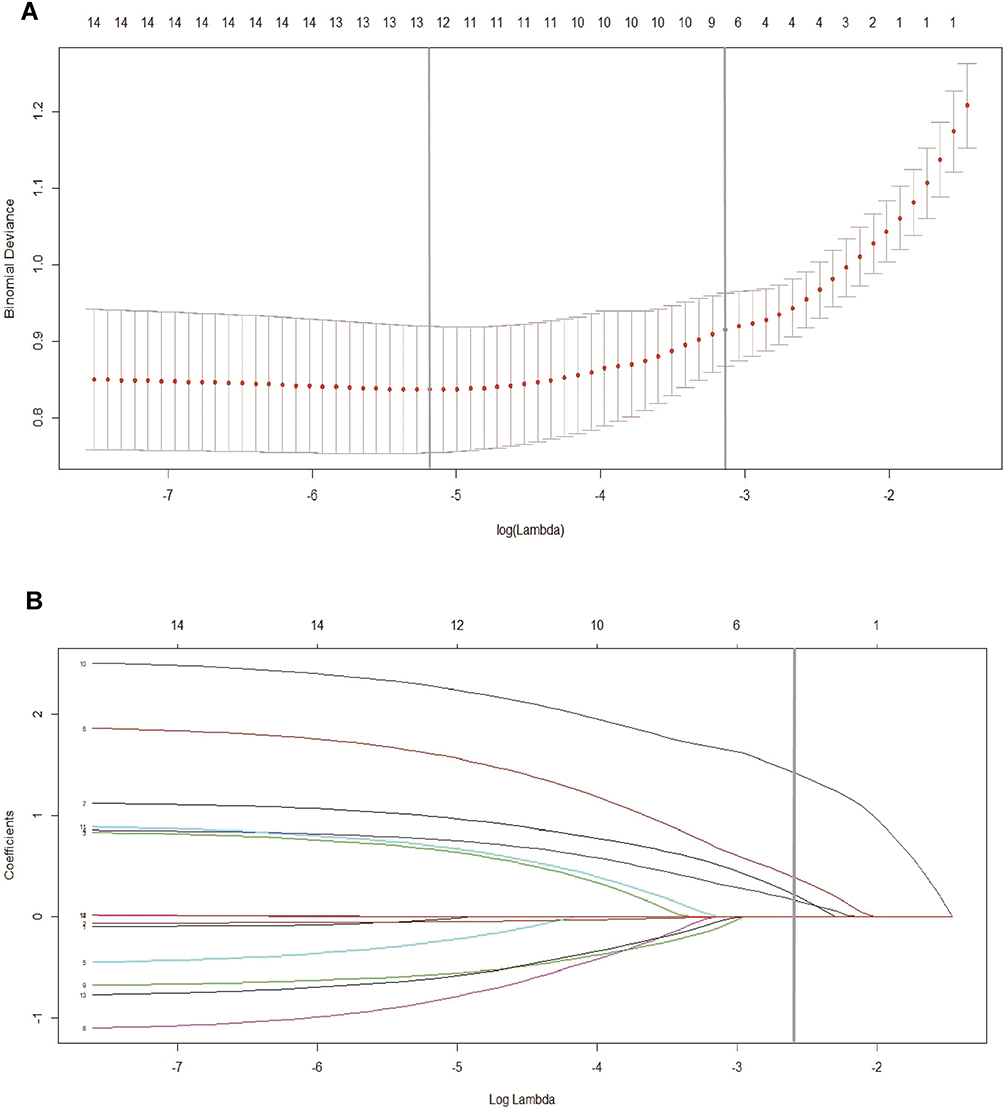 |
Figure 2 Feature selection on the basis of the least absolute shrinkage and selection operator (LASSO) binary logistic regression model. (A) The tuning parameter (λ) in the LASSO model was chosen to be 10 cross-validations with a minimum standard. The area under the receiver operating characteristic (AUC) curve was plotted versus log (λ). By using the minimum standard and the 1 standard error of the minimum standard (1-SE standard), dotted vertical lines were drawn at the optimum value. The value of λ was 0.063 and the log (λ) was −2.76 (1-SE standard) according to 10-fold cross-validation. (B) LASSO coefficient profile for 14 features. A coefficient profile plot was generated for the log (λ) sequence. A vertical line was drawn at the value selected using 10-fold cross-validation, where the best (λ) resulted in 4 non-zero coefficients. |
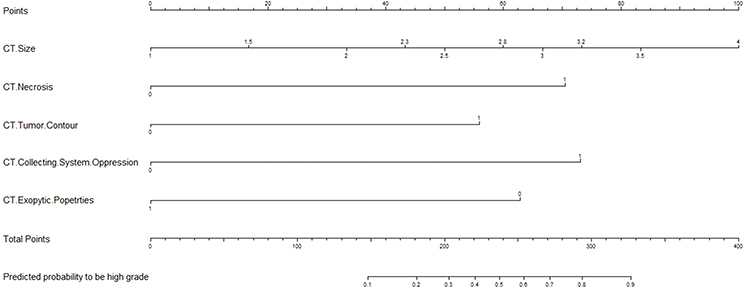 |
Figure 3 Nomogram for evaluating the risk of high-grade tumor histological subtype. Points were assigned by plotting a straight line from the proper spot on each predictor level up to the “Points” level; sum points achieved for each predictor and locate this sum on “Total Points” axis, then drawn a straight line down to determine the corresponding probability of high-grade tumor histological subtype. |
Validation of the predictive nomogram
Since the data from the development cohort were used to construct the nomogram, the results of external validation cohort were employed to validate the nomogram. There was consistency in the calibration curve of the nomogram for the probability of high-grade histological subtype of tumors between prediction and observation in both development and validation cohorts (Figure 4A and B). The C-index was 0.883 and 0.887 for external validation based on internal validation of the nomogram (Figure 5A and B).
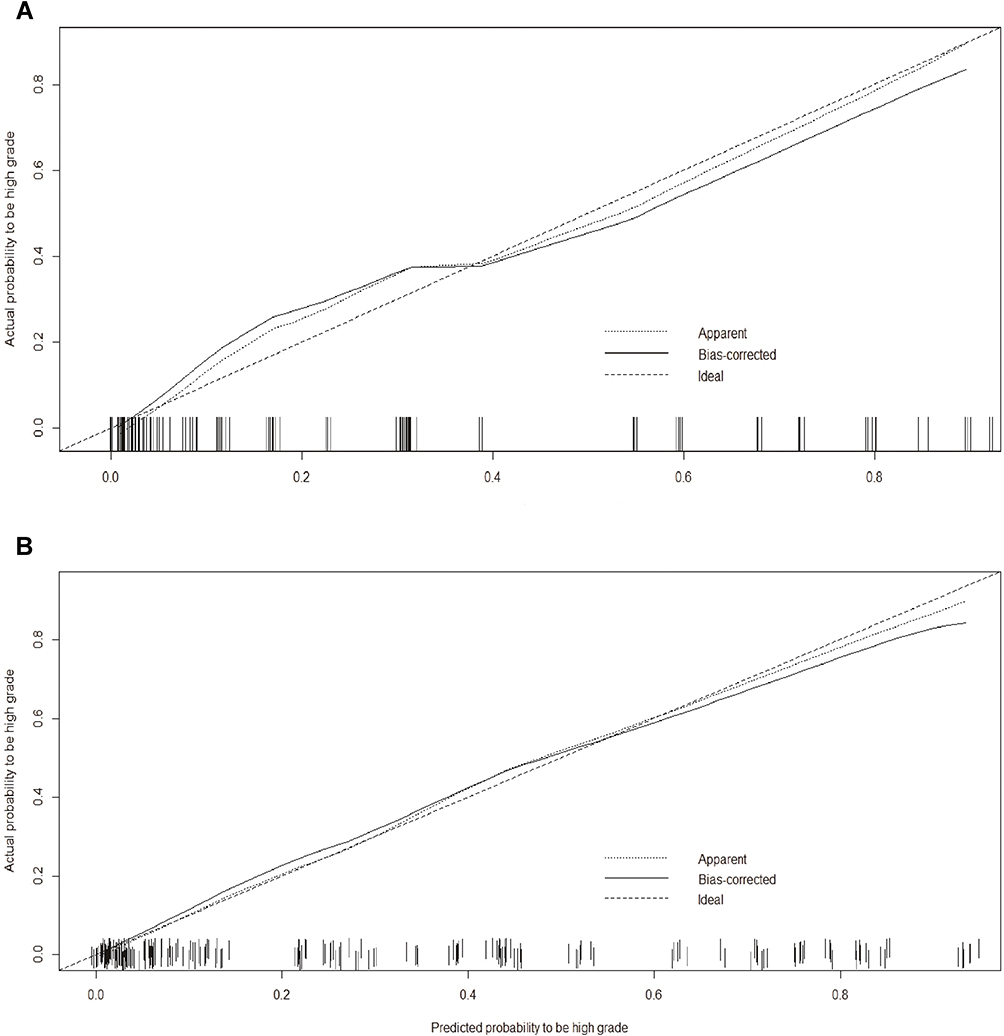 |
Figure 4 Calibration curves of the nomogram in the development (A) and validation (B) cohort. Calibration curves depict the calibration of final model based on the agreement between the predicted risk of high-grade histological subtype and the observed outcome of high-grade histological subtype. The solid line represents the performance of the nomogram, and the position which was closer to the diagonal dashed line represents a better prediction. |
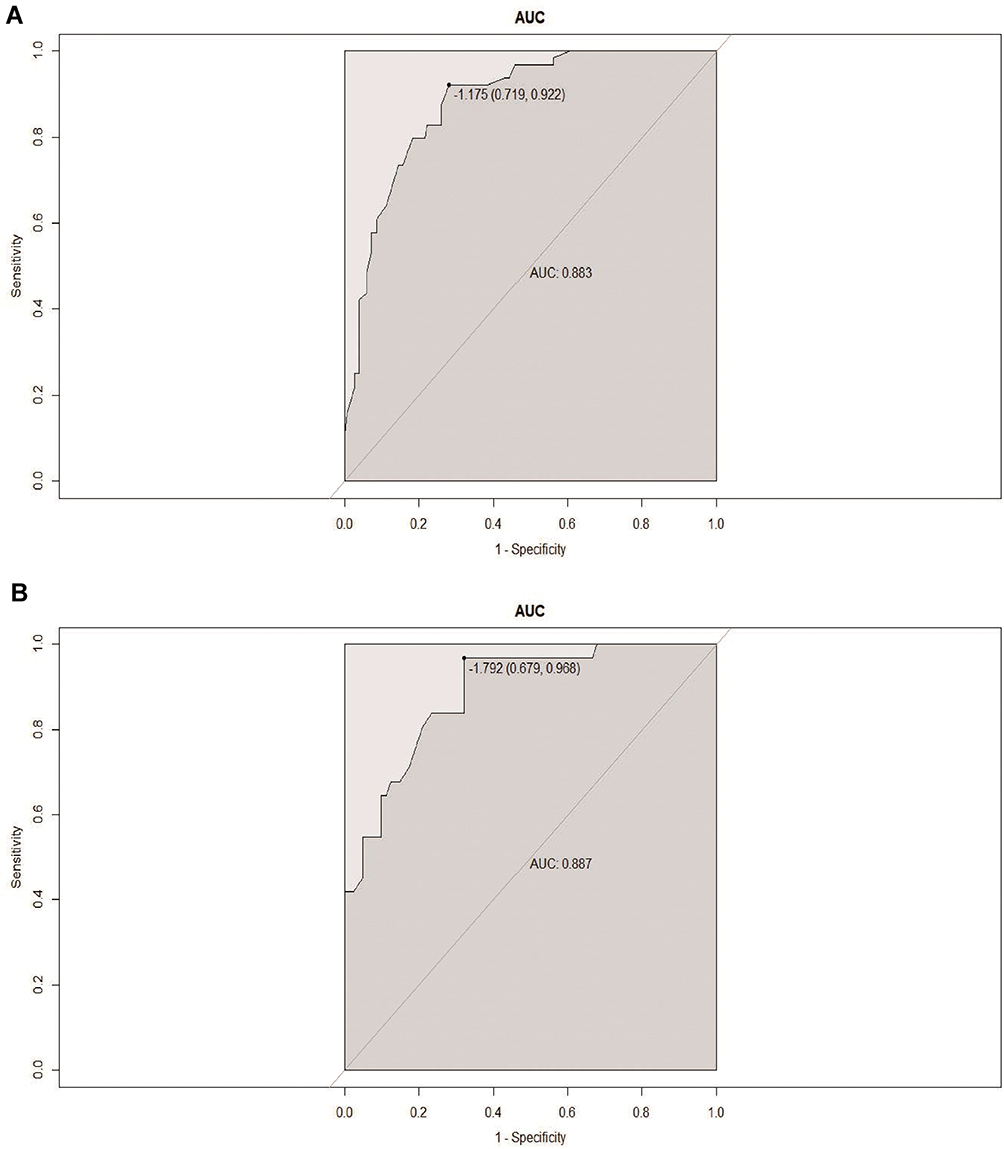 |
Figure 5 Receiver operator characteristics (ROC) curve developed from patients of development (A) and validation (B) cohort when nomogram was used to predict high-grade tumor vs low-grade tumor histological subtype. Abbreviation: AUC, area under the curve. |
Discussion
We established a nomogram as it is beneficial in the prediction of the risks associated with unfavorable histological subtype in patients with SRMs due to the biological heterogeneity of SRMs. Following a retrospective review of clinical and CT imaging data from 329 patients, we found that tumor size, CT necrosis, CT tumor contour, CT tumor exophytic properties, and CT collecting system oppression were identified as the strongest predictors for the histopathological subtype of SRMs in regression modeling. Afterward, a C-index of 0.887 was obtained from the nomogram after external validation.
Large surgical data have indicated that approximately 20–30% of SRMs are benign. Moreover, only 20–25% malignant tumors have an aggressive potential (i.e. high Fuhrman grade, sarcomatoid features, or papillary type II presence), whereas 55–60% have been reported to display indolent behaviors.2,16,17 Therefore, an accurate identification of unfavorable histopathological subtype would allow the surgeon to determine appropriate management which enables patient reassurance and avoids any invasive potential in the processes of diagnosis or treatment. Percutaneous renal biopsy was previously used for pretreatment assessment which was regarded as the most appropriate method.18,19 However, due to risks, sampling error, and the relatively high possibility of irrelevant clinical data obtained, the application of renal biopsy has limited value in predicting the histopathological subtype of tumors.10,20 When a malignancy is found during biopsy examination, the positive predictive value is reported to be >95% and the negative predictive value is >80%.21 Despite the reported accuracy of renal biopsy in determining histological subtype, most current cohorts do not assess tumor grade or they are not precise even though they do. In fact, core biopsies for renal masses could potentially result in the underestimated and unclear grade assessment in more than half of the patients (55%) prior to surgical resection.22 Consequently, percutaneous renal biopsy alone is not the most effective and accurate preoperative management.
Nowadays, nomograms have been broadly developed to predict patients’ survival on the basis of data acquired before or after resection of renal tumors. Lane et al established a nomogram using clinical data (gender, age, smoking history, and clinical presentation) and tumor size to predict the biological potential of SRMs before the intervention. The nomogram was developed using retrospective data from 862 patients who underwent partial nephrectomy for a single, solid, enhanced, or clinical T1 tumor. The nomogram had a bootstrap-corrected C-index of 0.644 after internal validation and an even lower C-index of 0.557 after the prediction of potentially aggressive histological findings.23 Using a multi-institutional data set of European patients, Jeldres et al also constructed a model to predict high Fuhrman grade (III–IV) prior to performing a nephrectomy. Predictors included age at diagnosis, gender, tumor size, and symptom classification. The findings showed that only tumor size was significantly associated with the high Fuhrman grade in the univariate analysis, and the most accurate multivariate nomogram as the Fuhrman grade prediction was only 58.3% accurate.24
Given the limitations of clinical features in the evaluation of the histological subtype of SRMs, other preoperative characteristics of patients must be involved in the final nomogram. Kutikov et al developed a nomogram using the RENAL nephrometry score, which was the first study that illustrated the relationship between tumor anatomy and histological subtype. The nomogram offered a useful tool for the preoperative prediction of tumor histological subtype (area under the curve [AUC]: 0.76) and grade (AUC: 0.73).25 In addition, Raj et al constructed a pretreatment nomogram that predicted the development of metastatic recurrence following nephrectomy based on data from 2517 patients. The predictors included gender, size of the primary renal mass, evidence of lymphadenopathy, or necrosis observed in the preoperative imaging examination as well as the mode of presentation. The C-index was 0.80.26 Karlo et al also developed a nomogram including 1201 patients, with CT features combined with clinical data in order to predict indolent renal cortical tumors. BMI, tumor size, and CT features composed the final nomogram whose C-index was 0.829 after external validation.13 Therefore, the preoperative CT image features may be associated with tumor histological subtype and prognosis. Our final model, which aimed to predict high-grade tumor histological subtype in SRMs, included many predictors including CT, namely, tumor size, the presence of tumor necrosis, tumor contour (either well- or ill-defined), CT tumor exophytic properties, and CT collecting system oppression. After external validation, the nomogram presented with a C-index of 0.887.
CT tumor contour was added since high-grade tumors were considered to display undefinable delineation toward the normal renal parenchyma. With this hypothesis, we found that high-grade tumors presented with significantly ill-defined contours more often than low-grade tumors (Table 2). We also revealed that high-grade tumors resulted in the distinct suppression of CT collecting system more frequently than low-grade tumors (Table 2). However, the tumor size may have been a confounding factor affecting the finding; given that a renal cortical mass grows large, it will finally oppress the collecting system. Moreover, high-grade tumors were significantly larger than low-grade tumors in our study (3.44±0.49 cm vs 2.90±0.81 cm; p<0.001). However, previous studies have reported that large interpolar and hilar tumors often indicated high-grade cancers.25,27 We were aware of the correlation between tumor histological subtype and tumor location in our study. Our results showed that low-grade tumors represented exophytic feature more frequently than high-grade tumors (Table 2). The association between anatomic features and histological subtype had been previously described.28,29 Venkatesh et al documented that in 123 patients who underwent laparoscopic partial nephrectomy, only 55% of “highly exophytic” tumors were malignant and nearly all (96%) of them were low-grade.29
Initially, we speculated whether or not there was a correlation between hematological indicators and tumor histological subtype, since a number of studies suggested a relationship between hematological indicators and tumor prognosis. Saroha et al reported that low ALC was associated with high-grade histological subtype, higher pT stage, and TNM stage in patients with clear cell renal carcinoma.12 Mehrazin et al also suggested that ALC was correlated with higher TNM stage and unfavorable overall survival in patients with papillary carcinoma.30 Viers et al reported that NLR was independently associated with cancer-specific and all-cause mortality among patients with localized renal cortical carcinoma.31 Despite these findings, our results found no significant difference in ALC and NLR between high-grade tumors and low-grade tumors, which may be attributed to the limitation in the cohort data.
Although our study was able to provide an insight into the preoperative nomogram, there were several limitations. Foremost, this was a single-institutional and retrospective study and its sample size was limited. Although we developed the nomogram and validated it externally, more follow-up researches are still required to confirm the findings. In addition, there was a lack of specific predictors that could effectively predict tumor histological subtype, regardless of our undeniable effort to collect patient’s preoperative data. It may be possible that some missing variables could promote the discriminatory power of the nomogram, such as enhancing pattern of SRMs. It has been reported that nodular enhancement and presence of multicystic tumor architecture on CT imaging were significantly associated with aggressive tumors.25
Conclusion
In conclusion, based on all available information from 329 patients, we developed a nomogram which could accurately predict high-grade SRMs. Since there were several limitations in the existing method of RMB, we provided a risk-stratification scheme that combined the nomogram and selective RMB. This could potentially be a new and improved option for clinicians when performing preoperative evaluation and selecting the best treatment regimen for SRMs.
Acknowledgments
This work was supported by the National Natural Science Foundation of China (grant numbers 81472682, 81772756 and 81572538), Tianjin Municipal Natural Science Foundation (grant 17JCYBJC26000), and Science and Technology Innovation Fund Projects of Tianjin Institute of Urology (grant number MNYB201503). None of the study sponsors had a role in the study design or the collection, analysis, and interpretation of data.
Author contributions
All authors contributed to data analysis, drafting or revising the article, gave final approval of the version to be published, and agree to be accountable for all aspects of the work.
Disclosure
The authors report no conflicts of interest in this work.
References
1. Kane CJ, Mallin K, Ritchey J, Cooperberg MR, Carroll PR. Renal cell cancer stage migration: analysis of the National cancer data base. Cancer. 2008;113(1):78–83. doi:10.1002/cncr.23518
2. Bhindi B, Thompson RH, Lohse CM, et al. The probability of aggressive versus indolent histology based on renal tumor size: implications for surveillance and treatment. Eur Urol. 2018;36(6_suppl):704.
3. Hollingsworth JM, Miller DC, Daignault S, Hollenbeck BK. Rising incidence of small renal masses: a need to reassess treatment effect. J Natl Cancer Inst. 2007;98(18):569–570.
4. Remzi M, Ozsoy M, Klingler HC, et al. Are small renal tumors harmless? Analysis of histopathological features according to tumors 4 cm or less in diameter. J Urol. 2006;176(3):896–899. doi:10.1016/j.juro.2006.04.047
5. Finelli A, Ismaila N, Bro B, et al. Management of small renal masses: American Society of Clinical Oncology clinical practice guideline. J Clin Oncol. 2017;35(6):668. doi:10.1200/JCO.2016.69.9645
6. Campbell S, Uzzo RG, Allaf ME, et al. Renal mass and localized renal cancer: AUA guideline. J Urol. 2017;198(3):520. doi:10.1016/j.juro.2017.03.077
7. Thompson RH, Hill JR, Babayev Y, et al. Metastatic renal cell carcinoma risk according to tumor size. J Urol. 2009;182(1):41–45. doi:10.1016/j.juro.2009.02.128
8. Umbreit EC, Shimko MS, Childs MA, et al. Metastatic potential of a renal mass according to original tumour size at presentation. BJU Int. 2011;109(2):194.
9. Ball MW, Bezerra SM, Gorin MA, et al. Grade heterogeneity in small renal masses: potential implications for renal mass biopsy. J Urol. 2015;193(1):36–40. doi:10.1016/j.juro.2014.06.067
10. Lane BR, Samplaski MK, Herts BR, Zhou M, Novick AC, Campbell SC. Renal mass biopsy–a renaissance. J Urol. 2008;179(1):20–27. doi:10.1016/j.juro.2007.08.124
11. Volpe A, Finelli A, Gill IS, et al. Rationale for percutaneous biopsy and histologic characterisation of renal tumours. Eur Urol. 2012;62(3):491–504. doi:10.1016/j.eururo.2012.05.009
12. Saroha S, Uzzo RG, Plimack ER, Ruth K, Alsaleem T. Lymphopenia is an independent predictor of inferior outcome in clear cell renal carcinoma. J Urol. 2013;189(2):454–461. doi:10.1016/j.juro.2012.09.166
13. Karlo CA, Kou L, Di PP, et al. Renal cell carcinoma: a nomogram for the CT imaging-inclusive prediction of indolent, non-clear cell renal cortical tumours. Eur J Cancer. 2016;59:57–64. doi:10.1016/j.ejca.2016.02.012
14. Novara G, Martignoni G, Artibani W, Ficarra V. Grading systems in renal cell carcinoma. J Urol. 2007;177(2):430–436. doi:10.1016/j.juro.2006.09.034
15. Sauerbrei W, Royston P, Binder H. Selection of important variables and determination of functional form for continuous predictors in multivariable model building. Stat Med. 2007;26(30):5512–5528. doi:10.1002/sim.3148
16. Russo P. Should elective partial nephrectomy be performed for renal cell carcinoma >4 cm in size. Nat Clin Pract Urol. 2008;5(9):482–483. doi:10.1038/ncpuro1177
17. Thompson RH, Kurta JM, Kaag M, et al. Tumor size is associated with malignant potential in renal cell carcinoma cases. J Urol. 2009;181(5):2033–2036. doi:10.1016/j.juro.2009.01.027
18. Jeon HG, Seo SI, Jeong BC, et al. Percutaneous kidney biopsy for a small renal mass: a critical appraisal of results. J Urol. 2016;195(3):568–573. doi:10.1016/j.juro.2015.09.073
19. Leveridge MJ, Finelli A, Kachura JR, et al. Outcomes of small renal mass needle core biopsy, nondiagnostic percutaneous biopsy, and the role of repeat biopsy. Eur Urol. 2011;60(3):578. doi:10.1016/j.eururo.2011.06.021
20. Patel HD, Johnson MH, Pierorazio PM, et al. Diagnostic accuracy and risks of biopsy in the diagnosis of a renal mass suspicious for localized renal cell carcinoma: systematic review of the literature. J Urol. 2016;195(5):1340–1347. doi:10.1016/j.juro.2015.11.029
21. Wang R, Jr JSW, Jr DPW, Higgins EJ, Hafez KS. Accuracy of percutaneous core biopsy in management of small renal masses. Urology. 2009;73(3):586–590. doi:10.1016/j.urology.2008.08.519
22. Blumenfeld AJ, Guru K, Fuchs GJ, Kim HL. Percutaneous biopsy of renal cell carcinoma underestimates nuclear grade. Urology. 2010;76(3):610–613. doi:10.1016/j.urology.2009.09.095
23. Lane BR, Babineau D, Kattan MW, et al. A preoperative prognostic nomogram for solid enhancing renal tumors 7 cm or less amenable to partial nephrectomy. J Urol. 2007;178(2):429–434. doi:10.1016/j.juro.2007.03.106
24. Jeldres C, Sun M, Liberman D, et al. Can renal mass biopsy assessment of tumor grade be safely substituted for by a predictive model. J Urol. 2009;182(1):2585–2589. doi:10.1016/j.juro.2009.08.053
25. Kutikov A, Smaldone MC, Egleston BL, et al. Anatomic features of enhancing renal masses predict malignant and high-grade pathology: a preoperative nomogram using the RENAL nephrometry score. J Urol. 2011;60(2):241–248.
26. Raj GV, Thompson RH, Leibovich BC, Blute ML, Russo P, Kattan MW. Preoperative nomogram predicting 12-year probability of metastatic renal cancer. J Urol. 2008;179(6):2146. doi:10.1016/j.juro.2008.01.101
27. Ball MW, Gorin MA, Bhayani SB, et al. Preoperative predictors of malignancy and unfavorable pathology for clinical T1a tumors treated with partial nephrectomy: a multi-institutional analysis. Urol Oncol. 2015;33(3):
28. Schachter LR, Bach AM, Snyder ME, Kattan MW, Russo P. The impact of tumour location on the histological subtype of renal cortical tumours. BJU Int. 2006;98(1):63–66. doi:10.1111/j.1464-410X.2006.06432.x
29. Venkatesh R, Weld K, Ames CD, et al. Laparoscopic partial nephrectomy for renal masses: effect of tumor location. Urology. 2006;67(6):1169–1174. doi:10.1016/j.urology.2006.01.089
30. Mehrazin R, Uzzo RG, Kutikov A, et al. Lymphopenia is an independent predictor of inferior outcome in papillary renal cell carcinoma. Urol Oncol. 2015;191(4):e321–e322.
31. Viers BR, Thompson RH, Boorjian SA, Lohse CM, Leibovich BC, Tollefson MK. Preoperative neutrophil-lymphocyte ratio predicts death among patients with localized clear cell renal carcinoma undergoing nephrectomy. Urol Oncol. 2014;32(8):1277–1284. doi:10.1016/j.urolonc.2014.05.014
 © 2019 The Author(s). This work is published and licensed by Dove Medical Press Limited. The full terms of this license are available at https://www.dovepress.com/terms.php and incorporate the Creative Commons Attribution - Non Commercial (unported, v3.0) License.
By accessing the work you hereby accept the Terms. Non-commercial uses of the work are permitted without any further permission from Dove Medical Press Limited, provided the work is properly attributed. For permission for commercial use of this work, please see paragraphs 4.2 and 5 of our Terms.
© 2019 The Author(s). This work is published and licensed by Dove Medical Press Limited. The full terms of this license are available at https://www.dovepress.com/terms.php and incorporate the Creative Commons Attribution - Non Commercial (unported, v3.0) License.
By accessing the work you hereby accept the Terms. Non-commercial uses of the work are permitted without any further permission from Dove Medical Press Limited, provided the work is properly attributed. For permission for commercial use of this work, please see paragraphs 4.2 and 5 of our Terms.