")
Back to Journals » International Journal of General Medicine » Volume 14
Development and Validation of an Ultrasonic Diagnostic Model for Differentiating Follicular Thyroid Carcinoma from Follicular Adenoma
Authors Huang Q , Xie L , Huang L , Wei W , Li H, Zhuang Y , Liu X , Chen S , Zhang S
Received 27 July 2021
Accepted for publication 24 August 2021
Published 30 August 2021 Volume 2021:14 Pages 5069—5078
DOI https://doi.org/10.2147/IJGM.S331338
Checked for plagiarism Yes
Review by Single anonymous peer review
Peer reviewer comments 2
Editor who approved publication: Dr Scott Fraser
Qingshan Huang,1 Lijun Xie,2 Liyan Huang,2 Weili Wei,2 Haiying Li,2 Yunfang Zhuang,2 Xinxiu Liu,2 Shuqiang Chen,2 Sufang Zhang2
1Musculoskeletal Tumor Center, Peking University People’s Hospital, Beijing, 100044, People’s Republic of China; 2Department of Ultrasound, The First Affiliated Hospital of Fujian Medical University, Fuzhou, 350005, People’s Republic of China
Correspondence: Sufang Zhang
Department of Ultrasound, The First Affiliated Hospital of Fujian Medical University, Fuzhou, 350005, People’s Republic of China
Tel/Fax +86-591-87981961
Email [email protected]
Qingshan Huang
Musculoskeletal Tumor Center, Peking University People’s Hospital, Beijing, 100044, People’s Republic of China
Tel/Fax +86-10-88324471
Email [email protected]
Background: High-resolution ultrasound is the first choice for the diagnosis of thyroid nodules, but it is still difficult to distinguish between follicular thyroid carcinoma (FTC) and follicular adenoma (FA). Our research aimed to develop and validate an ultrasonic diagnostic model for differentiating FTC from FA.
Methods: This study retrospectively analyzed 196 patients who were diagnosed as FTC (n=83) and FA (n=113). LASSO regression analysis was used to screen clinical and ultrasonic features. Multivariate logistic regression analysis was used to establish the ultrasonic diagnostic model of FTC. Nomogram was used for the visualization of diagnostic models. C-index, ROC, and calibration curves analysis were used to evaluate the accuracy of the diagnostic model. Decision curve analysis (DCA) was used to evaluate the net benefits of the ultrasonic diagnostic model for FTC diagnosis under different threshold probabilities. The bootstrap method was used to verify the ultrasonic diagnostic model.
Results: After Lasso regression analysis, 10 clinical and ultrasonic features were used to construct the ultrasonic diagnostic model of FTC. The C-index and AUC of the model were 0.868 and 0.860, respectively. DCA showed that the ultrasonic model had good clinical application value. The C-index in the validation group was 0.818, which was close to the C-index in the model.
Conclusion: Ultrasonic diagnostic model constructed with 10 clinical and ultrasonic features can better distinguish FTC from FA.
Keywords: follicular thyroid carcinoma, follicular adenoma, diagnostic, ultrasonic
Introduction
With the increasing incidence of thyroid nodules over the years, overdiagnosis and overtreatment of thyroid nodules have attracted the attention of more and more physicians.1,2 Among the numerous thyroid nodules, follicular thyroid neoplasm (FTN) is a well-differentiated epithelial tumor, including follicular thyroid carcinoma (FTC), follicular adenoma (FA), and their subtypes, among which FTC is second only to papillary thyroid carcinoma (PTC) on incidence. Compared with PTC, FTC is not prone to lymphatic invasion, but it is easy to metastasize to lung, bone, brain, and other tissues through blood, leading to a poor prognosis. Early detection and treatment are the best ways to improve the prognosis of FTC.3–5 The preoperative identification of benign and malignant FTN is still difficult at present. Although it is derived from the thyroid follicular epithelium as PTC, it does not have typical malignant ultrasonic features which characterize PTC. Therefore, the several current mainstream ultrasound risk stratification systems are also not suitable for FTC,6–,9 even preoperative fine-needle aspiration (FNA) is difficult to distinguish between FTC and FA. Though artificial intelligence algorithm application shows potential in thyroid pathology diagnosis, it is still subject to technical limitations.10,11 The diagnosis requires thyroidectomy, and complete histopathology is required to find evidence of capsular or vascular invasion.12
Currently, high-resolution ultrasound is the preferred examination for the diagnosis of thyroid nodules. Most of the ultrasound studies on differentiating FTC and FA were analyzed independently from tumor size, ultrasonic features, or other aspects. Few studies had comprehensively analyzed various ultrasonic features, so they had some limitations to a certain degree. We attempted to integrate multiple ultrasonic features to develop a holistic ultrasonic diagnostic model for FTC. Although FTC has no typical malignant ultrasonic features, it is generally recognized as a large oval nodule with a peripheral halo and rich blood supply,13 which has laid a foundation for the establishment of the ultrasonic diagnostic model. Our study tried to convert the complicated clinical and ultrasonic data into a simple model to distinguish between FTC and FA more conveniently and accurately.
Materials and Methods
Patients
This study was approved by the Ethics Committee of the First Affiliated Hospital of Fujian Medical University (2015-084-1). It retrospectively analyzed 196 patients who were diagnosed as FTC (n=83) and FA (n=113) after thyroidectomy in the First Affiliated Hospital of Fujian Medical University from January 2012 to December 2020. Inclusion criteria for nodules: 1) The ultrasonic data of thyroid nodules was complete and clear, the location and size of the nodules corresponded to the pathological findings. Exclusion criteria:1) Patients had undergone radiotherapy or chemotherapy; 2) The nodules were poorly defined boundaries due to diffuse lesions such as Hashimoto’s thyroiditis, hyperthyroidism, and subacute thyroiditis.
Clinical and Ultrasonic Features
The age and gender of patients with thyroid nodules were recorded. The imaging features of each nodule included size, location, number, echogenicity (hypoechoic, isoechoic, hyperechoic), calcification, composition (solid, mixed) (Figure 1A), blood supply (scarce, rich), imaging characteristic (“separated nodules sign”, no “separated nodules sign”) (Figure 1B), peripheral halo (no discontinuous or irregular thick halo, with discontinuous or irregular thick halo) (Figure 1C), margins (smooth, irregular or lobulated) (Figure 1D), and shape (oval, irregular). The “separated nodules sign” is a kind of typical sign that we had observed, in which a large nodule was separated into many smaller nodules (Figure 1B). Since most of the FTNs are surrounded by blood flow signals, therefore, in this study, scarce blood supply referred to no more than 3 strips of blood flow signals inside the nodule beside blood supply rounding, while rich blood supply referred to more than 3 strips of blood flow signals inside the nodule beside the blood supply rounding.
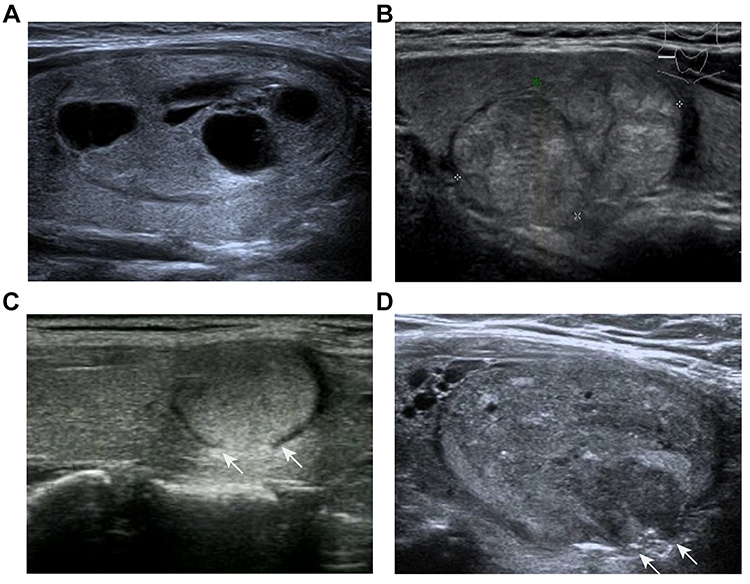 |
Figure 1 The ultrasonic imagings of FA and FTC. (A) Ultrasonic imaging of FA. The image showed an elliptic isoechoic nodule with smooth margins, thin and even peripheral halo, and accompanied by cystic changes. (B) Ultrasonic imaging of FTC. It resembled a large oval nodule that was subdivided into smaller nodules by the hypoechoic region, which was known as the “separated nodules sign” in this study. (C) Ultrasonic imaging of FTC. The image showed an elliptic isoechoic nodule with a discontinuous and irregular thick halo. Two white arrows indicated the discontinuous change of peripheral halo. (D) Ultrasonic imaging of FTC. The image showed an elliptic isoechoic nodule with irregular margins. Two white arrows indicated local irregular change. Abbreviations: FA, follicular adenoma; FTC, follicular thyroid carcinoma. |
Construction of the Model
The “glmnet” package was used for LASSO regression analysis to screen clinical and ultrasonic features. The “rms” package was used for multivariate logistic regression analysis, the plotting of the nomogram, the calculation of the C-index, and the calibration curve analysis. Multivariate logistic regression analysis was used to establish the diagnostic model of FTC. Nomogram was used to estimate FTC scores in the model.
Verification of the Model
C-index and calibration curves analysis were used to evaluate the accuracy of the model. The “ROCR” package was used to map the ROC and to evaluate the accuracy of the model in the diagnosis of FTC. Besides, we used an internal validation method for 196 thyroid nodules to verify the model through R software (bootstrap method). 1000 bootstrap resamples were performed.
Statistical Analysis
R software (Version 3.6.1) and SPSS22 were used for statistical analysis. T-test and chi-square tests were used to retrospectively analyze the differences of the clinical and ultrasonic features between FTC and FA. Multivariate logistic regression analysis was performed on the 10 clinical and ultrasonic features, which construct a diagnostic model for FTC. C-index and calibration curves analysis were used to evaluate the accuracy of the model.14 Besides, the “ROCR” package was used to map the ROC and to evaluate the accuracy of the model in the diagnosis of FTC. The “rmda” package was used in DCA to evaluate the net benefits at different threshold probabilities and the clinical application value of the model. The bootstrap method was used to verify the diagnosis model of FTC,14 and 1000 bootstrap resamples were performed. Two-tailed P-values were used, and the statistical significance was set at P < 0.05.
Results
Clinical and Ultrasonic Features Analysis
A total of 196 patients with pathologically confirmed FTC (n=83) and FA (n=113) were included in this study. The included variables were 13 clinical and ultrasonic features commonly used in thyroid ultrasound diagnosis (Table 1). There were 63 males (32.14%) and 133 females (67.86%). The median age was 45.35 years (14–77 years). The results showed that there were statistically significant differences between FTC and FA in size, echogenicity, calcification, composition, blood supply, “separated nodules sign”, peripheral halo, margins and shape. In addition, the number of microcalcification and macrocalcifications in FA was 0 and 9 respectively. The number of microcalcifications in FTC was 8, and the number of macrocalcifications was 11. The chi-square test (Fisher’s Exact Test) showed that the two were statistically significant (P=0.029), and the proportion of microcalcification was higher in FTC.
 |
Table 1 Clinical and Ultrasonic Features of the Nodules |
Development of the Ultrasonic Diagnostic Model
10 clinical and ultrasonic features with diagnostic value for FTC were obtained by LASSO regression analysis, with the minimum lambda (λ) being 0.0158 (Figure 2A and B). The 10 characteristics were location, size, echogenicity, calcification, composition, blood supply, imaging characteristic, peripheral halo, margins, and shape. The results of multivariate regression analyses for 10 clinical and ultrasonic features were summarized in Table 2, including regression coefficients, OR, 95% confidence intervals (CI), and P-values. Besides, a nomogram of the diagnostic model for FTC was shown in Figure 3. The nomogram consisted of 13 number lines, the first of which represented the score range (0–100) for the variable. The 2nd to 11th number lines were the 10 clinical and ultrasonic features included, each of which had a corresponding score found on the first number line. The sum of the scores of all features was the total score of each patient, and the total score of each patient could be found on the 12th number line. The 13th number line represented the probability of being diagnosed with FTC. Based on the total score, we could find the probability of each patient being diagnosed with FTC on this number line.
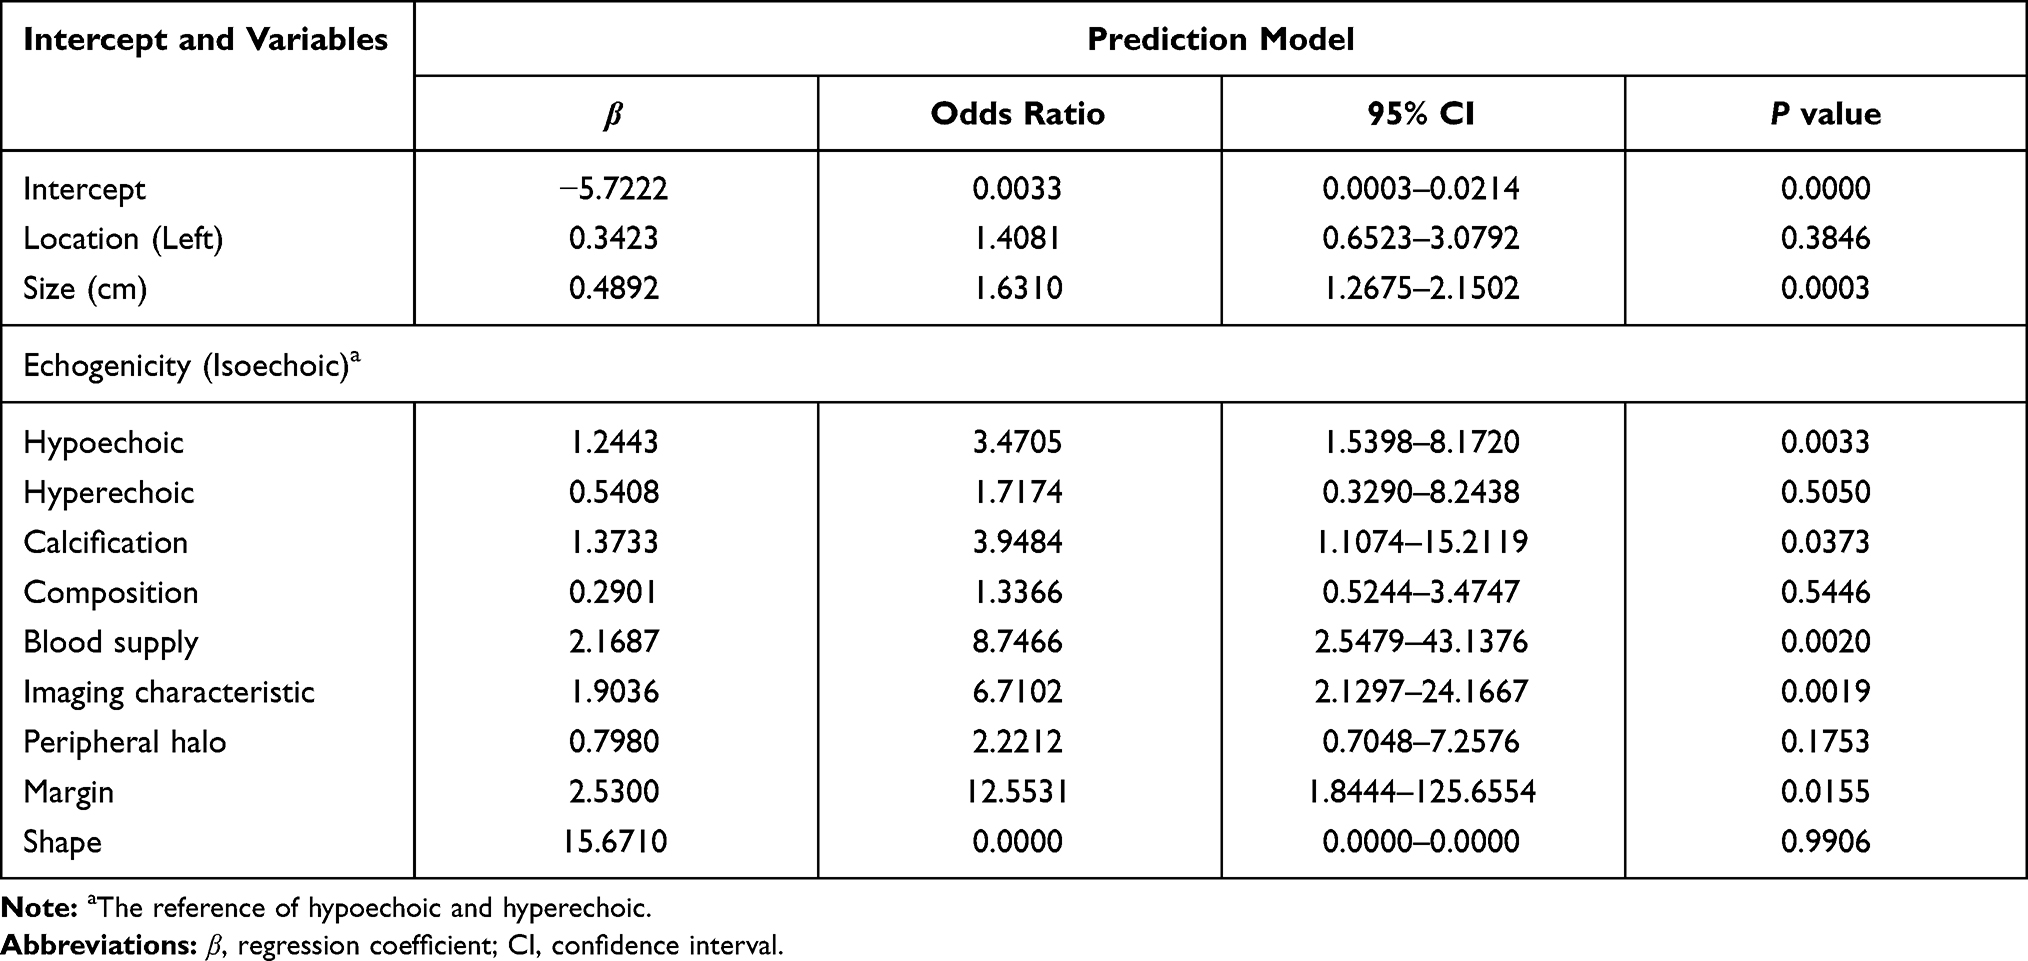 |
Table 2 Clinical and Ultrasonic Features Included in Multivariate Logistic Regression Analysis |
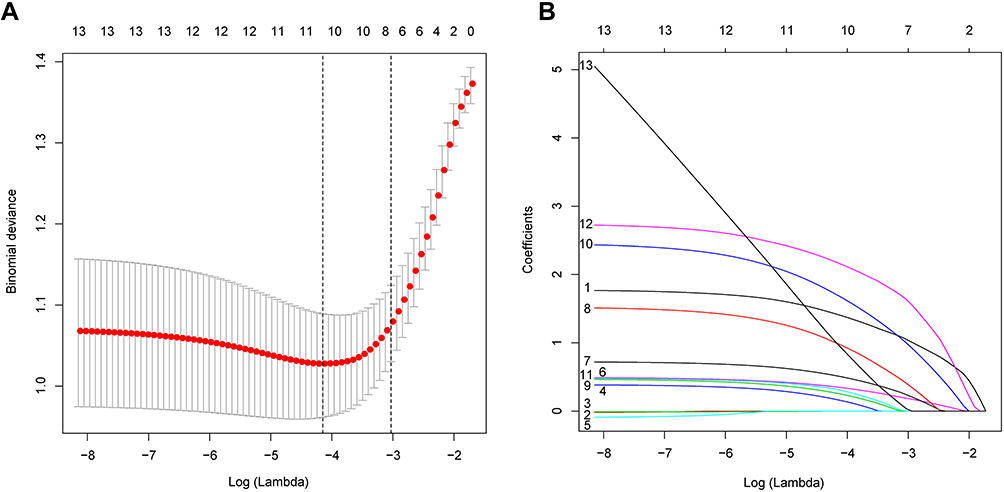 |
Figure 2 Clinical and ultrasonic characteristics were screened by LASSO regression analysis. (A) Optimization parameters (lambda) of the LASSO model were obtained via 10-fold cross-validation. Dotted vertical lines were drawn at the optimal values based on the minimum criteria and the one standard error of the minimum criteria (B) The LASSO coefficient profiles of the 13 features. A coefficient profile plot was produced against the log(lambda) sequence. |
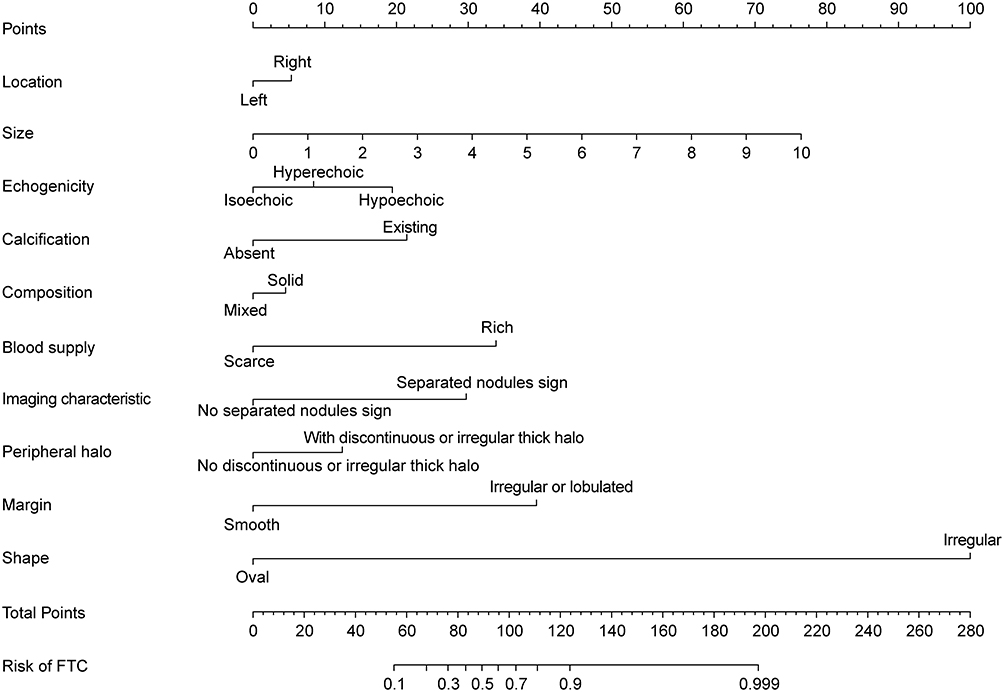 |
Figure 3 Development of ultrasonic diagnostic nomogram. The first number line represents the score range (0–100) for the variable. Number lines 2 to 11 are the 10 clinical and ultrasonic features included, each of which has a corresponding score found on the first number line. The sum of the scores of all features is the total score of each patient, and the total score of each patient can be found on the 12th number line. The 13th number line represents the probability of being diagnosed with FTC. Abbreviation: FTC, follicular thyroid carcinoma. |
Evaluation of the Accuracy of the Ultrasonic Diagnostic Model
The results showed that the C-index of the model was 0.868 (95% CI: 0.819–0.917). ROC analysis also showed that our model had good predictive performance (Figure 4A), with an AUC of 0.860. In addition, the optimal cut-off value for the patient total score was 71.8. When the total score is less than 71.8, it is relatively safe for patients to follow up. Calibration curves analysis showed that the prediction results of our model were very close to the actual situation, with good accuracy (Figure 4B).
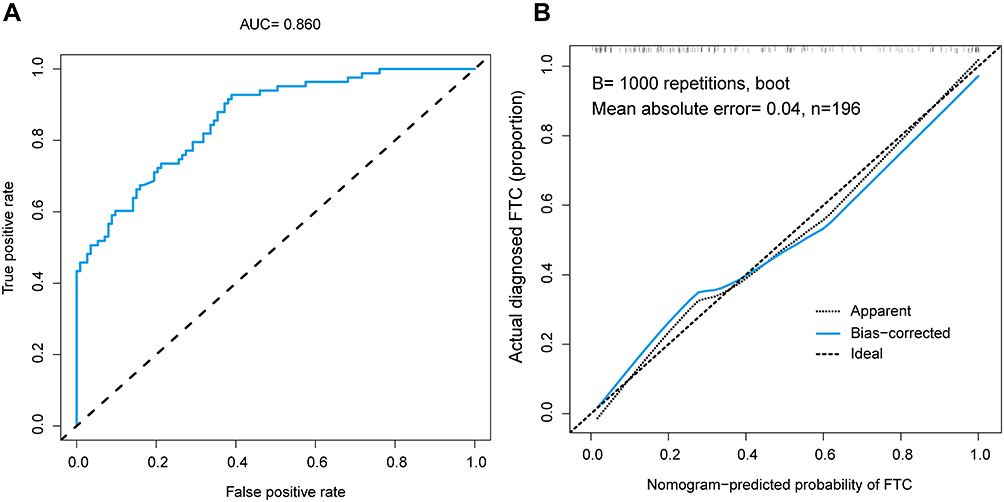 |
Figure 4 Evaluation of the accuracy of the ultrasonic diagnostic model. (A) ROC was used to evaluate the predictive power of ultrasound diagnostic models. The AUC was 0.860. The optimal cut-off value for the patient total score was 71.8. (B) The calibration curves of the ultrasonic diagnostic model for FTC. The higher the coincidence degree between the blue line and diagonal line, the better the accuracy of the model. Abbreviations: AUC, the area under the ROC; FTC, follicular thyroid carcinoma. |
Clinical Application Value of the Ultrasonic Diagnostic Model
We can conveniently calculate the probability of each patient being diagnosed as FTC through the model. DCA was used to evaluate the clinical application value of the model. Our study showed that when the threshold probability is greater than 3%, the model had a relatively good net benefit (Figure 5).
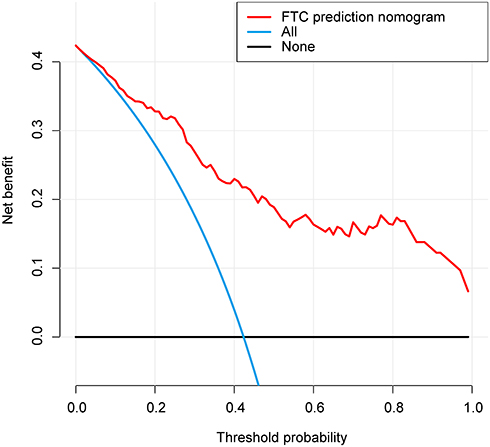 |
Figure 5 Decision curve analysis for the ultrasonic diagnostic model. The red line represents the ultrasound diagnostic model. When the threshold probability is greater than 3%, the model has a relatively good net benefit. Abbreviation: FTC, follicular thyroid carcinoma. |
Validation of the Ultrasonic Diagnostic Model
The bootstrap method was used to verify the diagnosis model of FTC, and we obtained the C-index (0.818) of the validation group. This was very close to the C-index in the original model, so our model had a good application value.
Discussion
The overdiagnosis and overtreatment of thyroid nodules is a problem that has received more and more attention. The main reason for overdiagnosis is the increase in the use of thyroid ultrasound for healthy people, which resulted in a large number of asymptomatic thyroid nodules being diagnosed. The ultrasonic images of FA and FTC are very similar, which can easily lead to overdiagnosis. Among the indeterminate nodules after FNA, the risk of malignancy with an FNA reading of AUS/FLUS (Bethesda III) is 6–28% and 10–40% with FTN (Bethesda IV).15,16 However, FTC is easily metastasized to the lung, bone, and other tissues. The risk of distant metastasis in FTC ranges from 3.0% to 30%.17,18 And the American Thyroid Association (ATA) also recommended thyroidectomy for these indeterminate nodules.19 To avoid the risk, many patients choose to undergo thyroidectomy, which further leads to overtreatment of thyroid nodules. However, patients need to monitor thyroid hormone levels and take drugs for life after thyroidectomy, and also face the risk of the parathyroid gland and recurrent laryngeal nerve injury.20 In such a dilemma, the accurate preoperative diagnosis of FTC is particularly important.
There are many overlapping ultrasonic features between FTC and FA, so the evaluation of benign and malignant FTN based on individual ultrasonic features may easily lead to misdiagnosis. Besides, ultrasound is a subject with strong subjectivity, and the conclusions of examiners vary greatly. Therefore, we have established a relatively objective ultrasonic diagnostic model to identify the nature of FTN. A total of 13 relatively objective clinical and ultrasonic features were analyzed. By LASSO regression analysis, 10 valid features were included in the ultrasonic diagnostic model. They were location, size, echogenicity, calcification, composition, blood supply, “separated nodules sign”, peripheral halo, margins, and shape. Because these signs were weighted differently in the effectiveness of the diagnosis of FTC, they were assigned different scores in the model. The biggest advantage of the nomogram was that it can simply and clearly analyze the overall FTN, which is convenient for users to understand and apply. Moreover, the model had been evaluated and verified with accuracy, therefore, it had high stability.
In the model, the larger the nodule is, the higher the score would be. Both FTC and FA were large in size, and FTNs smaller than 1cm were rare.21 Among thyroid nodules included in this study, FTNs with a maximum diameter less than 1cm accounted for only 3.06% (6/196). Because they are all true tumors with genetic alterations, RAS mutations and PAX8/PPARγ rearrangements are both found in FTC and FA. RAS mutations are found in up to 40–50% of FTC and 20–40% of FA. PAX8/PPARγ fusions are found in 30–40% of FTC and a smaller percentage of FA (2–13%).22–25 Due to similar genetic, ultrasonic, and pathological changes, some scholars had proposed that FA may be the precancerous lesion of FTC.17 Our study found that the size of FTC was larger than that of FA, which further supported this view.
In our ultrasonic features studies, we found that FTN often presented as a large oval nodule divided into several smaller nodules, which we referred to as “separated nodules sign”. This sign was more common in FTC (32.53%, 27/83) than FA (5.31%, 6/113). It could predict FTC effectively, so it was given a high score. This sign could be more easily recognized by examinators, and the subjective difference between examinators was less, so we think that this feature was helpful in the diagnosis of FTC. This sonographic feature was similar to the “tubercle-in-nodule” reported by TUO and was considered to be a highly specific sonographic feature that could effectively distinguish FTC from FA.26
In addition to the size and the “separated nodules sign” mentioned above, other features such as blood supply and calcification were also given high weight in the model. In our study, both benign and malignant FTN were mainly characterized by rich blood supply, especially for FTC, with rich blood supply accounting for 90.36% (75/83). The intensity of blood flow may reflect the function and proliferation activity of tumor cells.27 FTC was easy to grow and large than relatively indolent PTC, and therefore required a rich blood supply to maintain. At the same time, the abundant blood supply also provided the basis for hematogenous metastasis.28
Microcalcification in PTC was seen microscopically as clumped psammoma bodies.29 It was rare in FTN. In our study, the calcifications of FTN were not that common, and most of them were macrocalcifications. Calcification was more common in FTC than in FA. This is mainly caused by hemorrhage and necrosis of the tumor. There were also reports that macrocalcification and eggshelled were helpful in the diagnosis of FTC.23,26
In the aspect of the peripheral halo of thyroid nodules, both FTC and FA were mainly accompanied by the peripheral halo, which was considered as the fibrous capsule of the nodules. The thickness of the peripheral halo was easily overlooked by examiners during the examination, so it required more careful observation. In our study, the discontinuous or irregular thick halo was more common in FTC, while a well-defined, thin halo was more frequently associated with FA. This was compatible with some other studies.30,31 It is considered that discontinuous or irregular thick halo was caused by desmoplastic reaction or fibrosis, which were stimulated and invaded by the FTC cells.
In terms of margins of the nodules, FTC does not show irregular margins obviously as PTC, in most cases, as an oval nodule with locally lobulated or irregular, so it needs more careful scan and observation. In our data, irregular margins were more common in FTC, consistent with relevant reports,27,32 which was an important diagnostic indicator. Therefore, it was assigned a high score in our nomogram. More pronounced than irregular margins are irregularly shaped nodules, although rare, they are with high specificity. The macroscopic irregular shape and capsular invasion strongly suggest the possibility of widely invasive FTC.
Conclusion
In this study, a new ultrasonic diagnostic model based on 10 clinical and ultrasonic features was constructed, which could be conveniently used to distinguish between FTC from FA during the ultrasound examination.
Abbreviations
ATA, American Thyroid Association; CI, confidence interval; DCA, decision curve analysis; FA, follicular adenoma; FNA, fine-needle aspiration; FTN, follicular thyroid neoplasm; FTC, follicular thyroid carcinoma; LASSO, Least Absolute Shrinkage and Selection Operator; NG, nodular goiter; PTC, papillary thyroid carcinoma.
Data Sharing Statement
All data used in this study are included in the article.
Ethics Approval and Informed Consent
This study was approved by the Ethics Committee of the First Affiliated Hospital of Fujian Medical University (2015-084-1). Due to the study was a retrospective analysis, patient consent to review their medical records was not required by the Ethics Committee of the First Affiliated Hospital of Fujian Medical University. All data were anonymized to comply with the provisions of personal data protection legislation. This study adhered to the tenets of the Declaration of Helsinki.
Author Contributions
All authors made a significant contribution to the work reported, whether that is in the conception, study design, execution, acquisition of data, analysis and interpretation, or in all these areas; took part in drafting, revising or critically reviewing the article; gave final approval of the version to be published; have agreed on the journal to which the article has been submitted; and agree to be accountable for all aspects of the work.
Funding
This work was supported by the Fujian Medical University Sailing Fund Project (No. 2018QH1085), Fujian Medical University Sailing Fund Project (No. 2018QH1086), Natural Science Foundation of Fujian (No. 2017J01289), and Medical Innovation Project of Fujian (No. 2017-CX-32).
Disclosure
The authors declare that there is no conflict of interest regarding the publication of this paper.
References
1. Rahman ST, McLeod DSA, Pandeya N, et al. Understanding pathways to the diagnosis of thyroid cancer: are there ways we can reduce over-diagnosis? Thyroid. 2019;29(3):341–348.
2. Seib CD, Sosa JA. Evolving understanding of the epidemiology of thyroid cancer. Endocrinol Metab Clin North Am. 2019;48(1):23–35.
3. Du L, Zhao Z, Zheng R, et al. Epidemiology of thyroid cancer: incidence and mortality in China, 2015. Front Oncol. 2020;10:1702. doi:10.3389/fonc.2020.01702
4. Podda M, Saba A, Porru F, Reccia I, Pisanu A. Follicular thyroid carcinoma: differences in clinical relevance between minimally invasive and widely invasive tumors. World J Surg Oncol. 2015;13:193. doi:10.1186/s12957-015-0612-8
5. Lee YM, Song DE, Kim TY, et al. Risk factors for distant metastasis in patients with minimally invasive follicular thyroid carcinoma. PLoS One. 2016;11(5):e0155489. doi:10.1371/journal.pone.0155489
6. Castellana M, Piccardo A, Virili C, et al. Can ultrasound systems for risk stratification of thyroid nodules identify follicular carcinoma? Cancer Cytopathol. 2020;128(4):250–259. doi:10.1002/cncy.22235
7. Trimboli P, Castellana M, Piccardo A, et al. The ultrasound risk stratification systems for thyroid nodule have been evaluated against papillary carcinoma. A meta-analysis. Rev Endocr Metab Disord. 2021;22(2):453–460. doi:10.1007/s11154-020-09592-3
8. Tessler FN, Middleton WD, Grant EG. Thyroid Imaging Reporting and Data System (TI-RADS): a user’s guide. Radiology. 2018;287(1):29–36. doi:10.1148/radiol.2017171240
9. Tessler FN, Middleton WD, Grant EG, et al. ACR Thyroid Imaging, Reporting and Data System (TI-RADS): white paper of the ACR TI-RADS committee. J Am Coll Radiol. 2017;14(5):587–595. doi:10.1016/j.jacr.2017.01.046
10. Girolami I, Marletta S, Pantanowitz L, et al. Impact of image analysis and artificial intelligence in thyroid pathology, with particular reference to cytological aspects. Cytopathology. 2020;31(5):432–444.
11. Eccher A, Girolami I. Current state of whole slide imaging use in cytopathology: pros and pitfalls. Cytopathology. 2020;31(5):372–378.
12. Park KW, Shin JH, Hahn SY, et al. Ultrasound-guided fine-needle aspiration or core needle biopsy for diagnosing follicular thyroid carcinoma? Clin Endocrinol. 2020;92(5):468–474.
13. Liu BJ, Zhang YF, Zhao CK, Wang HX, Li MX, Xu HX. Conventional ultrasound characteristics, TI-RADS category and shear wave speed measurement between follicular adenoma and follicular thyroid carcinoma. Clin Hemorheol Microcirc. 2020;75(3):291–301.
14. Huang YQ, Liang CH, He L, et al. Development and validation of a radiomics nomogram for preoperative prediction of lymph node metastasis in colorectal cancer. J Clin Oncol. 2016;34(18):2157–2164.
15. Cibas ES, Ali SZ. The 2017 bethesda system for reporting thyroid cytopathology. J Am Soc Cytopathol. 2017;6(6):217–222.
16. Inabnet WB
17. Daniels GH. Follicular thyroid carcinoma: a perspective. Thyroid. 2018;28(10):1229–1242.
18. Kwon MR, Shin JH, Park H, Cho H, Kim E, Hahn SY. Radiomics based on thyroid ultrasound can predict distant metastasis of follicular thyroid carcinoma. J Clin Med. 2020;9:7.
19. Haugen BR, Alexander EK, Bible KC, et al. 2015 American thyroid association management guidelines for adult patients with thyroid nodules and differentiated thyroid cancer: the American thyroid association guidelines task force on thyroid nodules and differentiated thyroid cancer. Thyroid. 2016;26(1):1–133.
20. Staubitz JI, Musholt PB, Musholt TJ. The surgical dilemma of primary surgery for follicular thyroid neoplasms. Best Pract Res Clin Endocrinol Metab. 2019;33(4):101292.
21. Kuo EJ, Roman SA, Sosa JA. Patients with follicular and hurthle cell microcarcinomas have compromised survival: a population level study of 22,738 patients. Surgery. 2013;154(6):
22. Yakushina VD, Lerner LV, Lavrov AV. Gene fusions in thyroid cancer. Thyroid. 2018;28(2):158–167.
23. Nikiforov YE. Molecular diagnostics of thyroid tumors. Arch Pathol Lab Med. 2011;135(5):569–577.
24. Kim M, Jeon MJ, Oh HS, et al. BRAF and RAS mutational status in noninvasive follicular thyroid neoplasm with papillary-like nuclear features and invasive subtype of encapsulated follicular variant of papillary thyroid carcinoma in Korea. Thyroid. 2018;28(4):504–510.
25. Vuong HG, Kondo T, Oishi N, et al. Paediatric follicular thyroid carcinoma - indolent cancer with low prevalence of RAS mutations and absence of PAX8-PPARG fusion in a Japanese population. Histopathology. 2017;71(5):760–768. doi:10.1111/his.13285
26. Kuo TC, Wu MH, Chen KY, Hsieh MS, Chen A, Chen CN. Ultrasonographic features for differentiating follicular thyroid carcinoma and follicular adenoma. Asian J Surg. 2020;43(1):339–346. doi:10.1016/j.asjsur.2019.04.016
27. Kobayashi K, Hirokawa M, Yabuta T, et al. Tumor protrusion with intensive blood signals on ultrasonography is a strongly suggestive finding of follicular thyroid carcinoma. Med Ultrason. 2016;18(1):25–29. doi:10.11152/mu.2013.2066.181.kok
28. Kim HJ, Sung JY, Oh YL, et al. Association of vascular invasion with increased mortality in patients with minimally invasive follicular thyroid carcinoma but not widely invasive follicular thyroid carcinoma. Head Neck. 2014;36(12):1695–1700. doi:10.1002/hed.23511
29. Tian Y, Lu Y, Zhao YZ, Shi YF, Zheng M, Li JC. [Characteristics of high-resolution ultrasound in the assessment of microcalcification of papillary thyroid carcinoma]. Zhongguo Yi Xue Ke Xue Yuan Xue Bao. 2018;40(3):378–384. Chinese.
30. Sillery JC, Reading CC, Charboneau JW, Henrichsen TL, Hay ID, Mandrekar JN. Thyroid follicular carcinoma: sonographic features of 50 cases. AJR Am J Roentgenol. 2010;194(1):44–54. doi:10.2214/AJR.09.3195
31. Zhang JZ, Hu B. Sonographic features of thyroid follicular carcinoma in comparison with thyroid follicular adenoma. J Ultrasound Med. 2014;33(2):221–227. doi:10.7863/ultra.33.2.221
32. Grani G, Lamartina L, Durante C, Filetti S, Cooper DS. Follicular thyroid cancer and Hurthle cell carcinoma: challenges in diagnosis, treatment, and clinical management. Lancet Diabetes Endocrinol. 2018;6(6):500–514. doi:10.1016/S2213-8587(17)30325-X
 © 2021 The Author(s). This work is published and licensed by Dove Medical Press Limited. The full terms of this license are available at https://www.dovepress.com/terms.php and incorporate the Creative Commons Attribution - Non Commercial (unported, v3.0) License.
By accessing the work you hereby accept the Terms. Non-commercial uses of the work are permitted without any further permission from Dove Medical Press Limited, provided the work is properly attributed. For permission for commercial use of this work, please see paragraphs 4.2 and 5 of our Terms.
© 2021 The Author(s). This work is published and licensed by Dove Medical Press Limited. The full terms of this license are available at https://www.dovepress.com/terms.php and incorporate the Creative Commons Attribution - Non Commercial (unported, v3.0) License.
By accessing the work you hereby accept the Terms. Non-commercial uses of the work are permitted without any further permission from Dove Medical Press Limited, provided the work is properly attributed. For permission for commercial use of this work, please see paragraphs 4.2 and 5 of our Terms.