")
Back to Journals » International Journal of General Medicine » Volume 14
Development and Validation of an Immune-Related Gene Pairs Signature in Grade II/III Glioma
Authors Zhang X, Ping S , Wang A, Li C, Zhang R , Song Z, Gao C, Wang F
Received 19 August 2021
Accepted for publication 8 November 2021
Published 23 November 2021 Volume 2021:14 Pages 8611—8620
DOI https://doi.org/10.2147/IJGM.S335052
Checked for plagiarism Yes
Review by Single anonymous peer review
Peer reviewer comments 4
Editor who approved publication: Dr Scott Fraser
Xu Zhang,1,* Shuai Ping,2,* Anni Wang,3 Can Li,4 Rui Zhang,5 Zimu Song,3 Caibin Gao,3 Feng Wang6
1Department of Neurosurgery, Baoding No.1 Central Hospital, Baoding, People’s Republic of China; 2Department of Orthopaedics, Liyuan Hospital, Tongji Medical College, Huazhong University of Science and Technology, Wuhan, People’s Republic of China; 3Department of Neurosurgery, General Hospital of Ningxia Medical University, Yinchuan, People’s Republic of China; 4Department of Neurosurgery, Chengdu Sixth People’s Hospital, Chengdu, People’s Republic of China; 5Ningxia Key Laboratory of Cerebrocranial Disease, Incubation Base of National Key Laboratory, Ningxia Medical University, Yinchuan, People’s Republic of China; 6Department of Neurosurgery, People’s Hospital of Ningxia Hui Autonomous Region Yinchuan, Yinchuan, People’s Republic of China
*These authors contributed equally to this work
Correspondence: Feng Wang Email [email protected]
Background: Gliomas are prevalent primary intracerebral malignant tumors. Increasing evidence indicates an association between the immune signature and Grade II/III glioma prognosis. Thus, we aimed to develop an immune-related gene pair (IRGP) signature that can be used as a prognostic tool in Grade II/III glioma.
Methods: The gene expression levels and clinical information of Grade II/III glioma patients were collected from The Cancer Genome Atlas (TCGA) and Chinese Glioma Genome Atlas (CGGA) databases. The TCGA data were randomly divided into a training cohort (n = 249) and a validation cohort (n = 162), and a CGGA dataset served as an external validation group (n = 605). IRGPs significantly associated with prognosis were selected by Cox regression. Gene set enrichment analysis and filtration were performed with the IRGPs.
Results: Within a set of 1991 immune genes, 8 IRGPs including 15 unique genes that significantly affect survival constituted a gene signature. In the validation datasets, the IRGP signature significantly stratified patients with Grade II/III glioma into low- and high-risk groups (P < 0.001), and the IRGP index was found to be an independent prognostic factor through univariate and multivariate analyses (P < 0.05). Additionally, 26 functional pathways were identified through the intersection of Gene Set Enrichment Analysis (GSEA) and Gene Ontology (GO) enrichment analysis.
Conclusion: The IRGP signature demonstrated good prognostic value for Grade II/III gliomas, which may provide new insights into individual treatment for glioma patients. The IRGPs might function through the identified 26 functional pathways.
Keywords: glioma, prognosis, immune-related gene pairs, TCGA, CGGA
Introduction
Gliomas are prevalent primary intracerebral malignant tumors.1 To date, surgical resection combined with postoperative chemoradiotherapy is the standard treatment for Grade II/III gliomas. Although much effort has been put forth to improve the clinical outcome, more than one-half of people diagnosed with Grade II/III glioma experience recurrence or progression to high-grade glioma over time.2 Moreover, in addition to conventional surgical therapy, patients with Grade II/III glioma have limited sensitivity to chemotherapy and radiotherapy.3,4 Hence, it is suggested that other prognostic factors for Grade II/III glioma remain to be discovered. Several biomarkers, including codeletion of chromosome arms 1p and 19q (1p/19q codeletion), O-6-methylguanine-DNA methyltransferase (MGMT) methylation and isocitrate dehydrogenase (IDH) mutation, have been added to the 2016 WHO classification to clarify the histological features and to guide the therapeutic plan for Grade II/III glioma patients.5–8 However, these widely recognized biomarkers cannot be effectively used to evaluate individual risk stratification for people with Grade II/III glioma.
The tumor microenvironment (TME) has attracted considerable attention as a vital cellular milieu due to its pivotal roles in tumor initiation, progression, and metastasis. The TME consists of mesenchymal cells, inflammatory mediators, endothelial cells, immune cells and stromal cells.9 Additionally, immune cells and stromal cells are two main nontumor components that have great importance in the diagnosis and prognosis of tumors.10 A prevalent algorithm called ESTIMATE designed by Yoshihara et al has been used to evaluate the types of immune cells and stromal cells residing in many malignant tumors.11–13 In this study, we also employed this algorithm for our research.
The glioma immune microenvironment plays an essential role in glioma biology.14 Immune checkpoint inhibitors and immunotherapy play roles in improving the glioma prognosis in patients.15,16 Regarding prognostic biomarkers, researchers have explored the possibility of stratifying patients with malignant tumors (including gliomas) based on gene expression profiles and have constructed a multigene expression model that can be applied to stratify high-risk subgroups.17–22 One common drawback of these studies is that gene expression profiles require suitable normalization. However, owing to technical biases across sequencing platforms and biological heterogeneity, the profiles obtained inevitably show variations.23 Thus, researchers have developed the concept of immune-related gene pairs, which can eliminate the disadvantages of data processing and is considered to be a robust prognostic indicator for some tumors.24–29
However, the prognostic value of these immune-related gene pairs has not been estimated in patients with Grade II/III glioma. Our study constructed and validated a personal prognostic indicator by integrating immune-related gene pairs found in Grade II/III glioma.
Materials and Methods
Acquisition of Grade II/III Glioma Expression Profiles from TCGA and CGGA Datasets
The RNA-seq fragments per kilobase per million (FPKM) expression data and clinical information of 515 Grade II/III glioma patient samples were downloaded and selected from the TCGA database (https://portal.gdc.cancer.gov). Then we deleted 104 non-frozen specimens and used the caret package in R software to randomly divide the TCGA data into two cohorts. The mRNA sequencing and clinical data of 605 Grade II/III glioma samples were downloaded from the CGGA database (http://www.cgga.org.cn).
Acquisition of Immune-Related Genes
We downloaded a comprehensive list of immune-related genes (IRGs) from the Immunology Database and Analysis Portal (ImmPort) database (https://www.immport.org). Then, the limma package in R software was utilized to extract the RNA expression profiles of these IRGs (determined by median absolute deviation, MAD > 0.5).30
Establishment of a Prognostic Signature Based on Immune-Related Gene Pairs
A pairwise comparison of each sample’s immune-related gene expression levels was performed to acquire a score for each IRGP. IRGP scores were determined as follows: (1) if IRG 1 > IRG 2, then IRGP = 1 and (2) if IRG1 < IRG 2, then IRGP = 0. The superiority of analyzing genes in a pairwise method is that the need for normalization steps for individualized analysis is eliminated.29 If the score of an IRGP is 0 or 1 in more than 80% of the samples obtained from the TCGA or CGGA database, then we discarded the IRGP. Then, we applied least absolute shrinkage and selection operator (LASSO) Cox regression (iteration = 1000) to generate an IRGP index (IRGPI) by using the R package glmnet. To stratify patients into high- and low-risk groups, the optimal cutoff value for the IRGPI was determined by receiver operating characteristic (ROC) curve analysis of 3-year overall survival data in the TCGA training cohort.
Validation of the IRGPI
We further evaluated the IRGPI model with the validation cohorts consisting of Grade II/III glioma samples in the TCGA database and CGGA database by Log rank test. Additionally, we assessed the IRGPI and other clinical variables through univariate and multivariate Cox proportional hazard regression models using TCGA and CGGA datasets.
Profiling of Infiltrating Immune Cells
To clarify immune cell infiltration in different risk groups, we used CIBERSORT,31 an algorithm frequently used for exploring tumor tissue cell composition on the basis of gene expression profiles. The gene expression profile was uploaded to the online analytical platform CIBERSORT web portal (http://cibersort.stanford.edu) using the default signature matrix at 1000 permutations. Then, p-values were calculated by using the “wilcox.test” function in R.
Gene Set Enrichment Analysis and Filtration of the Results
To understand the biological functions of the immune-related prognostic signature, we performed gene set enrichment analysis (GSEA/MSigDB, http://software.broadinstitute.org/gsea/downloads.jsp). A false discovery rate-adjusted P<0.05 was considered statistically significant. To obtain a comprehensive understanding of some biological functions, we filtered the outcome of GSEA from the perspective of the tumor microenvironment. Immune and stromal scores were calculated using the ESTIMATE algorithm,11 and immune scores and stromal scores were stratified into low-level groups and high-level groups according to their median value. Then, we acquired the differentially expressed genes (DEGs) common to the stromal scores and immune scores, as determined by the VennDiagram package.32 Additionally, we conducted gene ontology (GO) enrichment analysis based on these DEGs. Finally, we evaluated the results between the GO analysis and GSEA by using the Venn Diagram package.
Statistical Analysis
All statistical analyses were performed using R software (version 3.5.1, https://www.r-project.org). For all tests, a p-value < 0.05 indicated a significant difference. Significance is shown as *P<0.05, **P<0.01, and ***P<0.001.
Results
Prognostic IRGP Signature Construction
Data on 1119 patients with Grade II/III glioma were included in the analysis (Supplementary Table 1). A TCGA cohort was used as the training dataset. Altogether, 1991 immune-related genes (IRGs) were downloaded from the ImmPort database (accessed on 10/5/2020). A total of 372 IRGs were identified in both the TCGA and CGGA datasets (MAD > 0.5). From these 372 IRGs, 15,245 IRGPs were constructed. After discarding IRGPs with relatively small variation (MAD = 0), 22 IRGPs remained, and they were selected as the initial IRGPs. Then, we defined the IRGPI by Lasso Cox proportional hazards regression using the training set and selected 8 IRGPs for the final model. The IRGPI consisted of 15 unique IRGs (Table 1). The optimal cutoff value in the IRGPI for the prediction of Grade II/III glioma prognosis was determined by ROC curve data analysis to be 0.395 (Supplementary Figure 1). ROC curves were also analyzed to validate the impact of clinical characteristics on the risk score in the training cohort of the TCGA dataset (Figure 1A) and in the CGGA dataset (Figure 1B). The five-year ROC curve in the training cohort has an AUC of 0.864 (Figure 1C). The AUC of five-year ROC curve in the external validation cohort is 0.701 (Figure 1D). The IRGPI significantly stratified patients into low- and high-risk groups on the basis of overall survival (OS). We found that in the TCGA training cohort, the high-risk group had a profoundly inferior OS than the low-risk group (P<0.001, Figure 2A). To further investigate the prognostic value of the IRGPI, we applied univariate and multivariate Cox regression to the training cohort. After combining with clinical factors such as age, sex, and tumor grade, the risk score of the IRGPI remained an independent prognostic factor (P<0.001, HR, 2.684 [2.230, 4.046]; Figure 2D and G).
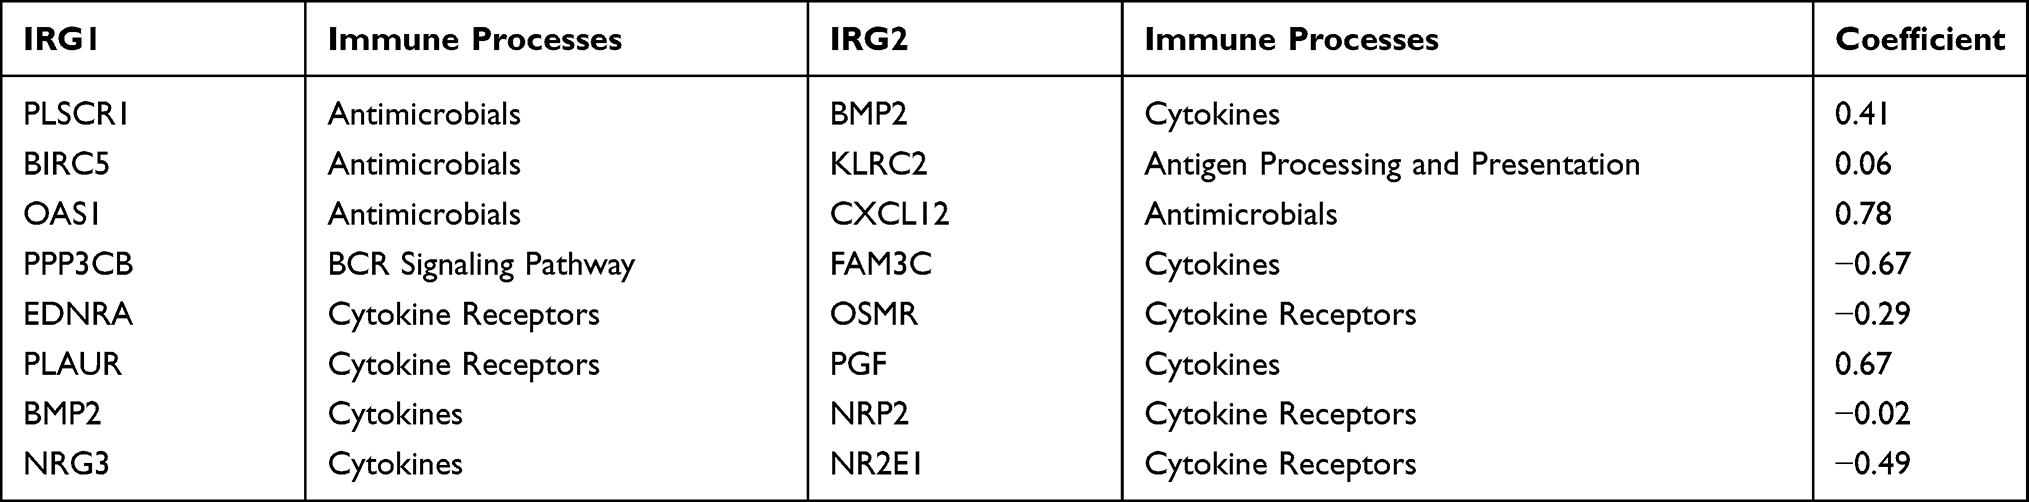 |
Table 1 Model Information About IRGPI |
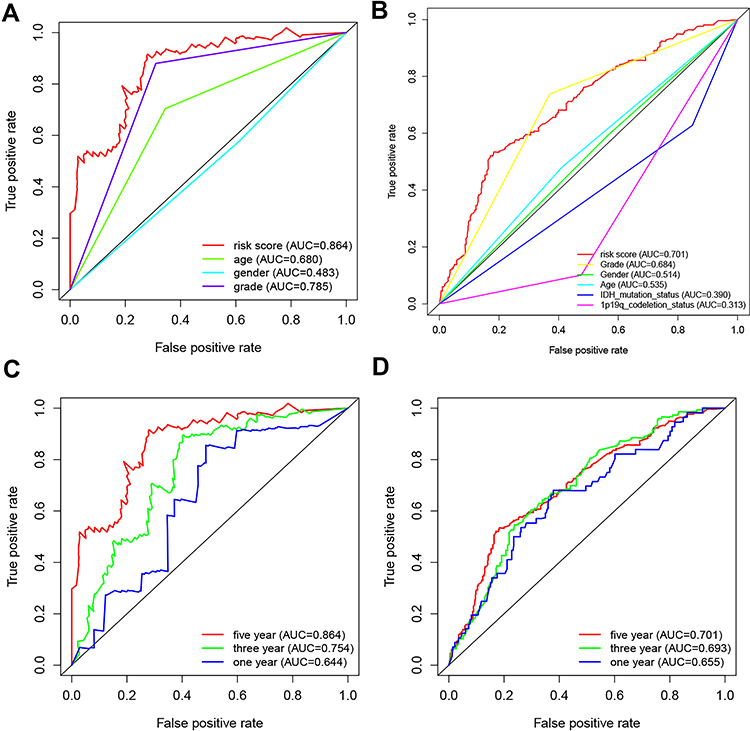 |
Figure 1 A comparison of 5-year ROC curves with other common clinical characteristics showed the superiority of the risk score in the training cohort (A) and in the external validation cohort (B). The 1-, 3-, and 5-year survival ROC curves of training (C) and external validation cohorts (D). |
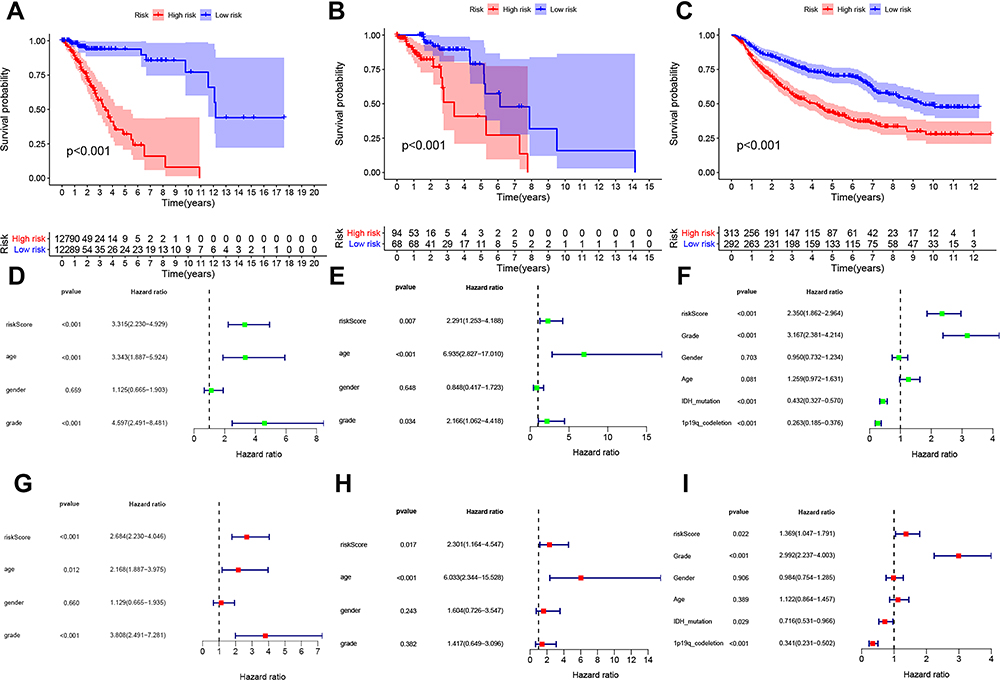 |
Figure 2 Analysis of survival and independent prognostic factors. Kaplan-Meier curves of overall survival (OS) among different IRGPI risk groups (low vs high risk). OS among patients in training (A), internal (B) and external validation cohorts (C). The risk score of IRGPI was an independent prognostic factor among univariate (D) and multivariate (G) analyses in the training database. The risk score of IRGPI was an independent prognostic factor among univariate (E) and multivariate (H) analyses in the internal validation cohort. The risk score of IRGPI was also an independent prognostic factor among univariate (F) and multivariate (I) analyses in the external validation cohort. |
Validation of the IRGPI for Use in Survival Prediction
To confirm whether the IRGPI shows consistent prognostic value in different populations, we applied the IRGPI signature to the TCGA validation cohort for internal validation and to the CGGA validation cohort for external validation. Unsurprisingly, in both validation cohorts of TCGA data and the CGGA data, the high-risk patients exhibited a significantly shorter OS than the low-risk patients (P<0.001, Figure 2B and C). Additionally, the IRGPI remained an independent prognostic factor after taking clinical factors such as age, sex, tumor grade, IDH and 1p/19q into consideration (P<0.05, HR, 2.301 [1.164, 4.547]; Figure 2E and H), (P<0.05, HR, 1.369 [1.047, 1.791]; Figure 2F and I). The association between risk score, IDH mutation status and 1p/19q codeletion status was further evaluated, and the results showed that the groups with IDH mutations and 1p/19q codeletion had lower risk scores (P<0.001, Figure 3A and B).
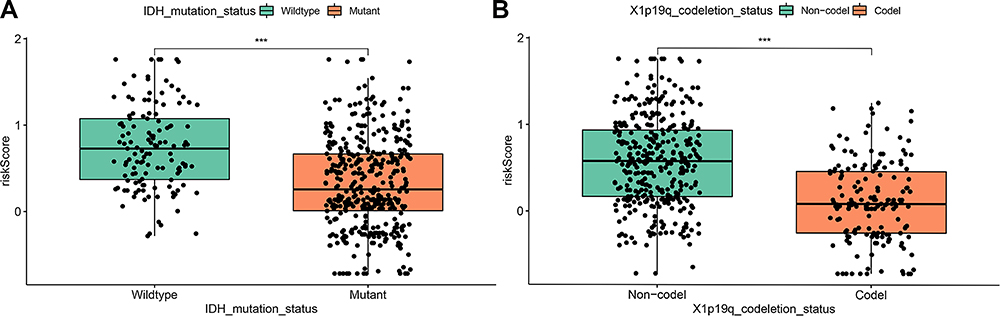 |
Figure 3 The association between risk score with IDH mutation status (A) and 1p/19q co-deletion status (B). |
Immune Cell Infiltration Between Different Risk Groups
We carried out an immune cell infiltration analysis to better understand the difference in immune cell infiltration between the low-risk and high-risk groups. Figure 4A presents a summary of the comparison of the CIBERSORT results for the two risk groups. We found that M1 macrophages and CD8 T cells were significantly more highly expressed in the high-risk group (P=1.757e-04, Figure 4B; P=0.002, Figure 4D), while monocytes were significantly more highly expressed in the low-risk group (P=5.749e-05, Figure 4C). Moreover, Macrophage M0 and T cells CD4 memory activated were also highly expressed in the high-risk group in our study (P=0.004, Supplementary Figure 2A; P=0.033, Supplementary Figure 2B).
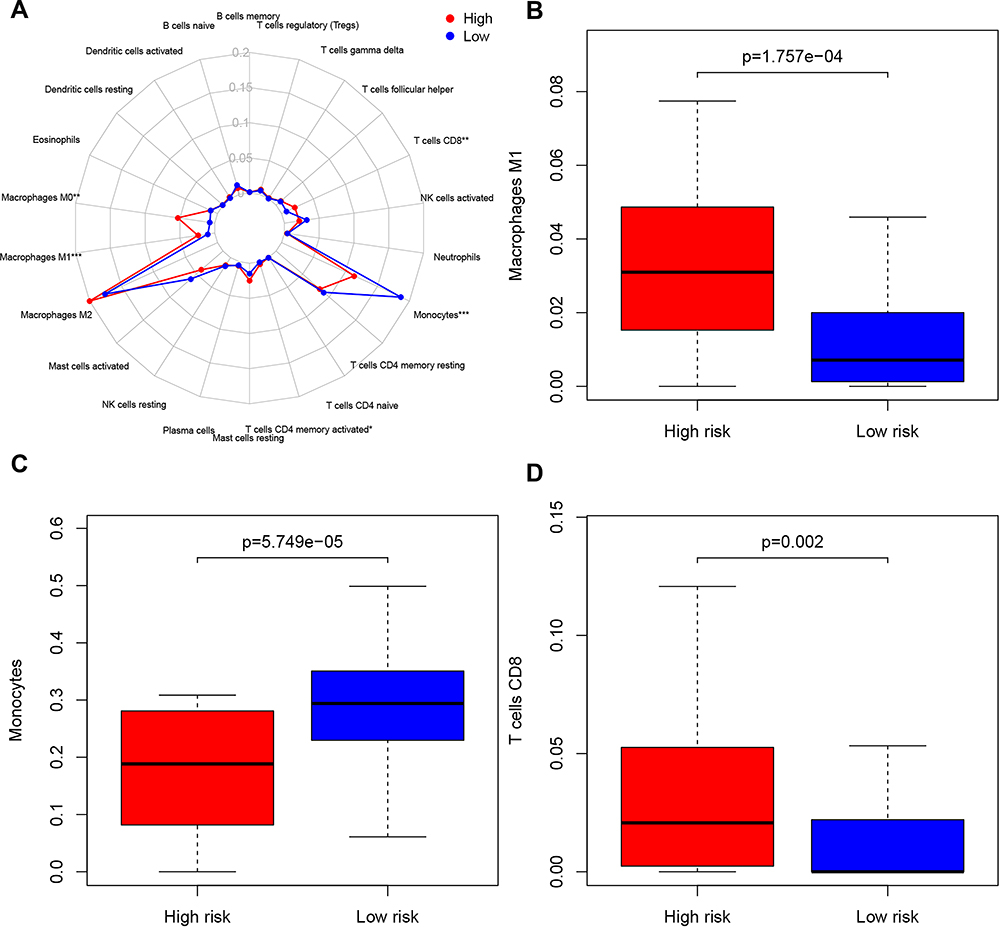 |
Figure 4 Immune infiltration situation between IRGPI risk groups. (A) Summary of the outcome estimated by CIBERSORT in different risk groups. (B) Macrophages M1 was significantly highly expressed in the high-risk group (P=1.757e-04). (C) Monocytes were significantly highly expressed in the low-risk group (P=5.749e-05). (D) T cells CD8 was significantly highly expressed in the high-risk group (P=0.002). |
Gene Set Enrichment Analysis and Filtration of the Results
We carried out a GSEA between the low- and high-risk groups to explore the pathways that were significantly different. We found that 299 pathways were quite different (Supplementary Table 2). Then, we selected 50 pathways with minimally adjusted P-values for filtration. According to the statistical analysis, 1199 upregulated DEGs and 296 downregulated DEGs in the stromal score group were selected. A total of 965 upregulated DEGs and 692 downregulated DEGs were selected in the immune score group. Then, 887 upregulated intersecting genes and 277 downregulated intersecting genes were identified in Venn plots (Figure 5A and B). The Gene Ontology (GO) analysis of these intersecting genes is shown in Figure 5C. Finally, we examined the intersection of GO and GSEA results and identified 26 functional pathways (Supplementary Figure 3, Table 2).
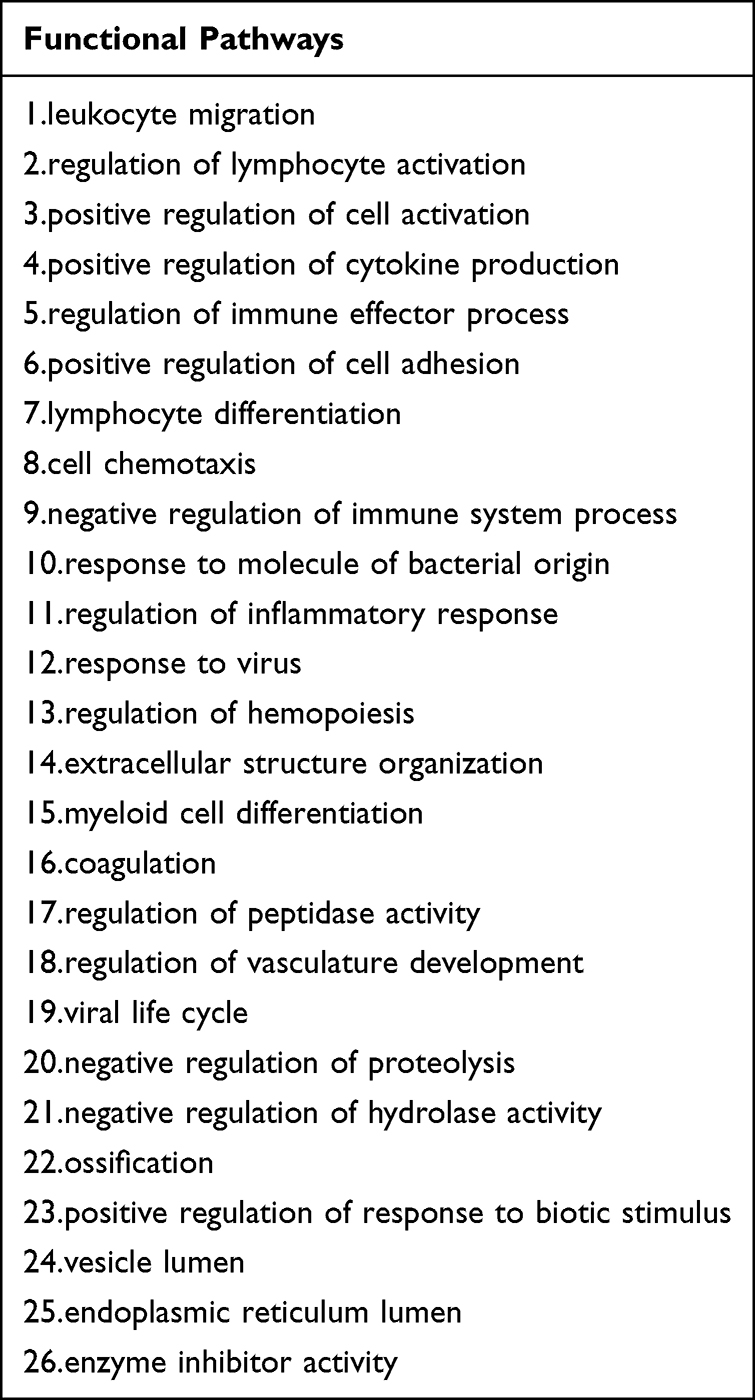 |
Table 2 The Intersection Functional Pathways Between GO and GSEA |
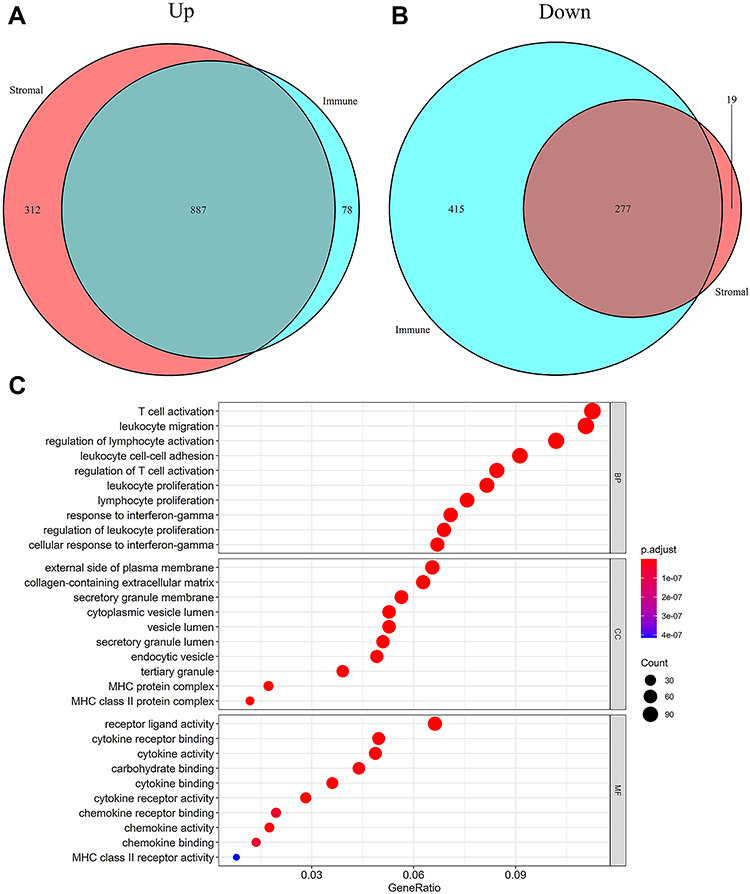 |
Figure 5 Differentially expressed genes analyses in TCGA dataset. (A) 887 up-regulated intersected genes and (B) 277 down-regulated intersected genes were revealed in venn plots. The gene ontology (GO) analysis of these intersected genes (C). |
Discussion
We constructed an immune-related gene pair signature in the present study and validated this signature in internal and external datasets. Our research showed that the signature can be used to stratify patients into low- and high-risk groups. Univariate and multivariate Cox regression analyses showed that the risk score was an independent prognostic factor. This prognostic signature related to the tumor immune microenvironment offers a new perspective on developing novel predictive biomarkers and improving Grade II/III glioma patient management in the era of immunotherapy.
Similar to other studies, several immune cells were distributed significantly differently in our research. For example, we found that CD8 T cells and M0 macrophages were greatly enriched in the high-risk group. Wu et al27 also showed the same trend, although it was not statistically significant. In contrast, results from one study indicated that CD8 T cells were significantly higher in the low-risk group.28 This disparity may be a result of differences in immune-related gene pairs and tumor types in the aforementioned studies. Thus, further exploration is needed. Additionally, we identified 26 functional pathways from the intersection of the GO analysis and GSEA results, which may indicate that these immune-related gene pairs function through these pathways.
Despite recently improved prognosis for certain Grade II/III glioma patients, the disease in 70% of patients inevitably progresses to high‐grade aggressive glioma and eventually results in death.33 Over the past 30 years, the overall survival of the majority of patients with Grade II/III glioma has not significantly improved.2 Thus, it is vital to develop an individualized treatment protocol for patients with Grade II/III glioma. Reliable prognostic biomarkers may identify patients with poor outcomes who might benefit from intensive therapy. Recently, significant research on immune-related gene (IRG) expression has shown great prognostic value in Grade II/III glioma. For example, Deng et al34 found that 397 IRGs were significantly associated with Grade II/III glioma survival. Our risk model also showed great prognostic value in Grade II/III glioma. However, there is room for improvement in the effect of current gene-targeted therapy. Through our research, we are trying to find new gene targets. The immune-related gene pair signature depends on relative ranking and paired comparisons of gene expression profiles within a sample. This strategy is favorable for use with combined gene expression profiles obtained from multiple databases. Patients with Grade II/III glioma can be classified into subgroups with different survival outcomes through this prognostic immune signature. Therefore, our signature can be used to evaluate Grade II/III glioma prognosis in a single-sample, individualized form.
Our 8-IRGP signature consists of 15 immune-related genes that play vital roles in regulating the immune microenvironment. Bone morphogenetic protein 2 (MP2) is known to facilitate differentiation and growth inhibition in glioma through the downregulation of both O6-methylguanine-DNA methyltransferase (MGMT) and hypoxia-inducible factor-1a (HIF-1a).35 It has been reported that killer cell lectin-like receptor subfamily C member 2 (KLRC2), a transmembrane receptor that activates natural killer cells, is expressed at higher levels in glioma-initiating cells than in neural stem cell lines and normal adult brain tissue.36 Emerging evidence suggests that chemokine (C-X-C motif) ligand 12 (CXCL12), which is secreted from glioma stem cells (GSCs), plays vital roles in tumorigenesis and proliferation.37 Additionally, many of the selected 26 functional pathways are related to the immune microenvironment, such as regulation of the immune effector process, positive regulation of cytokine production, and cell chemotaxis. Studies have shown that numerous cytokines and chemokines promote the infiltration of various cells, including circulating progenitor cells, endothelial cells, and a range of immune cells, such as peripheral macrophages, microglia, leukocytes, and CD4+ T cells, into gliomas.38–40 These non-neoplastic cells play essential roles in tumor growth, metastasis, and response to treatment.14 Thus, these functional pathways are important in the glioma immune microenvironment.
There are also some limitations to this study. First, immune-related gene expression profiles were determined by RNA-seq, and they are difficult to generalize for use in daily clinical applications because of the sophisticated detection program needed and high cost. Second, our study was a retrospective analysis, so prospective research and some related basic experiments are needed to validate the results.
Conclusion
In summary, we systematically estimated the prognostic value of a new IRGP prognostic model, which may provide a legitimate approach to Grade II/III glioma management. Additionally, we identified 26 functional pathways from a GO analysis and GSEA, indicating that these immune-related gene pairs function through these pathways.
Data Sharing Statement
The datasets generated and analysed during the current study are available in the TCGA (https://portal.gdc.cancer.gov) and CGGA (http://www.cgga.org.cn) repositories.
Ethics Approval and Informed Consent
Ethical approval was waived by the local Ethics Committee of Ningxia Medical University for the data of patients are downloaded from public databases. The study conforms to the Declaration of Helsinki.
Acknowledgments
This manuscript has been released as a pre-print at [https://www.researchsquare.com/article/rs-35147/v1], ([Zhang] et al.41)
Funding
This work was supported by grants from the National Natural Science Foundation of China (81660226).
Disclosure
Xu Zhang and Shuai Ping are co-first authors for this study. The authors declare that they have no competing interests.
References
1. Wesseling P, Capper D. WHO 2016 Classification of gliomas. Neuropathol Appl Neurobiol. 2018;44(2):139–150. doi:10.1111/nan.12432
2. Claus EB, Walsh KM, Wiencke JK, et al. Survival and low-grade glioma: the emergence of genetic information. Neurosurg Focus. 2015;38(1):E6. doi:10.3171/2014.10.FOCUS12367
3. Yan Y, Li Z, Zeng S, Wang X, Gong Z, Xu Z. FGFR2-mediated phosphorylation of PTEN at tyrosine 240 contributes to the radioresistance of glioma. J Cell Commun Signal. 2019;13(3):279–280. doi:10.1007/s12079-019-00518-6
4. Yan Y, Xu Z, Dai S, Qian L, Sun L, Gong Z. Targeting autophagy to sensitive glioma to temozolomide treatment. J Exp Clin Cancer Res. 2016;35:23. doi:10.1186/s13046-016-0303-5
5. Louis DN, Perry A, Burger P, et al. International Society Of Neuropathology–Haarlem consensus guidelines for nervous system tumor classification and grading. Brain Pathol. 2014;24(5):429–435. doi:10.1111/bpa.12171
6. Hartmann C, Hentschel B, Wick W, et al. Patients with IDH1 wild type anaplastic astrocytomas exhibit worse prognosis than IDH1-mutated glioblastomas, and IDH1 mutation status accounts for the unfavorable prognostic effect of higher age: implications for classification of gliomas. Acta Neuropathol. 2010;120(6):707–718. doi:10.1007/s00401-010-0781-z
7. Louis DN, Perry A, Reifenberger G, et al. The 2016 World Health Organization Classification of Tumors of the Central Nervous System: a summary. Acta Neuropathol. 2016;131(6):803–820. doi:10.1007/s00401-016-1545-1
8. Wick W, Meisner C, Hentschel B, et al. Prognostic or predictive value of MGMT promoter methylation in gliomas depends on IDH1 mutation. Neurology. 2013;81(17):1515–1522. doi:10.1212/WNL.0b013e3182a95680
9. Wu T, Dai Y. Tumor microenvironment and therapeutic response. Cancer Lett. 2017;387:61–68. doi:10.1016/j.canlet.2016.01.043
10. Ni J, Liu S, Qi F, et al. Screening TCGA database for prognostic genes in lower grade glioma microenvironment. Ann Transl Med. 2020;8(5):209. doi:10.21037/atm.2020.01.73
11. Yoshihara K, Shahmoradgoli M, Martinez E, et al. Inferring tumour purity and stromal and immune cell admixture from expression data. Nat Commun. 2013;4:2612. doi:10.1038/ncomms3612
12. Shah N, Wang P, Wongvipat J, et al. Regulation of the glucocorticoid receptor via a BET-dependent enhancer drives antiandrogen resistance in prostate cancer. Elife. 2017;6:215.
13. Alonso MH, Ausso S, Lopez-Doriga A, et al. Comprehensive analysis of copy number aberrations in microsatellite stable colon cancer in view of stromal component. Br J Cancer. 2017;117(3):421–431. doi:10.1038/bjc.2017.208
14. Gieryng A, Pszczolkowska D, Walentynowicz KA, Rajan WD, Kaminska B. Immune microenvironment of gliomas. Lab Invest. 2017;97(5):498–518. doi:10.1038/labinvest.2017.19
15. Vismara MFM, Donato A, Malara N, Presta I, Donato G. Immunotherapy in gliomas: are we reckoning without the innate immunity? Int J Immunopathol Pharmacol. 2019;33:2058738419843378. doi:10.1177/2058738419843378
16. Simonelli M, Persico P, Perrino M, et al. Checkpoint inhibitors as treatment for malignant gliomas: “A long way to the top”. Cancer Treat Rev. 2018;69:121–131. doi:10.1016/j.ctrv.2018.06.016
17. Ascierto ML, Kmieciak M, Idowu MO, et al. A signature of immune function genes associated with recurrence-free survival in breast cancer patients. Breast Cancer Res Treat. 2012;131(3):871–880. doi:10.1007/s10549-011-1470-x
18. Kim K, Jeon S, Kim TM, Jung CK. Immune Gene Signature Delineates a Subclass of Papillary Thyroid Cancer with Unfavorable Clinical Outcomes. Cancers. 2018;10(12):494. doi:10.3390/cancers10120494
19. Shen S, Wang G, Zhang R, et al. Development and validation of an immune gene-set based Prognostic signature in ovarian cancer. EBioMedicine. 2019;40:318–326. doi:10.1016/j.ebiom.2018.12.054
20. Yang W, Lai Z, Li Y, et al. Immune signature profiling identified prognostic factors for gastric cancer. Chin J Cancer Res. 2019;31(3):463–470. doi:10.21147/j.issn.1000-9604.2019.03.08
21. Zhang M, Wang X, Chen X, Zhang Q, Hong J. Novel Immune-Related Gene Signature for Risk Stratification and Prognosis of Survival in Lower-Grade Glioma. Front Genet. 2020;11:363. doi:10.3389/fgene.2020.00363
22. Cheng W, Ren X, Zhang C, et al. Bioinformatic profiling identifies an immune-related risk signature for glioblastoma. Neurology. 2016;86(24):2226–2234. doi:10.1212/WNL.0000000000002770
23. Leek JT, Scharpf RB, Bravo HC, et al. Tackling the widespread and critical impact of batch effects in high-throughput data. Nat Rev Genet. 2010;11(10):733–739. doi:10.1038/nrg2825
24. Xiong Y, Liu L, Bai Q, et al. Individualized immune-related gene signature predicts immune status and oncologic outcomes in clear cell renal cell carcinoma patients. Urol Oncol. 2020;38(1):
25. Sun XY, Yu SZ, Zhang HP, Li J, Guo WZ, Zhang SJ. A signature of 33 immune-related gene pairs predicts clinical outcome in hepatocellular carcinoma. Cancer Med. 2020;9(8):2868–2878. doi:10.1002/cam4.2921
26. Chen W, Ou M, Tang D, Dai Y, Du W. Identification and Validation of Immune-Related Gene Prognostic Signature for Hepatocellular Carcinoma. J Immunol Res. 2020;2020:5494858. doi:10.1155/2020/5494858
27. Wu J, Zhao Y, Zhang J, Wu Q, Wang W. Development and validation of an immune-related gene pairs signature in colorectal cancer. Oncoimmunology. 2019;8(7):1596715. doi:10.1080/2162402X.2019.1596715
28. Zhang L, Zhu P, Tong Y, et al. An immune-related gene pairs signature predicts overall survival in serous ovarian carcinoma. Onco Targets Ther. 2019;12:7005–7014. doi:10.1152/ajplegacy.1975.229.6.1641
29. Li B, Cui Y, Diehn M, Development LR. Validation of an Individualized Immune Prognostic Signature in Early-Stage Nonsquamous Non-Small Cell Lung Cancer. JAMA Oncol. 2017;3(11):1529–1537. doi:10.1001/jamaoncol.2017.1609
30. Ritchie ME, Phipson B, Wu D, et al. limma powers differential expression analyses for RNA-sequencing and microarray studies. Nucleic Acids Res. 2015;43(7):e47. doi:10.1093/nar/gkv007
31. Newman AM, Liu CL, Green MR, et al. Robust enumeration of cell subsets from tissue expression profiles. Nat Methods. 2015;12(5):453–457. doi:10.1038/nmeth.3337
32. Chen H, Boutros PC. VennDiagram: a package for the generation of highly-customizable Venn and Euler diagrams in R. BMC Bioinform. 2011;12:35. doi:10.1186/1471-2105-12-35
33. Kiran M, Chatrath A, Tang X, Keenan DM, Dutta A, Prognostic A. Signature for Lower Grade Gliomas Based on Expression of Long Non-Coding RNAs. Mol Neurobiol. 2019;56(7):4786–4798. doi:10.1007/s12035-018-1416-y
34. Deng X, Lin D, Zhang X, et al. Profiles of immune-related genes and immune cell infiltration in the tumor microenvironment of diffuse lower-grade gliomas. J Cell Physiol. 2020;235(10):7321–7331. doi:10.1002/jcp.29633
35. Persano L, Pistollato F, Rampazzo E, et al. BMP2 sensitizes glioblastoma stem-like cells to Temozolomide by affecting HIF-1alpha stability and MGMT expression. Cell Death Dis. 2012;3:e412. doi:10.1038/cddis.2012.153
36. Ishihara E, Takahashi S, Fukaya R, Ohta S, Yoshida K, Toda M. Identification of KLRC2 as a candidate marker for brain tumor-initiating cells. Neurol Res. 2019;41(11):1043–1049. doi:10.1080/01616412.2019.1672390
37. Uemae Y, Ishikawa E, Osuka S, et al. CXCL12 secreted from glioma stem cells regulates their proliferation. J Neurooncol. 2014;117(1):43–51. doi:10.1007/s11060-014-1364-y
38. Fecci PE, Mitchell DA, Whitesides JF, et al. Increased regulatory T-cell fraction amidst a diminished CD4 compartment explains cellular immune defects in patients with malignant glioma. Cancer Res. 2006;66(6):3294–3302. doi:10.1158/0008-5472.CAN-05-3773
39. Alexiou GA, Vartholomatos G, Karamoutsios A, Batistatou A, Kyritsis AP, Voulgaris S. Circulating progenitor cells: a comparison of patients with glioblastoma or meningioma. Acta Neurol Belg. 2013;113(1):7–11. doi:10.1007/s13760-012-0097-y
40. Wainwright DA, Dey M, Chang A, Lesniak MS. Targeting Tregs in Malignant Brain Cancer: overcoming IDO. Front Immunol. 2013;4:116. doi:10.3389/fimmu.2013.00116
41. Zhang X, Ping S, Zhang R, et al. Development and validation of an immune-related gene pairs signature in lower-grade glioma. 2020. doi:10.21203/rs.3.rs-35147/v1
 © 2021 The Author(s). This work is published and licensed by Dove Medical Press Limited. The full terms of this license are available at https://www.dovepress.com/terms.php and incorporate the Creative Commons Attribution - Non Commercial (unported, v3.0) License.
By accessing the work you hereby accept the Terms. Non-commercial uses of the work are permitted without any further permission from Dove Medical Press Limited, provided the work is properly attributed. For permission for commercial use of this work, please see paragraphs 4.2 and 5 of our Terms.
© 2021 The Author(s). This work is published and licensed by Dove Medical Press Limited. The full terms of this license are available at https://www.dovepress.com/terms.php and incorporate the Creative Commons Attribution - Non Commercial (unported, v3.0) License.
By accessing the work you hereby accept the Terms. Non-commercial uses of the work are permitted without any further permission from Dove Medical Press Limited, provided the work is properly attributed. For permission for commercial use of this work, please see paragraphs 4.2 and 5 of our Terms.