")
Back to Journals » Journal of Inflammation Research » Volume 15
Development and Validation of an Age-Related Gastric Cancer-Specific Immune Index
Authors Wang H , Yin X , Fang T , Lou S, Han B , Gao J , Wang Y , Zhang D , Wang X , Lu Z , Wu J , Zhang J , Wang Y, Zhang Y , Xue Y
Received 5 September 2022
Accepted for publication 8 November 2022
Published 23 November 2022 Volume 2022:15 Pages 6393—6407
DOI https://doi.org/10.2147/JIR.S388792
Checked for plagiarism Yes
Review by Single anonymous peer review
Peer reviewer comments 2
Editor who approved publication: Professor Ning Quan
Hao Wang, Xin Yin, Tianyi Fang, Shenghan Lou, Bangling Han, Jialiang Gao, Yufei Wang, Daoxu Zhang, Xibo Wang, Zhanfei Lu, Junpeng Wu, Jiaqi Zhang, Yimin Wang, Yao Zhang, Yingwei Xue
Department of Gastroenterological Surgery, Harbin Medical University Cancer Hospital, Harbin, 150081, People’s Republic of China
Correspondence: Yingwei Xue, Department of Gastroenterological Surgery, Harbin Medical University Cancer Hospital, Harbin, 150081, People’s Republic of China, Email [email protected]
Background: Aging has a negative impact on the immune function of patients. The purpose of this study was to construct an age-related specific immune index according to the immune aging phenomenon of gastric cancer (GC) and explore its prognostic value.
Methods: This study retrospectively analyzed patients who underwent radical GC surgery in the Department of Gastrointestinal Surgery, Affiliated Cancer Hospital of Harbin Medical University, from August 2014 to December 2016 and divided them into a training cohort and a validation cohort. A new immune score, the GC-specific immune index (GSII), was developed as a series of lymphocyte subsets associated with the prognosis of patients with GC. Then, the receiver operating characteristic (ROC) curve was used to compare the prediction performance. The Kaplan‒Meier method and Log rank test were used to analyze the overall survival of patients. Cox hazard regression models were used to identify independent risk factors associated with prognosis. Finally, a nomogram model was constructed by combining the GSII and clinicopathological characteristics, and the calibration chart, consistency index, and decision curve were used to test the performance of the model.
Results: Aging did not significantly affect CD8 cell counts but decreased CD4 and CD19 cell counts. Based on the Cox analysis, the GSII of patients ≤ 60 years old was 0.079×lg CD4+0.348×lg CD19, and the GSII of patients > 60 years old was 0.058×lg CD4. A decreased GSII was indicative of a poor prognosis and was an independent risk factor associated with patient outcomes. The nomogram constructed based on the GSII and clinicopathological features accurately predicted patient prognosis. Furthermore, the GSII was well validated in the validation cohort.
Conclusion: The GSII constructed for the special immune aging phenomenon of GC can accurately predict patient prognosis.
Keywords: gastric cancer, lymphocyte subsets, age, prognosis
Introduction
According to the incomplete statistics of JAMA in 2017, gastric cancer (GC) was the sixth most common malignant tumor in the world.1 Meanwhile, with the global background of the aging population,2 the incidence of GC also shows an increasing trend with age. Therefore, the elderly have become a high-risk group for GC, accounting for approximately 68% of GC cases.3 Although GC is less invasive in the elderly than in younger patients, some studies have shown that the prognosis in elderly GC patients is worse than that in young GC patients.4,5 This may be related to poor nutrition status, a high incidence of postoperative complications and worse tolerance of adjuvant therapy in elderly GC patients.4–8 More importantly, immune function declines with age, which impacts the effectiveness of chemotherapy, immunotherapy and other treatments.9–13 Therefore, it is necessary to further explore age-related immune changes and the impact of such changes on prognosis and treatment.
Immunotherapy has achieved good clinical development, and immune cells in the tumor microenvironment provide potential targets for immunotherapy.14 Furthermore, peripheral blood immunity provides comprehensive immune information for tumor immunity. Tumor cells entering the peripheral blood can trigger different degrees of immune response, and some inflammatory indices calculated by peripheral immune cells, such as the neutrophil-to-lymphocyte ratio (NLR) and platelet-to-lymphocyte ratio (PLR), can accurately predict prognosis and guide individualized treatment.15 Among them, lymphocytes with different functional subtypes play an important role in antitumor immunity; CD4+ T cells, CD8+ T cells, and CD19+ B cells kill cells through the Fas pathway and secrete cytokines such as IL-21 to regulate immune function.16–18 However, immune function is organ-specific and is influenced by aging and epigenetic factors,19,20 where aging affects the function of lymphocyte subsets in various ways, resulting in immune impairment, such as atrophy of the thymus and decreased memory T-cell function.20 Huang et al constructed a CRC-specific inflammatory index (CSII) based on the specificity of immune status in patients with colorectal cancer, which can accurately predict the long-term survival of patients, and its predictive performance is superior to traditional inflammatory indices such as the Systemic Inflammation Index (SII).21 However, age-related immune scores for GC surgery are incomplete.22 Consequently, we constructed and validated a new GC-specific immune index (GSII) based on the specificity of the immune status of patients of different ages.
This study retrospectively analyzed patients who underwent radical surgery for GC in the Department of Gastrointestinal Surgery, Affiliated Cancer Hospital of Harbin Medical University, from August 2014 to December 2016. Differences in peripheral lymphocyte subsets were analyzed according to age. GSII was further constructed according to the immune status of GC patients of different ages, and combined with clinicopathological features, a nomogram was constructed.
Materials and Methods
Patients
This study retrospectively included patients who underwent radical surgery for GC in the Department of Gastrointestinal Surgery, Affiliated Cancer Hospital of Harbin Medical University, from August 2014 to December 2015 as a training cohort and patients who underwent radical surgery for GC in the same department from January 2016 to December 2016 as a validation cohort. The diagnosis of GC was based on tissue samples obtained by preoperative gastroscopy, which was further confirmed by a professional pathologist after surgery. Patients underwent routine preoperative examinations, such as abdominal CT, chest CT, double supraclavicular lymph node ultrasound, electrocardiogram, gastroscopy, hematology and tumor markers.
The inclusion criteria were as follows:1 preoperative chemotherapy;2 preoperative radiotherapy;3 autoimmune disease;4 hematological malignancies; and5 serious infection.
The clinicopathological data of the patients are stored in the GC Information Management System v1.2 of the Affiliated Cancer Hospital of Harbin Medical University (copyright number 2013SR087424, http://www.sgihmu.com). The data collected included sex, age, tumor diameter, tumor location, pTNM stage, vein invasion, nerve invasion and postoperative chemotherapy. The above contents were in line with the eighth edition of AJCC regulations.23 The surgical methods and postoperative chemotherapy standards were carried out in accordance with the Japanese GC Treatment Guidelines (Fifth Edition).24 Oxaliplatin + capecitabine (XELOX) or oxaliplatin + S-1 (SOX) are the main treatment options for patients with pathological stages II to III GC. To ensure the accuracy of this study, we included only patients who received complete chemotherapy at our institution, for a total of 373 patients. The remaining patients were not included in the postoperative chemotherapy patient group because these patients did not complete all postoperative chemotherapy regimens in our institution, and most of the patients returned to local hospitals for treatment after surgery and did not have complete chemotherapy records.
Hematology Sample
The hematological samples of each patient included in this study were collected one week before surgery in the morning in the fasting state. A 2 mL blood sample was collected from the cubital vein and sent for testing. Flow cytometry was used to monitor CD4+ and CD8+ T lymphocyte counts and CD19+ B lymphocyte counts.
Statistical Analysis
Overall survival (OS) was defined as the period from the date of surgery to the date of death by any cause, expressed as the mean ± standard deviation and 5-year survival rate. To construct the GC-specific immune index (GSII), a Cox hazard regression model was used to select the immune index significantly associated with OS. The training cohort was used to construct the GSII based on beta coefficients from the multivariate Cox analysis. The receiver operating characteristic (ROC) curve was used to calculate and compare the prognostic accuracy of different immune markers and calculate the area under the curve (AUC). The optimal cutoff value was calculated using the Youden index, and the calculation formula was sensitivity-(1-specificity), where the maximum value was the optimal cutoff value. A GSII below the cutoff value was classified as GSII-Low, and a GSII above the cutoff value was classified as GSII-High. T-ROC was performed using the R package “timeROC”. The chi-square test was used to analyze the relationship between the GSII and patient characteristics. The Kaplan‒Meier method and Log rank test were used to analyze overall survival. Relationship curves and scatter plots were drawn by GraphPad Prism 8. Cox proportional hazards regression models were used to calculate hazard ratios (HRs) and 95% confidence intervals (CIs) and identify independent risk factors associated with patient prognosis. A nomogram was constructed by the “SvyNom” and “rms” packages using R software. Calibration plots were used to show the relationship between predicted probabilities and actual outcomes using Hosmer’s goodness-of-fit test. The consistency index was used to measure the accuracy of the nomogram and was bootstrapped to correct for optimism bias. Decision curves were used to validate the predictive performance of the nomogram. All analyses were performed using SPSS for Windows version 25.0 and R software version 4.1.2, and P<0.05 was considered statistically significant.
Results
Patient Characteristics
A total of 617 patients were included in the training cohort (Table 1). According to age, 350 (56.7%) and 267 (43.3%) cases were ≤60 and >60 years, respectively. For patients ≤60, according to the pTNM stage, 149 (42.6%), 96 (27.4%) and 105 (30.0%) cases were stage I, II, and III, respectively. For patients >60, according to the pTNM stage, 81 (30.3%), 100 (37.5%) and 86 (32.2%) cases were stage I, II, and III, respectively.
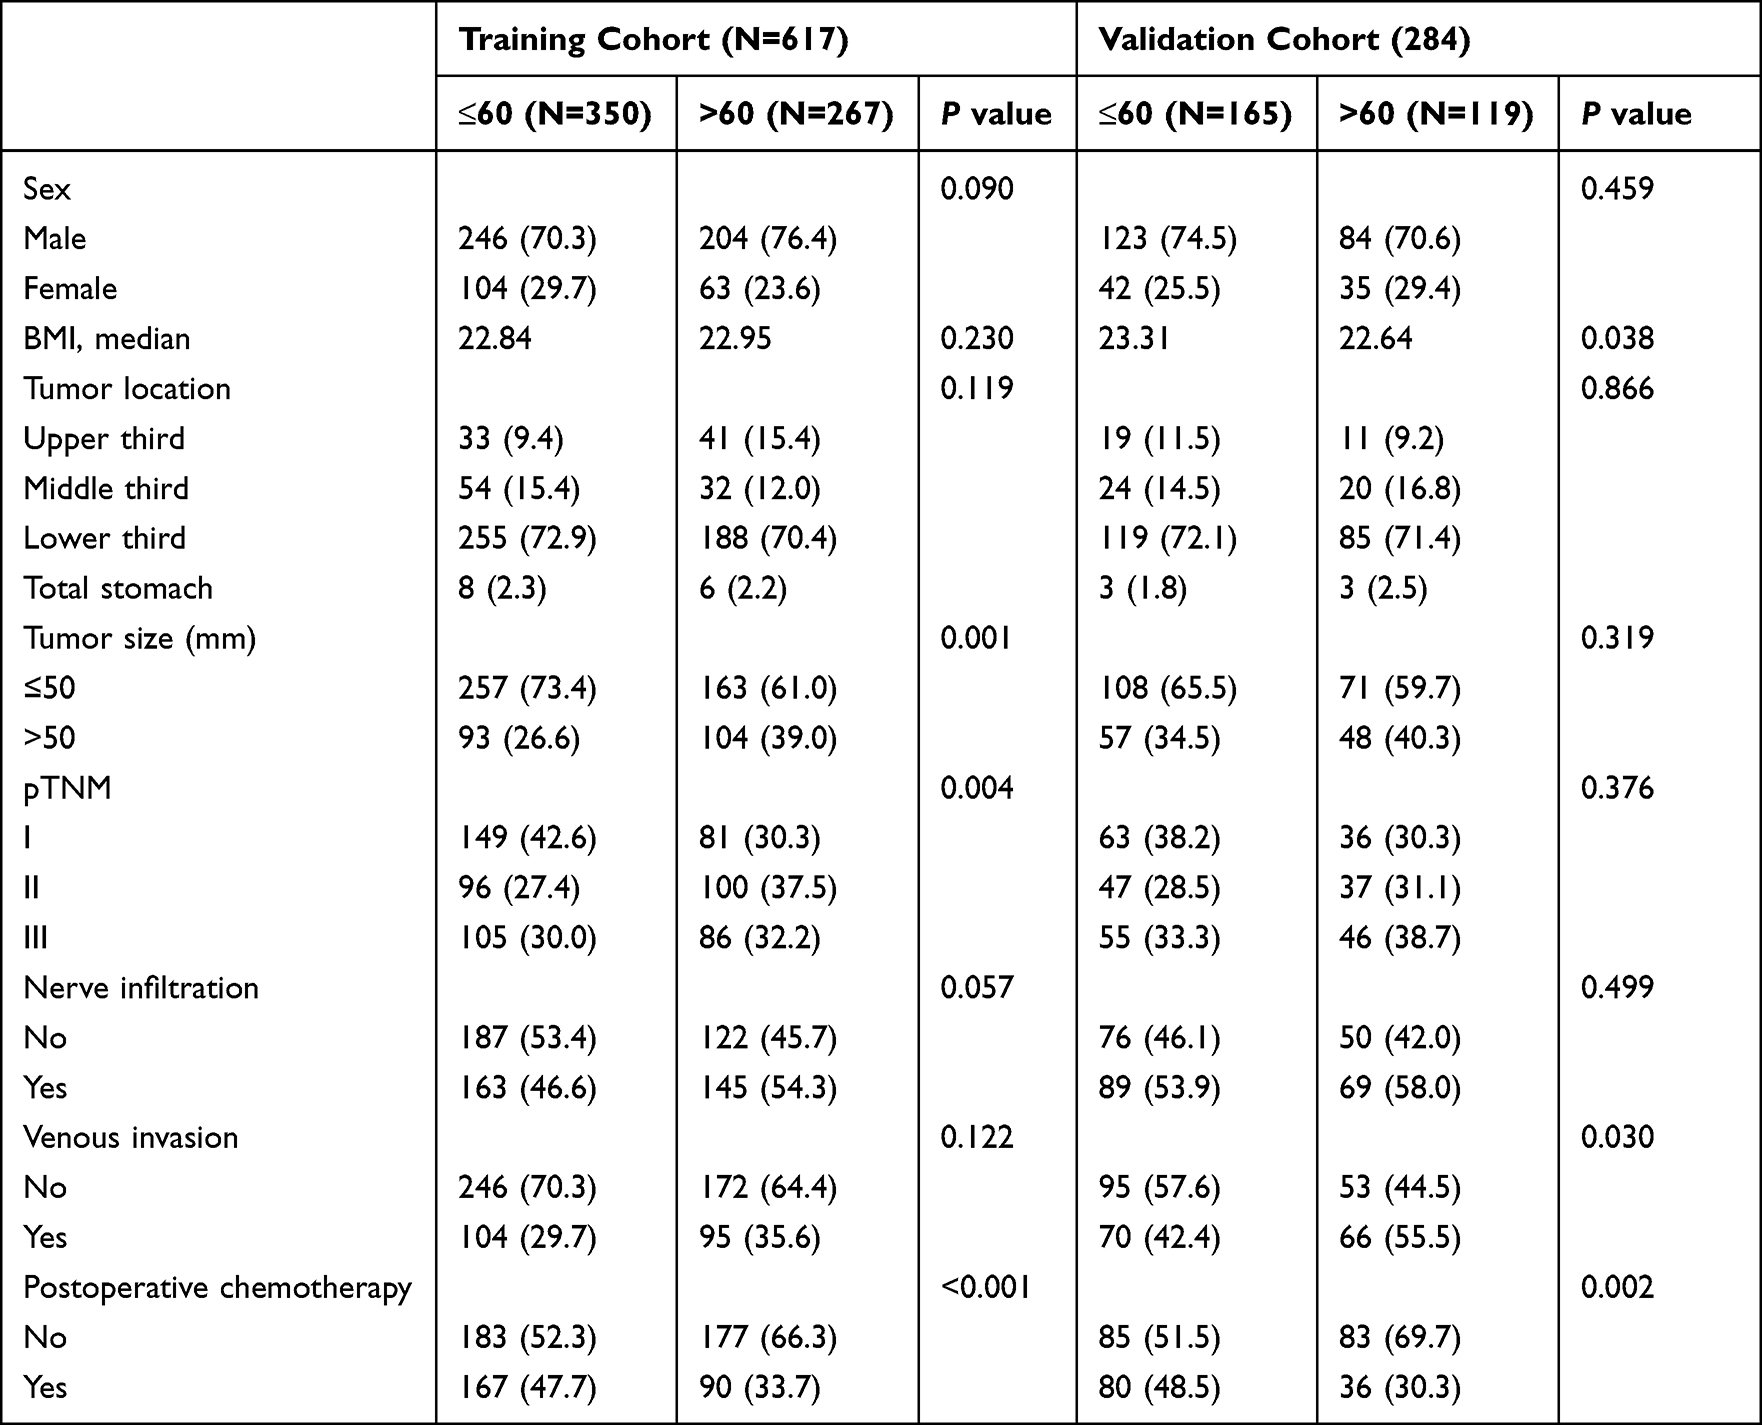 |
Table 1 Basic Characteristics of Patients |
A total of 284 patients were included in the validation cohort (Table 1). According to age, 165 (58.1%) and 119 (41.9%) cases were ≤60 and >60 years, respectively. For patients ≤60, according to the pTNM stage, 63 (38.2%), 47 (28.5%) and 55 (33.3%) cases were stage I, II, and III, respectively. For patients >60, 36 (30.3%), 37 (31.1%) and 46 (38.7%) cases were stage I, II, and III, respectively.
The Effect of Age on Patient Survival
For the training cohort, patients ≤60 had better survival than those >60 (5-year OS rate: 78.5% vs 67.8%, OS: 52.61±0.86 vs 49.50±1.07, P=0.004). For the validation cohort, patients ≤60 had better survival than those >60 (5-year OS rate: 71.0% vs 53.0%, OS: 51.20±1.26 vs 46.27±1.72, P=0.007) (Supplement Figure 1A and B).
The Effect of Age on the Counts of Peripheral Lymphocyte Subsets
In the training cohort, for patients ≤60, CD4, CD8, and CD19 lymphocyte counts were positively correlated with BMI, and CD8 and CD19 lymphocyte counts were negatively correlated with tumor size (Figure 1A–F). For patients >60, CD4 and CD19 lymphocyte counts were positively correlated with BMI, and CD4 lymphocyte counts were negatively correlated with tumor size (Figure 1G–L).
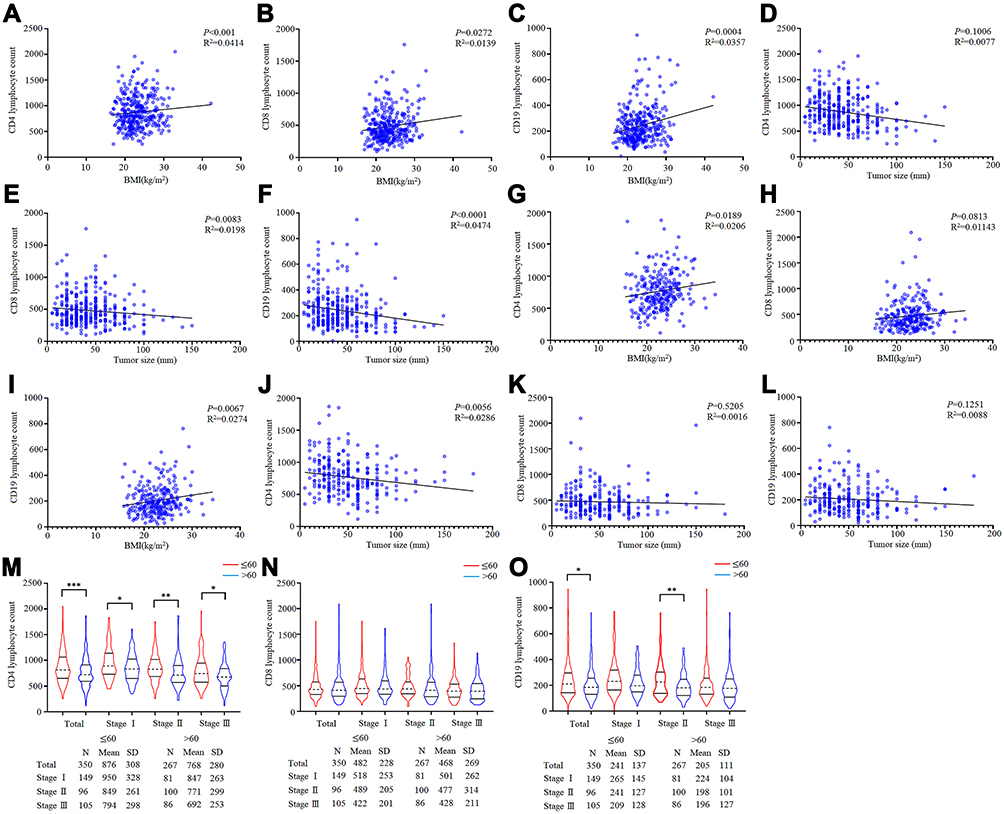 |
Figure 1 The effect of age on lymphocyte subsets. (A–C) The connection between CD4, CD8, CD19 lymphocyte counts, and BMI based on patients with ≤60. (D-F) The connection between CD4, CD8, CD19 lymphocyte counts, and tumor size based on patients with ≤60. (G–I) The connection between CD4, CD8, CD19 lymphocyte counts, and BMI based on patients with >60. (J–L) The connection between CD4, CD8, CD19 lymphocyte counts, and tumor size based on patients with >60. (M–O) The difference in CD4, CD8 and CD19 lymphocyte counts between ≤60 and >60 based on pTNM stage. |
Regarding the analysis of differences in lymphocyte subset counts according to age, the CD4 lymphocyte counts of patients >60 were significantly lower than those of patients ≤60 in each pTNM stage (P<0.05). The CD8 lymphocyte counts were not significantly different between patients ≤60 and >60. The CD19 lymphocyte counts of patients >60 were significantly lower than those of patients ≤60 overall, but this difference was concentrated in stage II (P<0.05) (Figure 1M–O). Obviously, aging has negative effects on immunity.
Construction of a Gastric Cancer-Specific Immune Index Based on Age
After finding that age can affect a patient’s immune status, in the validation cohort, we selected lymphocyte subsets significantly associated with OS through the Cox risk regression models to construct the GSII (Supplement Table 1). lg CD4 and lg CD19 lymphocyte counts were independent risk factors associated with prognosis in patients ≤60, and the lg CD4 lymphocyte count was an independent risk factor associated with prognosis in patients >60. Therefore, based on the β coefficient, the GSII for ≤60 patients was calculated as 0.079×lg CD4+0.348×lg CD19. The GSII for >60 patients was calculated as 0.058×lg CD4. The ROC curve showed a cutoff value of 9.73 for the GSII for patients ≤60 and of 8.15 for patients >60. The highest AUCs for the GSII were 0.672 (95% CI: 0.602–0.742) and 0.664 (95% CI: 0.595–0.732) (Figure 2A and B). The T-ROC curves showed that the highest AUCs for the GSII in patients ≤60 and >60 were 1-year: 0.656, 0.644 and 3-year: 0.653, 0.616 during the entire observation period (Supplement Figure 2A and B).
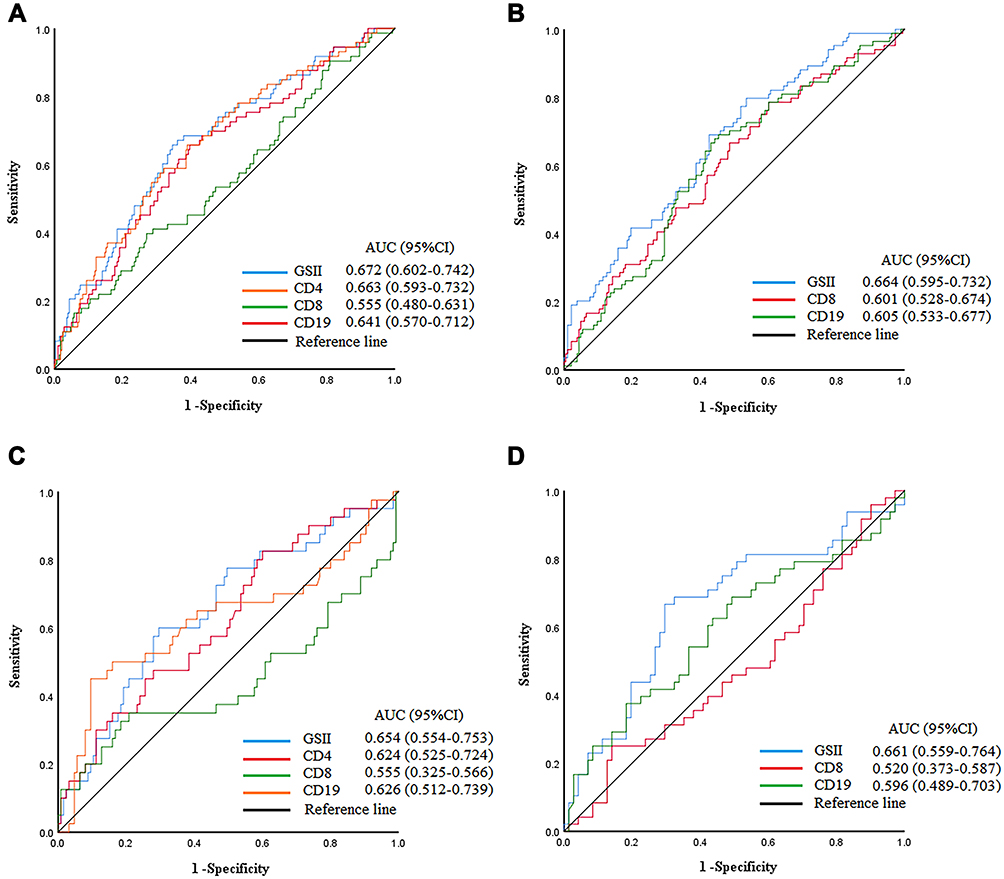 |
Figure 2 ROC curve of GSII, CD4, CD8, CD19 lymphocyte count among total patients. (A and B) ≤60 and >60 in training cohort. (C and D) ≤60 and >60 in validation cohort. |
To validate the applicability of the GSII, it was validated in the validation cohort. The ROC curve showed that the highest AUCs for the GSII in patients ≤60 and >60 were 0.673 (95% CI: 0.578–0.768) and 0.688 (95% CI: 0.588–0.788), respectively (Figure 2C and D).
Furthermore, the chi-square analysis showed that for patients ≤60, the GSII was significantly associated with BMI, tumor location, tumor size, pTNM stage, and nerve infiltration (P=0.020, P<0.001, P<0.001, P<0.001, and P=0.025, respectively). For patients >60, the GSII was significantly associated with tumor size, pTNM stage, and nerve infiltration (P<0.001, P=0.002, and P=0.025, respectively) (Table 2).
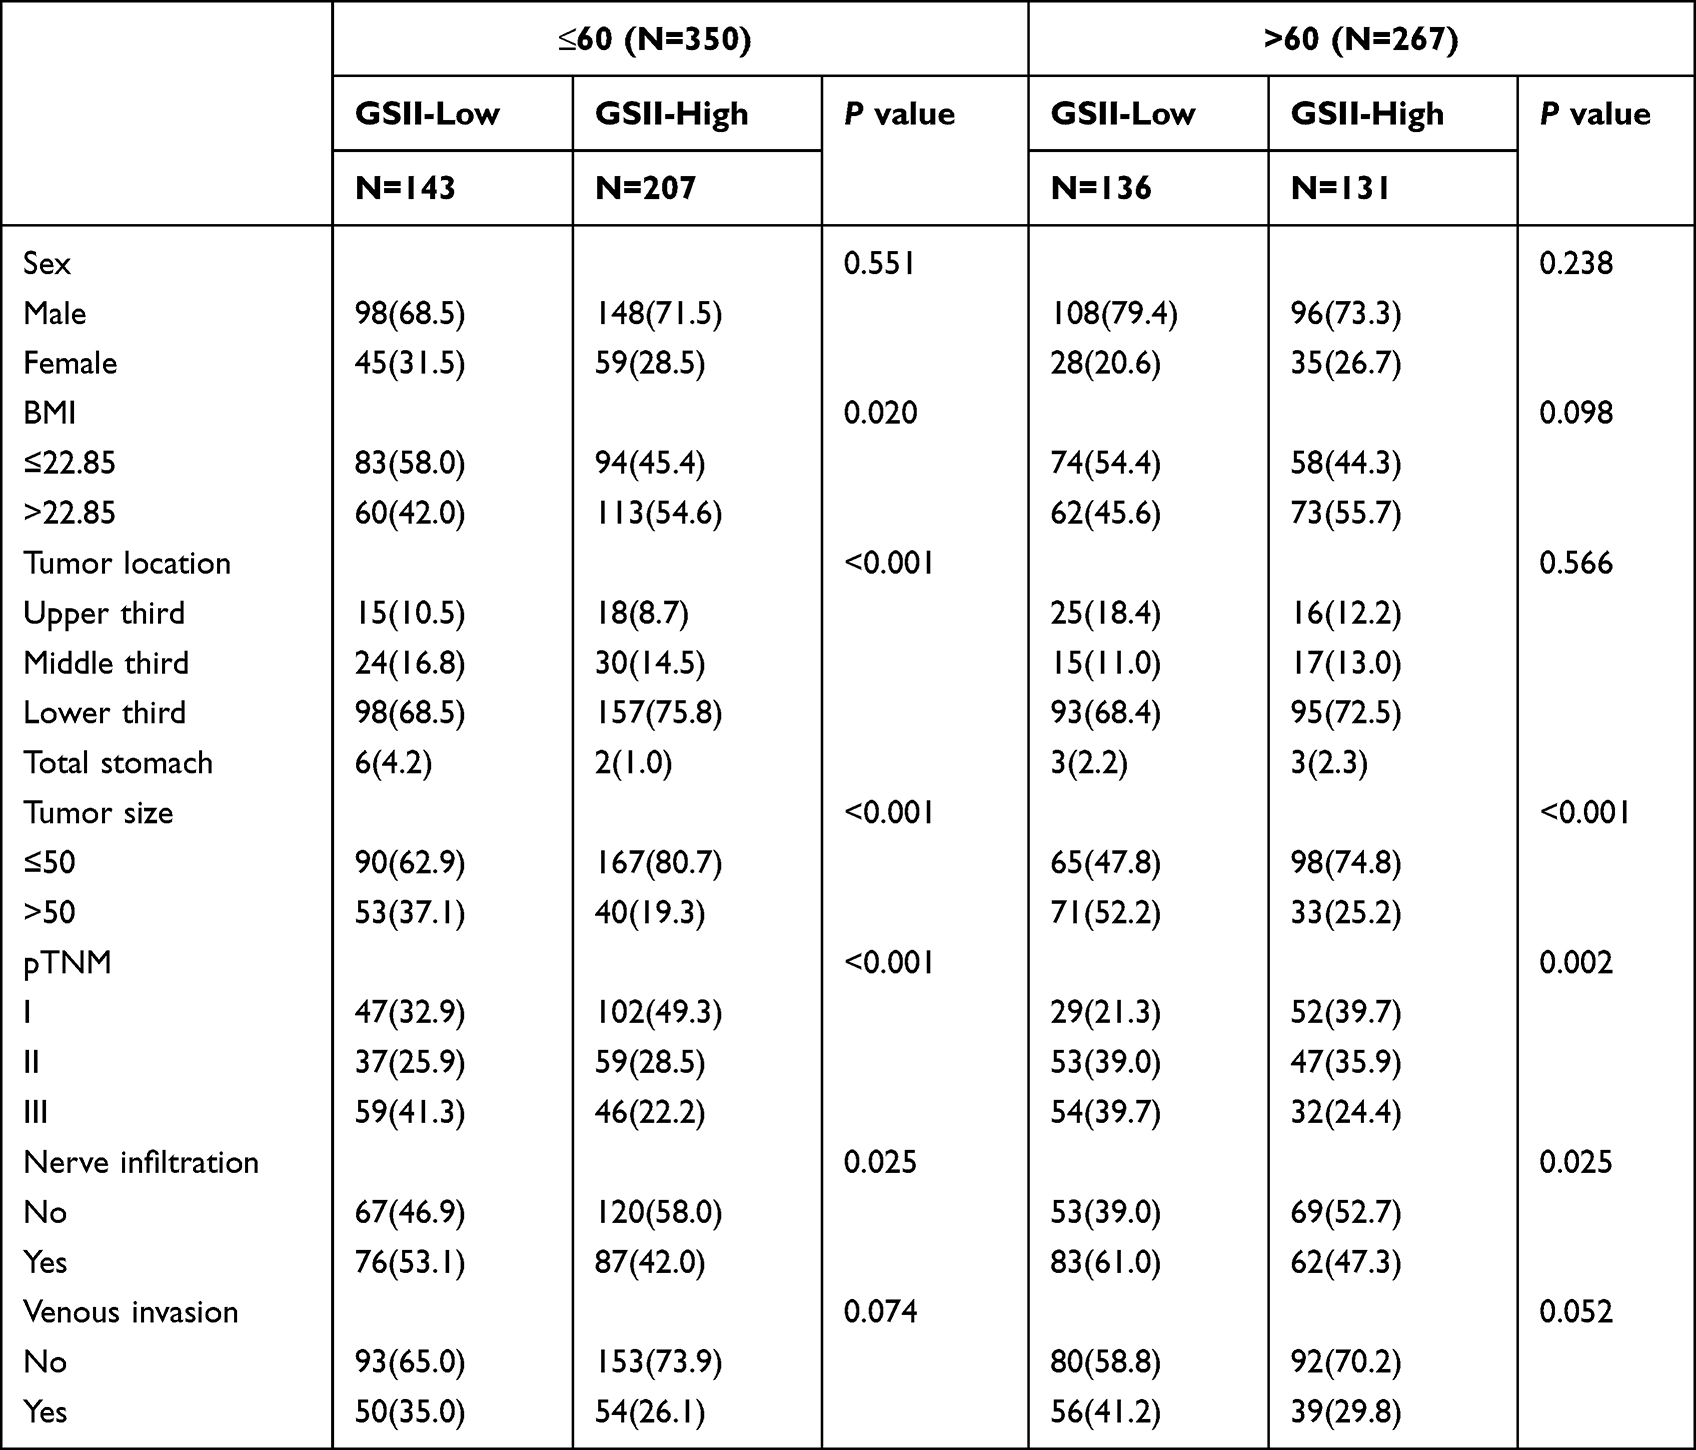 |
Table 2 Chi-Square Analysis of GSII and Patient Characteristics |
Effect of the Gastric Cancer-Specific Immune Index on Patient Survival
In the training cohort, for patients ≤60, GSII-Low had a worse prognosis than GSII-High in overall patients (5-year OS rate: 66.4% vs 86.8%, OS: 47.80±1.60 vs 55.91±0.87, P<0.001) (Figure 3A). According to the pTNM stage, GSII-Low had a worse prognosis than GSII-High in stage II and stage III GC (5-year OS rate: 69.9% vs 86.8%, OS: 49.92±2.67 vs 57.63±1.10, P=0.020; 5-year OS rate: 40.3% vs 61.3%, OS: 37.43±2.89 vs 45.48±3.07, P=0.041). However, there was no significant difference in survival between GSII-Low and GSII-High in stage I GC (Figure 3B–D). For patients >60, GSII-Low had a worse prognosis than GSII-High overall (5-year OS rate: 56.7% vs 79.4%, OS: 45.51±1.66 vs 53.65±1.25, P<0.001) (Figure 3E). According to the pTNM stage, GSII-Low had a worse prognosis than GSII-High in stage I GC (5-year OS rate: 75.7% vs 93.6%, OS: 54.20±2.21 vs 59.08±0.75, P=0.013). However, there was no significant difference in survival between GSII-Low and GSII-High in stage II or stage III GC (Figure 3F–H).
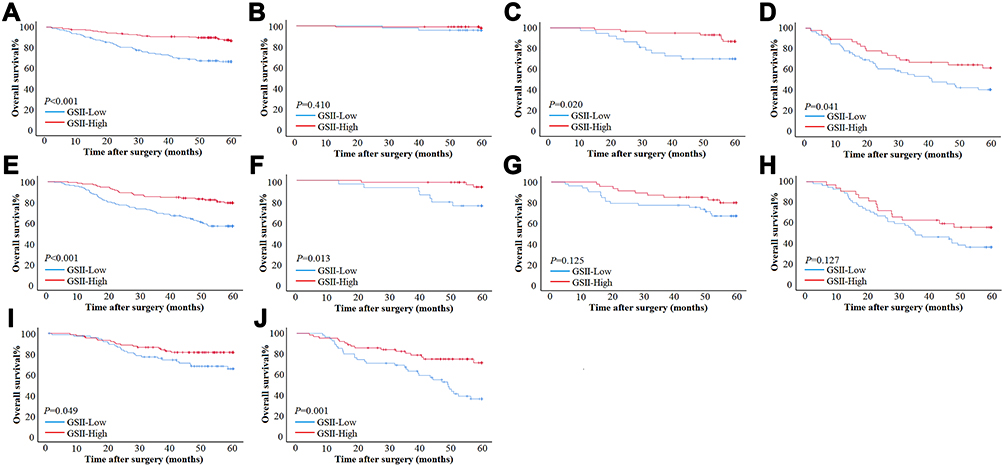 |
Figure 3 Survival curve subgroup analyses of patients. (A–D) Survival curves of patients with ≤60 based on GSII in total stage, stage I, stage II and stage III in training cohort. (E–H) Survival curves of patients with >60 based on GSII in total stage, stage I, stage II and stage III in validation cohort. (I and J) Survival curves of patients with ≤60 and >60 based on GSII in overall patients in validation cohort. |
In the validation cohort, for patients ≤60, GSII-Low had a worse prognosis than GSII-High overall (5-year OS rate: 58.9% vs 82.5%, OS: 48.47±1.97 vs 53.60±1.57, P=0.009). For patients >60, GSII-Low had a worse prognosis than GSII-High overall (5-year OS rate: 33.5% vs 71.4%, OS: 41.19±2.54 vs 50.56±2.20, P<0.001) (Figure 3I and J).
Gastric Cancer-Specific Immune Index and Postoperative Chemotherapy
For stage II and III patients receiving adjuvant chemotherapy after surgery, in the training cohort, for patients ≤60, patients with postoperative chemotherapy had better survival than patients without postoperative chemotherapy in GSII-Low (5-year OS rate: 58.9% vs 41.3%, OS: 46.64±2.47 vs 36.08±3.59, P=0.034); however, there was no significant difference in GSII-High (P=0.284) (Figure 4A and B). For patients >60, there was no significant difference in survival between postoperative chemotherapy and without postoperative chemotherapy in GSII-Low and GSII-High (P=0.857, P=0.944) (Figure 4C and D).
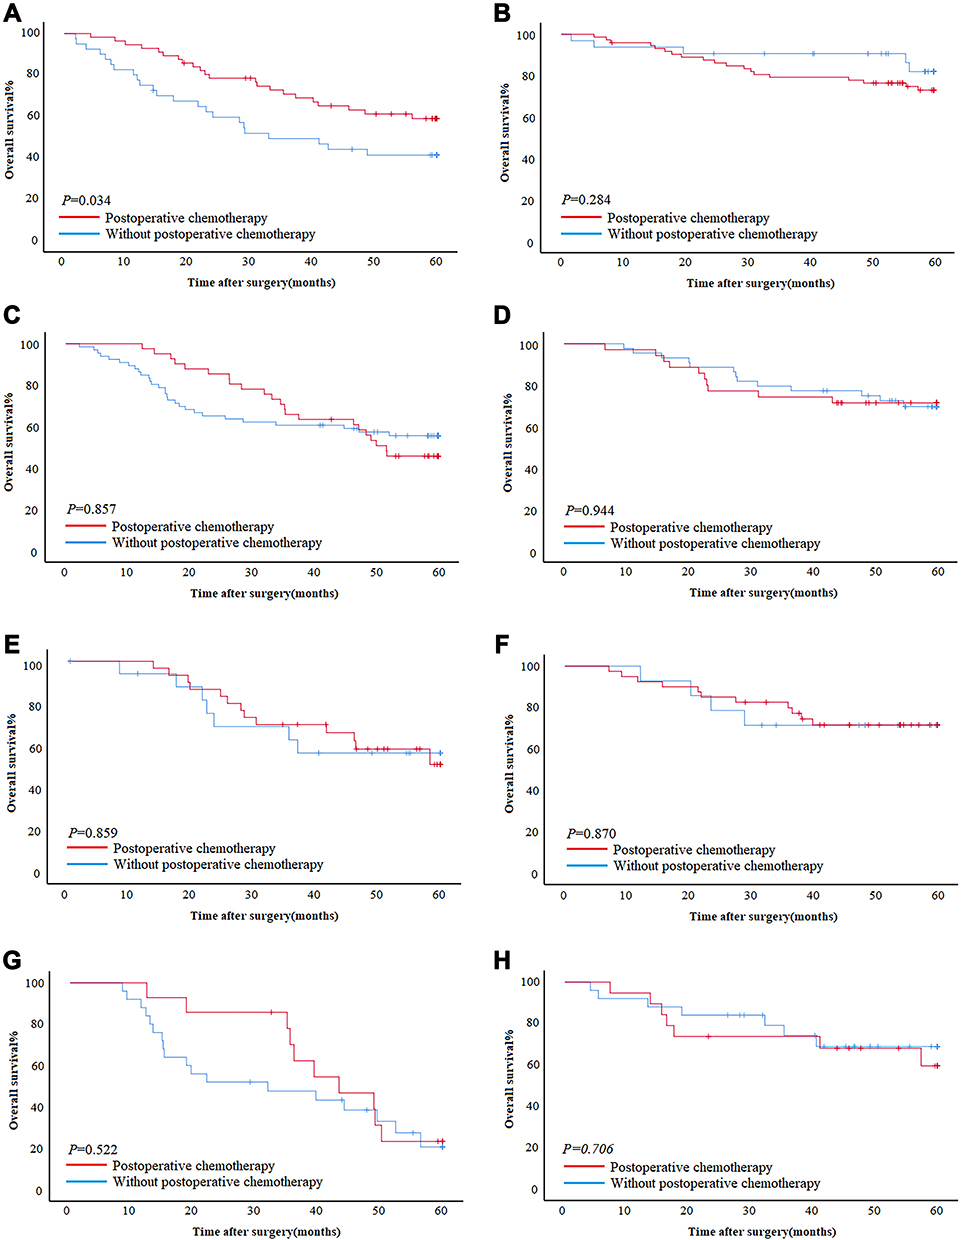 |
Figure 4 The impact of chemotherapy on prognosis in GSII-Low and GSII-High. (A and B) The effect of chemotherapy on patients who are less than 60 years old in GSII-Low and GSII-High in the training cohort. (C and D) The effect of chemotherapy on patients over 60 years old in GSII-Low and GSII-High in the training cohort. (E and F) The effect of chemotherapy on patients who are less than 60 years old in GSII-Low and GSII-High in the validation cohort. (G and H) The effect of chemotherapy on patients over 60 years old in GSII-Low and GSII-High in the validation cohort. (A, C, E and G) GSII-Low. (B, D, F, H) GSII-High. |
In the validation cohort, whether ≤60 or >60, there was no significant difference in survival between postoperative chemotherapy and without postoperative chemotherapy in GSII-Low and GSII-High (Figure 4E–H).
Univariate and Multivariate Analysis
In the training cohort, the univariate analysis showed that for patients ≤60, BMI, tumor location, tumor size, pTNM stage, nerve infiltration, venous invasion, and the GSII were statistically significant. For patients >60, sex, tumor location, tumor size, pTNM stage, nerve infiltration, venous invasion, and the GSII were statistically significant. The multivariate analysis showed that for patients ≤60, pTNM stage (P<0.001), nerve infiltration (P=0.019), and the GSII (P=0.004) were independent risk factors associated with patient prognosis (Table 3). For patients >60, sex (P=0.017), tumor size (P=0.008), pTNM stage (P=0.003), and the GSII (P=0.044) were independent risk factors associated with patient prognosis (Table 4).
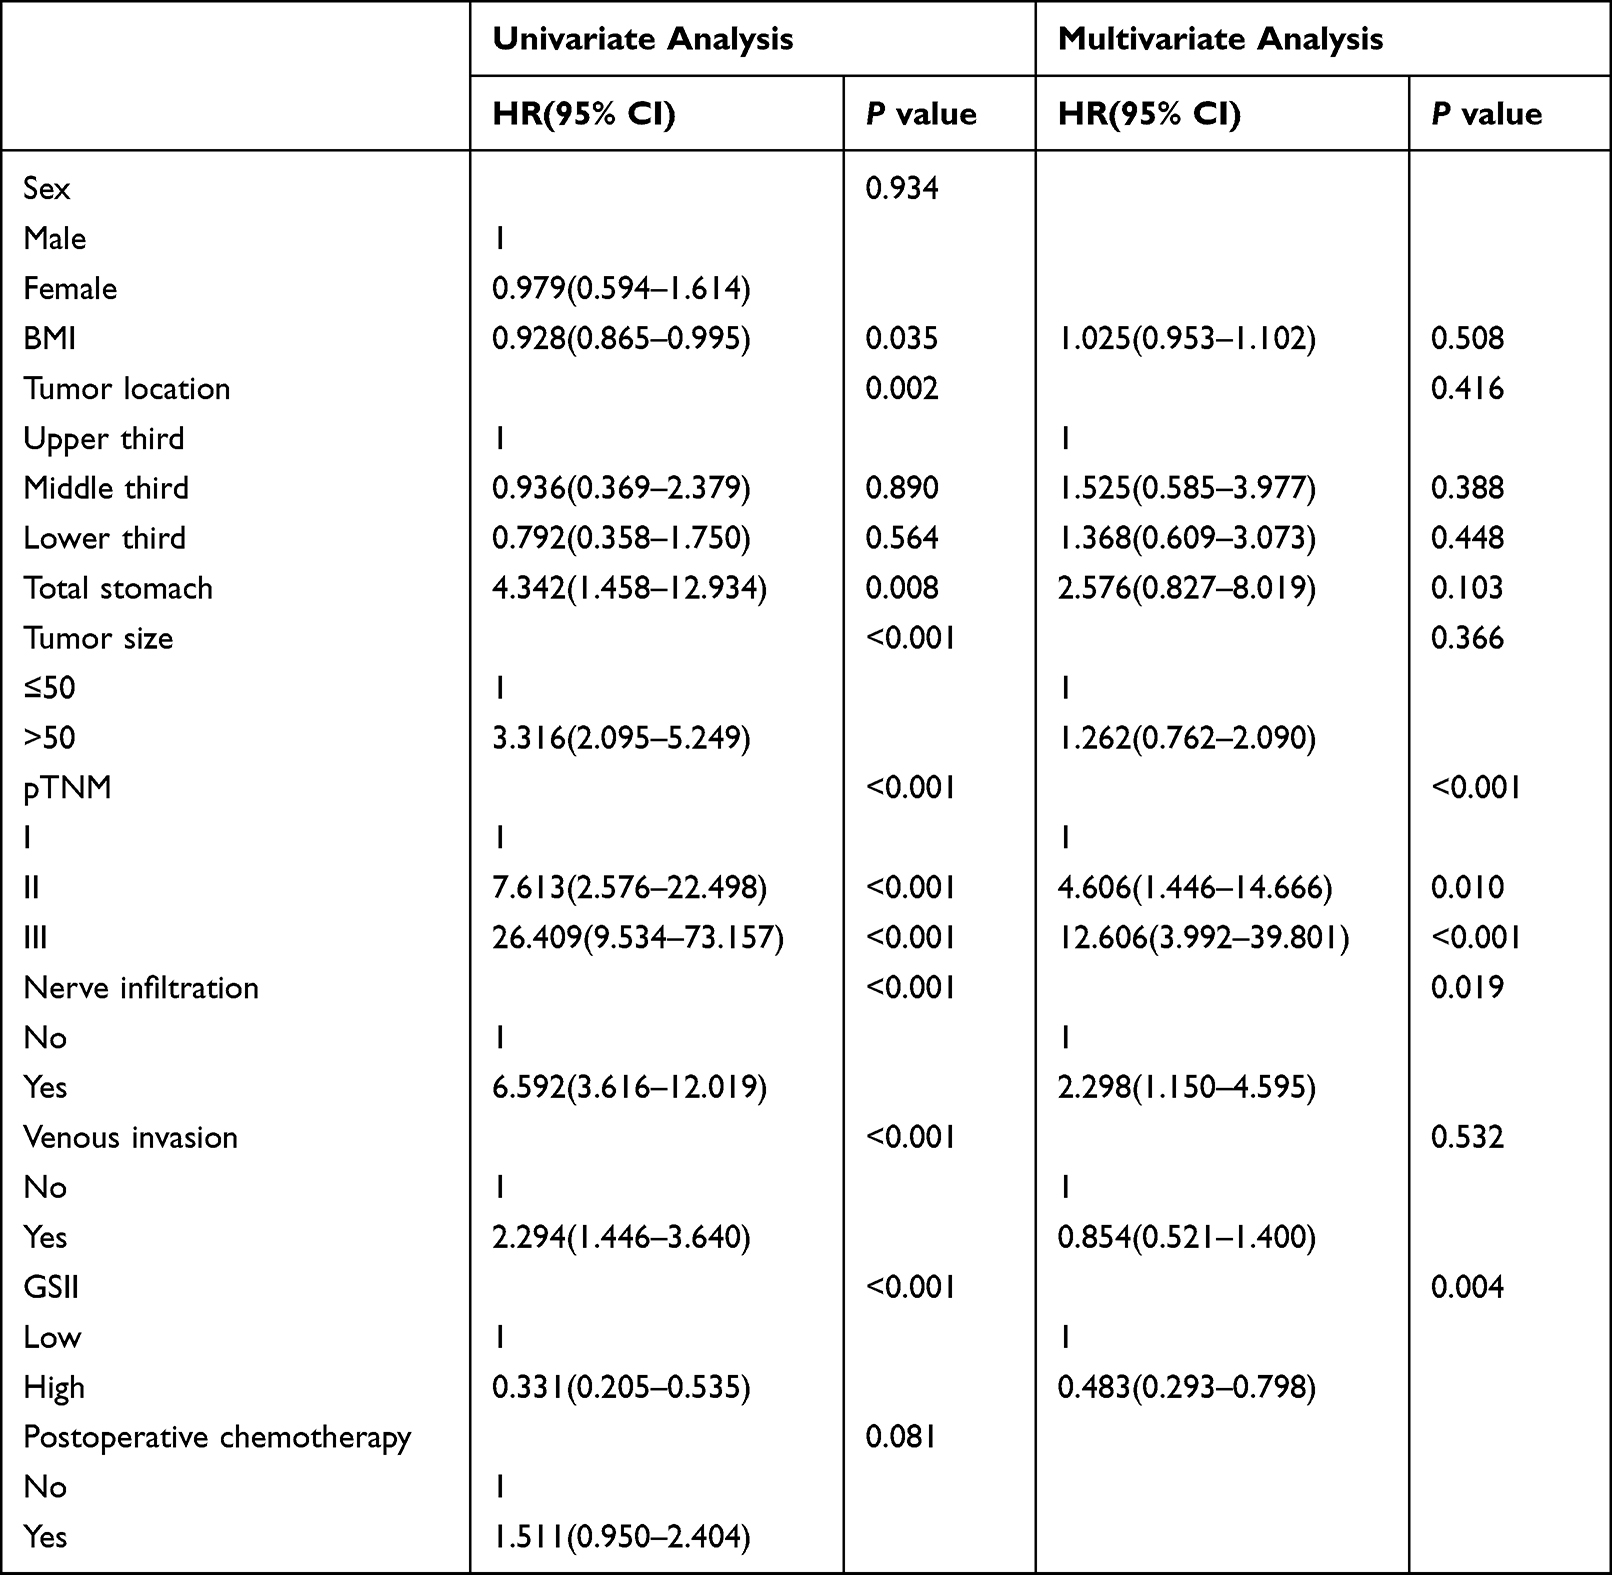 |
Table 3 Prognostic Factors of Patients with ≤60 by Univariate and Multivariate Analyses Based on Cox Regression Analysis |
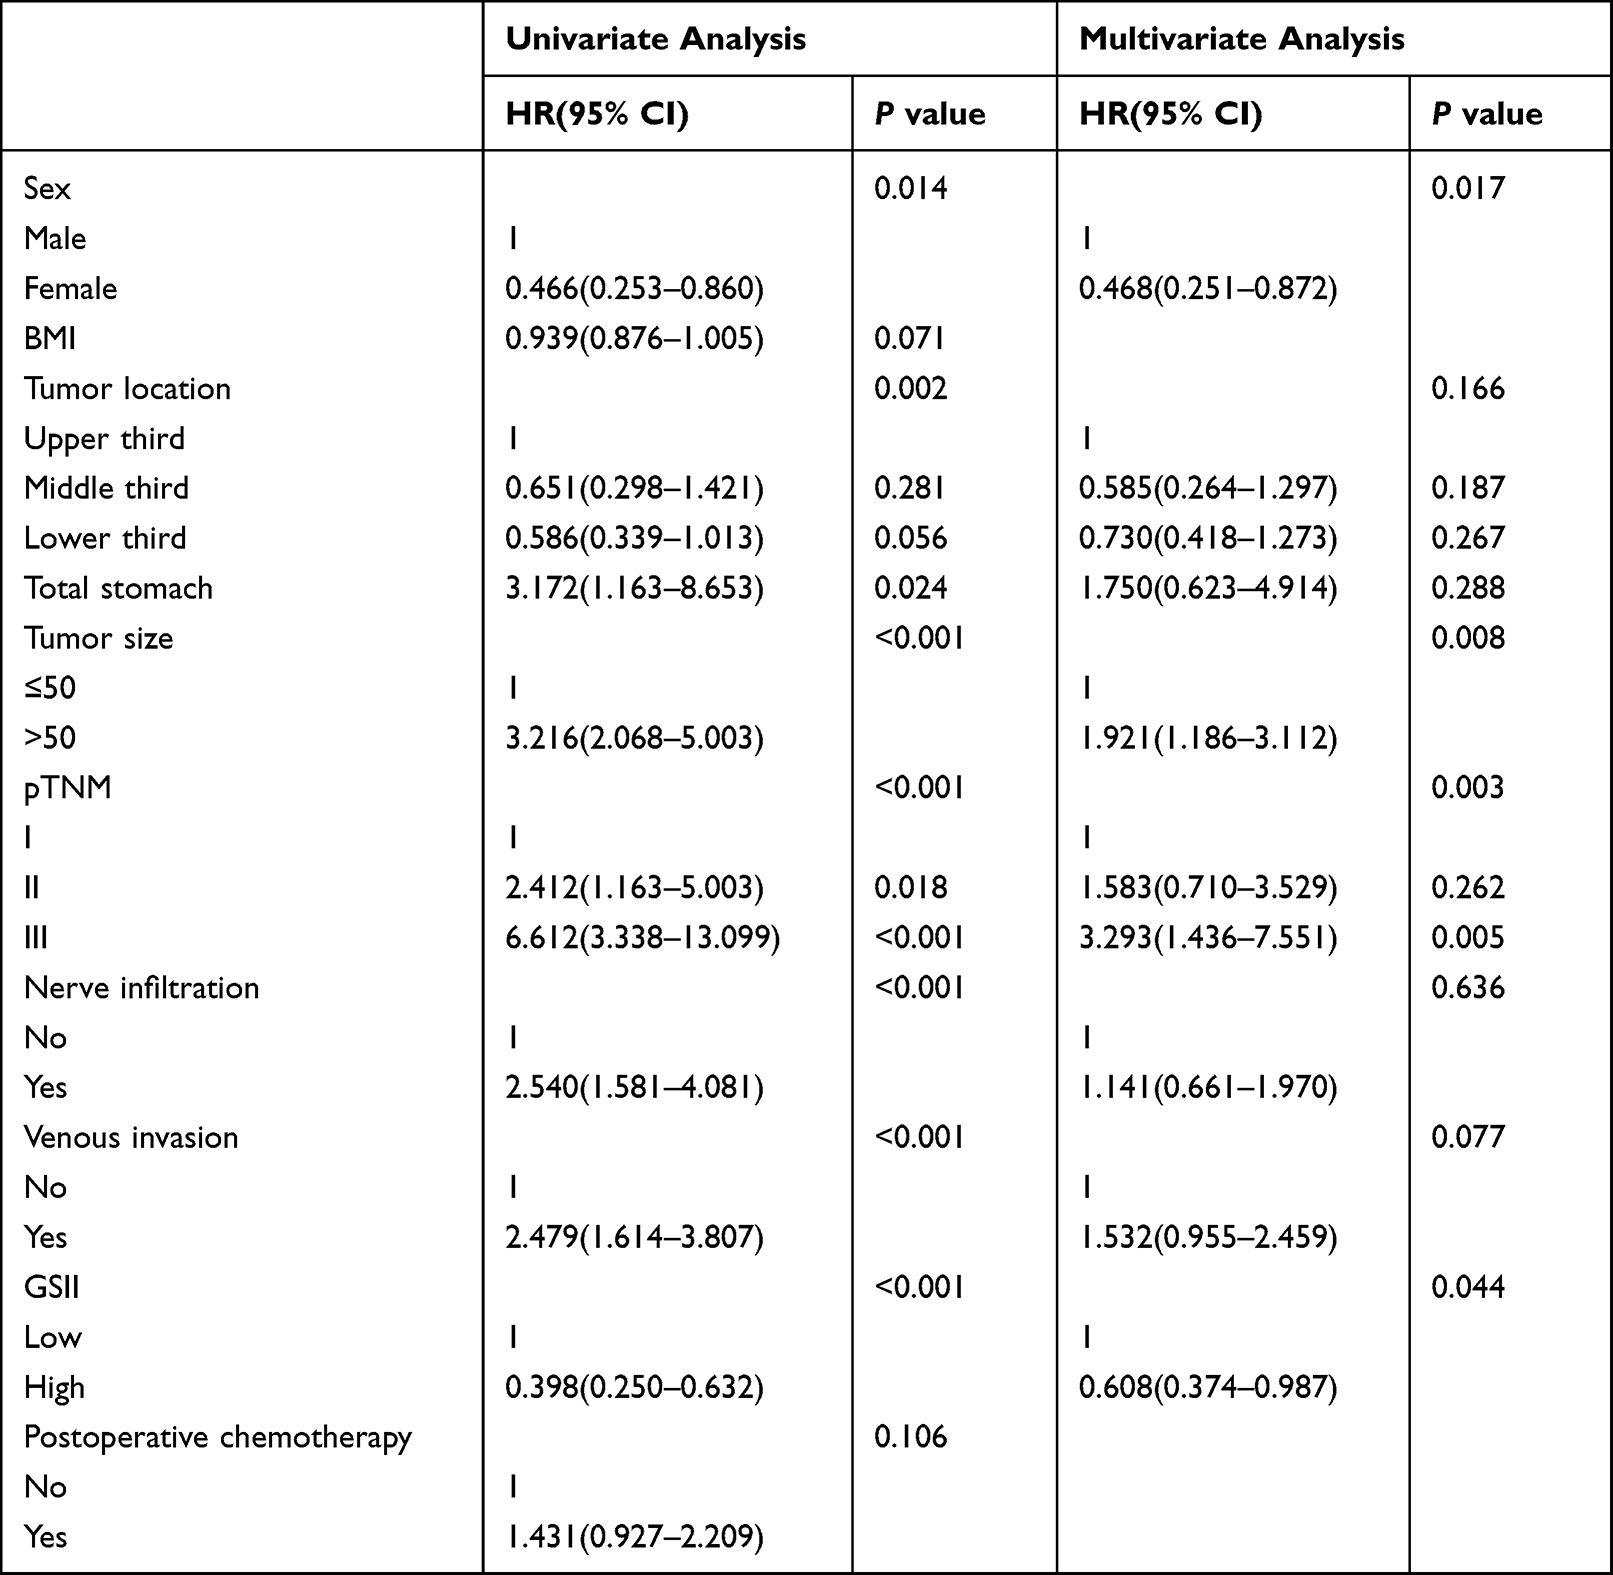 |
Table 4 Prognostic Factors of Patients with >60 by Univariate and Multivariate Analyses Based on Cox Regression Analysis |
Nomogram for Predicting Patient Prognosis
In the training cohort, based on the Cox multivariate analysis results for OS, the pTNM stage, nerve infiltration, and the GSII were used to construct a nomogram in patients ≤60. Sex, tumor size, pTNM stage, and the GSII were used to construct a nomogram in patients >60 (Figure 5A and D). For patients ≤60, the AUCs of the nomograms to predict 3- and 5-year OS were 0.850 (95% CI: 0.802–0.899) and 0.843 (95% CI: 0.797–0.889), the sensitivity was 85.7% and 79.5%, and the specificity was 74.8% and 76.9%, respectively (Figure 5B and C). For patients >60, the AUCs of the nomograms to predict 3- and 5-year OS were 0.812 (95% CI: 0.752–0.871) and 0.781 (95% CI: 0.723–0.839), the sensitivity was 77.0% and 67.9%, and the specificity was 76.7% and 79.2%, respectively (Figure 5E and F). Furthermore, the C-indices of the nomograms were 0.815 and 0.735 for ≤60 and >60, respectively (Supplement Figure 3A and B). Calibration plots showed that the nomograms performed well in predicting patient OS at 3 and 5 years (Supplement Figure 4A–D). Decision curves showed that the overall net benefit of the nomogram was higher than that of the pTNM stage within the threshold range (Supplement Figure 5A and B).
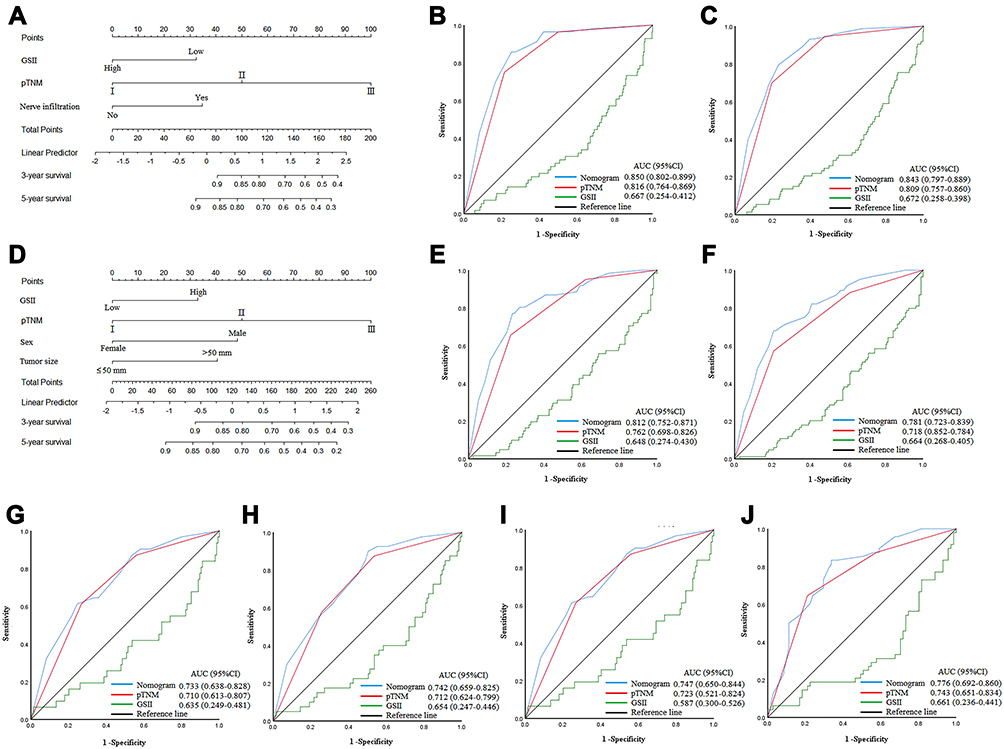 |
Figure 5 (A–C) Nomogram model predicting the 3- and 5-year survival of ≤60 in training cohort. (D–F) Nomogram model predicting the 3- and 5-year survival of >60 in training cohort. (G and H) Nomogram model predicting the 3- and 5-year survival of ≤60 in validation cohort. (I and J) Nomogram model predicting the 3- and 5-year survival of >60 in validation cohort. |
In the validation cohort, for patients ≤60, the AUCs of the nomograms to predict 3- and 5-year OS were 0.744 (95% CI: 0.649–0.839) and 0.752 (95% CI: 0.674–0.831), the sensitivity was 63.3% and 93.0%, and the specificity was 75.6% and 51.6%, respectively (Figure 5G and H). For patients >60, the AUCs of the nomograms to predict 3- and 5-year OS were 0.747 (95% CI: 0.650–0.844) and 0.780 (95% CI: 0.697–0.863), the sensitivity was 77.4% and 84.0%, and the specificity was 63.6% and 68.1%, respectively (Figure 5I and J). The C-indices of the nomograms were 0.725 and 0.726 (Supplement Figure 3C and D), respectively. In addition, the T-ROC curve showed a higher AUC for the nomogram than for pTNM staging throughout the observation period (Supplement Figure 3E and F). Calibration plots showed that nomograms performed well in predicting patient OS at 3 and 5 years (Supplement Figure 4E–H). Decision curves showed that the overall net benefit of the nomogram was higher than that of the pTNM stage within the threshold range (Supplement Figure 5C and D). These results showed that the nomogram constructed by the GSII and the clinicopathological characteristics of patients accurately predicted patient prognosis; the nomogram was verified and is worthy of clinical application.
Discussion
Aging has a negative impact on the immune system, which is characterized by damaging immune function and decreasing the production of immune cells, resulting in tumor progression.25–30 In this study, we found that aging has a unique impact on GC peripheral immunity. Immune aging results in a decrease in the number of peripheral CD4 and CD19 cells but may not significantly affect the number of peripheral CD8 cells. Hence, we constructed the GSII based on this phenomenon, which can not only comprehensively assess the immune status of patients of different ages but also accurately predict prognosis.
In a study of lymphocyte subsets, Kuss et al found that circulating lymphocyte counts decreased with age, whereas lymphocyte percentages were normal.31 Therefore, we used lymphocyte subset counts to better assess the peripheral immune status of GC patients. Although lymphocyte subset counts were associated with age, they were also associated with some clinicopathological features. Whether ≤60 or >60 years old, immunocompromised patients are associated with high tumor aggressiveness,32 and Lee et al found that the CD4/CD8 lymphocyte ratio decreased with increasing tumor diameter,32 which underscores the importance of tumor burden for immunosuppression. Furthermore, BMI can indirectly alter immune cell activity, and adipose tissue can act as a repository for specific memory T cells, facilitating rapid T-cell reactivation in response to exogenous stimuli, which may explain the better clinical outcomes of patients with higher BMI receiving anti-programmed cell death protein-1 (PD-1)/PD-L1 drugs.33 Therefore, it is necessary to consider the immune status of patients according to different clinicopathological characteristics, which can more accurately predict patient prognosis.
We found that aging resulted in a decrease in the peripheral CD4 and CD19 cell counts. T cells produced by the thymus are one of the important cell types for maintaining the proper functioning of the immune system, but after puberty, the thymus gradually shrinks with age, which leads to a decrease in the number of T cells released to the peripheral T-cell pool.34 Moreover, the original baseline length of telomeres, which determines the ability of cells to replicate, affects the ability of T and B lymphocytes to replicate and proliferate. It has been reported that the length of telomeres decreases with age in T and B lymphocytes,29,30 and the loss of telomeres may lead to a defective immune response in elderly individuals, which may explain the decline in the number of CD4 and CD19 cells in elderly patients. The decrease in the number of immune cells also leads to the inability of the body to effectively exert cellular immunity and humoral immunity,35 which in turn cannot effectively inhibit the occurrence and progression of tumors. This also explains why a decrease in the GSII suggests a poor prognosis in patients.
CD8+ molecules are mainly expressed on the outer membrane of T cells with cytotoxicity and are characterized by the direct killing of tumor cells.36 In GC, CD8+ cells not only predict prognosis but also serve as a selective target for immunotherapy.37 We found that aging did not significantly affect CD8 cell counts, which is consistent with a report by Han et al, who found that peripheral CD8 cells could reflect immune infiltration in tumor tissue.37 This suggests that under the influence of aging, the number of some immune cells may not be affected by age to exert antitumor immune function. The reason is that there is a complex interaction between the anti-immune functions of different subtypes of immune cells, such as CD4 cells regulating CD8 cell function by secreting IL-21.16 In addition, lymphocyte numbers are not regulated by stem cell production but by the survival and homeostasis of mature lymphocytes. If the number of lymphocytes is low, more cells are produced by proliferation. If the number of lymphocytes is high, the excess lymphocytes die.38,39 This suggests that the CD8 cell counts in the peripheral blood of GC patients may be rapidly maintained through homeostasis, and this homeostasis may not be affected by immune aging. Unfortunately, with the current clinical information, we may not be able to confirm the effect of immune aging on lymphocyte homeostasis and the function of CD8 cells and whether the functional deficit of CD8 is caused by the decrease in the number of immune cells with aging or whether functionally deficient CD4 cells cannot provide efficient homology help. This phenomenon also provides some theoretical basis for the benefits of immunotherapy in elderly individuals. Some studies found that the benefit of immune checkpoint blockade (ICB) is not diminished but is increased in older patients compared with younger patients.40 In a related study of immunotherapy, GC patients with high CD8 infiltration were more sensitive to anti-PD1/-PD-1 mAB treatment.41 This suggests that the benefit of ICB therapy in elderly patients appears to be influenced by CD8 cell homeostasis.
Huang et al constructed the CSII based on the immune status of CRC patients, which can comprehensively assess the immune status of CRC and accurately predict prognosis.21 We constructed the GSII according to the peripheral immune status of GC patients and found that the GSII was significantly associated with the clinicopathological characteristics of patients. When the tumor was more aggressive, the proportion in the GSII-Low group was significantly higher than that in the GSII-High group, which emphasized the importance of tumor burden for immunosuppression. In addition, the GSII can accurately predict the prognosis of GC patients because it is composed of peripheral immune cell counts, and a decrease in immune cell counts indicates that the immune system cannot effectively suppress tumor progression, which also explains why the GSII is an independent risk factor related to patient prognosis.
For adjuvant chemotherapy, we found that in younger patients, postoperative chemotherapy could benefit the GSII-Low group. The reason is that the sensitivity of tumors to chemotherapeutic drugs depends on the sensitivity of cancer cells to drugs, the functional status of patients’ organs, and the immune status of patients.42,43 First, cellular senescence increases chemoresistance, which makes elderly patients susceptible to chemoresistance. Second, compared with older patients, younger patients have fewer underlying organic diseases and are more likely to tolerate chemotherapy toxicity, which explains why chemotherapy is more likely to benefit younger patients.6,42,43 Finally, chemotherapy can enhance host antitumor immunity.44,45 Several studies have reported that chemotherapy-induced transient lymphopenia can activate homeostatic mechanisms and stimulate the production of more tumor-specific T lymphocytes, which are beneficial for maintaining immune cell homeostasis, increasing activity and improving immune function.46,47 This mechanism has also been well used in adoptive cell transfer (ACT) therapy.48,49 Therefore, the abovementioned mechanism may explain why chemotherapy can significantly benefit the GSII-Low group in younger patients. Furthermore, different treatment benefits can be shown in elderly patients by adjusting the chemotherapy regimen; for example, the dose-adjusted SOX regimen is safer and more feasible than the CS regimen.6 Hence, evaluating the sensitivity of different chemotherapy regimens in elderly patients using the GSII is the future direction of our research.
In clinical practice, the pTNM staging system can effectively predict the prognosis of GC patients. Since pTNM staging primarily represents the biological behavior of GC, it may not provide immunological information. Blood immunity supplements pTNM staging with more comprehensive prognostic information, which can accurately predict patient prognosis.50,51 We constructed nomograms based on the GSII and clinicopathological features of patients ≤60 and >60 years old, respectively, and found that the AUCs of the nomograms were higher than those of the pTNM stage. For patients ≤60 years old, the AUCs of the nomograms for predicting 3- and 5-year OS were 0.850 and 0.843, with sensitivities of 85.7% and 79.5% and specificities of 74.8% and 76.9%, respectively. For patients >60 years old, the AUCs of the nomograms to predict patient OS at 3 and 5 years were 0.812 and 0.781, with sensitivities of 77.0% and 67.9% and specificities of 76.7% and 79.2%, respectively. The C-indices of the nomograms for patients ≤60 and >60 years old were 0.815 and 0.735, respectively. Moreover, nomograms constructed from the GSII and clinicopathological features were well validated. Obviously, the nomogram constructed for the immune aging of GC patients can serve GC patients of different ages well and is worthy of clinical promotion and application.
As a retrospective study, there are some limitations. First, this study was a retrospective, single-center study, and although there was internal validation, further external validation is needed. Second, we collected peripheral immune information from patients before surgery, but the lymphocyte subset counts changed over time, and dynamic monitoring of these lymphocyte subsets may be more accurate. Finally, we did not assess the impact of genes of age-related pathways on immunity due to the lack of relevant medical records, which also requires multicenter, large-scale studies with more genetic signatures to validate our conclusions.
Conclusion
GC patients may have a specific immune aging phenomenon that is not specific to every subtype of immune cells. We developed a new immune score for patients of different ages in response to this phenomenon. The GSII can be used as an effective biomarker to predict GC patients undergoing radical surgery, and a decrease in the GSII suggests a poor prognosis. Furthermore, the nomogram constructed by combining the GSII with the clinicopathological features of the patients provided additional prognostic value for the survival outcomes of GC patients of different ages.
Data Sharing Statement
Patient data were saved in the Gastric Cancer Information Management System v1.2 of Harbin Medical University Cancer Hospital (Copyright No. 2013SR087424, http:www.sgihmu.com).
Ethical Approval
All programs followed were according to the ethical standards of the Human Subjects Responsibility Committee (institutions and countries), as well as the 1964 Helsinki Declaration and subsequent editions. This research was approved by the Ethics Committee of the Harbin Medical University Cancer Hospital.
Institutional Review Board Statement
The study was approved by the Ethics Committee of the Affiliated Tumor Hospital of Harbin Medical University.
Informed Consent Statement
All study participants or their legal guardians provided informed written consent for personal and medical data collection prior to study enrollment.
Author Contributions
Hao Wang and Xin Yin designed and conceived the project together, and participated in the collection and assembly of data, data analysis and interpretation, and manuscript writing. Shenghan Lou, Tianyi Fang, Bangling Han, and Jialiang Gao participated in acquisition, analysis and interpretation of data. Yufei Wang, Daoxu Zhang, Xibo Wang, Zhanfei Lu, Junpeng Wu, Jiaqi Zhang, Yimin Wang, and Yao Zhang participated in patient information collection. Yingwei Xue participated in the design and supervision of research, and substantially revised or critically reviewed the article. All authors made a significant contribution to the work reported, whether that is in the conception, study design, execution, acquisition of data, analysis and interpretation, or in all these areas; took part in drafting, revising or critically reviewing the article, given final approval of the version to be published; have agreed on the journal to which the article has been submitted; and agree to be accountable for all aspects of the work.
Funding
Supported by the Nn10 Program of Harbin Medical University Cancer Hospital, China, No. Nn10 PY 2017-03.
Disclosure
All the authors have no conflicts of interest related to the manuscript.
References
1. Fitzmaurice C, Abate D; Global Burden of Disease Cancer C. Global, regional, and national cancer incidence, mortality, years of life lost, years lived with disability, and disability-adjusted life-years for 29 cancer groups, 1990 to 2017: a systematic analysis for the global burden of disease study. JAMA Oncol. 2019;5(12):1749–1768. doi:10.1001/jamaoncol.2019.2996
2. Arias E, Xu J. United states life tables, 2018. Natl Vital Stat Rep. 2020;69(12):1–45.
3. Chen W, Zheng R, Baade PD, et al. Cancer statistics in China, 2015. CA Cancer J Clin. 2016;66(2):115–132. doi:10.3322/caac.21338
4. Takatsu Y, Hiki N, Nunobe S, et al. Clinicopathological features of gastric cancer in young patients. Gastric Cancer. 2016;19(2):472–478. doi:10.1007/s10120-015-0484-1
5. Nelen SD, Verhoeven RHA, Lemmens V, et al. Increasing survival gap between young and elderly gastric cancer patients. Gastric Cancer. 2017;20(6):919–928. doi:10.1007/s10120-017-0708-7
6. Bando H, Yamada Y, Tanabe S, et al. Efficacy and safety of S-1 and oxaliplatin combination therapy in elderly patients with advanced gastric cancer. Gastric Cancer. 2016;19(3):919–926. doi:10.1007/s10120-015-0549-1
7. Takahashi R, Nunobe S, Makuuchi R, et al. Survival outcomes of elderly patients with pathological stages II and III gastric cancer following curative gastrectomy. Ann Gastroenterol Surg. 2020;4(4):433–440. doi:10.1002/ags3.12339
8. Nunobe S, Oda I, Ishikawa T, et al. Surgical outcomes of elderly patients with Stage I gastric cancer from the nationwide registry of the Japanese Gastric Cancer Association. Gastric Cancer. 2020;23(2):328–338. doi:10.1007/s10120-019-01000-3
9. Granger A, Mott R, Emambokus N. Is aging as inevitable as death and taxes? Cell Metab. 2016;23(6):947–948. doi:10.1016/j.cmet.2016.06.003
10. Lopez-Otin C, Blasco MA, Partridge L, et al. The hallmarks of aging. Cell. 2013;153(6):1194–1217. doi:10.1016/j.cell.2013.05.039
11. Lazebnik Y. What are the hallmarks of cancer? Nat Rev Cancer. 2010;10(4):232–233. doi:10.1038/nrc2827
12. Campisi J. Aging, cellular senescence, and cancer. Annu Rev Physiol. 2013;75:685–705. doi:10.1146/annurev-physiol-030212-183653
13. Jiang Y, Li T, Liang X, et al. Association of adjuvant chemotherapy with survival in patients with stage II or III gastric cancer. JAMA Surg. 2017;152(7):e171087. doi:10.1001/jamasurg.2017.1087
14. June CH, Blazar BR, Riley JL. Engineering lymphocyte subsets: tools, trials and tribulations. Nat Rev Immunol. 2009;9(10):704–716. doi:10.1038/nri2635
15. Yin X, Fang T, Wang Y, et al. Prognostic significance of serum inflammation indexes in different Lauren classification of gastric cancer. Cancer Med. 2021;10(3):1103–1119. doi:10.1002/cam4.3706
16. Zander R, Schauder D, Xin G, et al. CD4(+) T cell help is required for the formation of a cytolytic CD8(+) T cell subset that protects against chronic infection and cancer. Immunity. 2019;51(6):1028–42 e4. doi:10.1016/j.immuni.2019.10.009
17. Russell JH, Ley TJ. Lymphocyte-mediated cytotoxicity. Annu Rev Immunol. 2002;20:323–370. doi:10.1146/annurev.immunol.20.100201.131730
18. Cowell LG. The diagnostic, prognostic, and therapeutic potential of adaptive immune receptor repertoire profiling in cancer. Cancer Res. 2020;80(4):643–654. doi:10.1158/0008-5472.CAN-19-1457
19. Zitvogel L, Perreault C, Finn OJ, et al. Beneficial autoimmunity improves cancer prognosis. Nat Rev Clin Oncol. 2021;18(9):591–602. doi:10.1038/s41571-021-00508-x
20. Fane M, Weeraratna AT. How the ageing microenvironment influences tumour progression. Nat Rev Cancer. 2020;20(2):89–106. doi:10.1038/s41568-019-0222-9
21. Huang Q, Cao Y, Wang S, et al. Creation of a novel inflammation-based score for operable colorectal cancer patients. J Inflamm Res. 2020;13:659–671. doi:10.2147/JIR.S271541
22. Li Z, Li S, Ying X, et al. The clinical value and usage of inflammatory and nutritional markers in survival prediction for gastric cancer patients with neoadjuvant chemotherapy and D2 lymphadenectomy. Gastric Cancer. 2020;23(3):540–549. doi:10.1007/s10120-019-01027-6
23. Amin MB, Greene FL, Edge SB, et al. The eighth edition AJCC cancer staging manual: continuing to build a bridge from a population-based to a more “personalized” approach to cancer staging. CA Cancer J Clin. 2017;67(2):93–99. doi:10.3322/caac.21388
24. Japanese Gastric Cancer A. Japanese gastric cancer treatment guidelines 2018 (edition). Gastric Cancer. 2021;24(1):1–21. doi:10.1007/s10120-020-01042-y
25. Tomasetti C, Li L, Vogelstein B. Stem cell divisions, somatic mutations, cancer etiology, and cancer prevention. Science. 2017;355(6331):1330–1334. doi:10.1126/science.aaf9011
26. Xie W, Kagiampakis I, Pan L, et al. DNA methylation patterns separate senescence from transformation potential and indicate cancer risk. Cancer Cell. 2018;33(2):309–21 e5. doi:10.1016/j.ccell.2018.01.008
27. Gruver AL, Hudson LL, Sempowski GD. Immunosenescence of ageing. J Pathol. 2007;211(2):144–156. doi:10.1002/path.2104
28. Maue AC, Yager EJ, Swain SL, et al. T-cell immunosenescence: lessons learned from mouse models of aging. Trends Immunol. 2009;30(7):301–305. doi:10.1016/j.it.2009.04.007
29. Weng NP, Hathcock KS, Hodes RJ. Regulation of telomere length and telomerase in T and B cells: a mechanism for maintaining replicative potential. Immunity. 1998;9(2):151–157. doi:10.1016/s1074-7613(00)80597-x
30. Weng NP, Granger L, Hodes RJ. Telomere lengthening and telomerase activation during human B cell differentiation. Proc Natl Acad Sci U S A. 1997;94(20):10827–10832. doi:10.1073/pnas.94.20.10827
31. Kuss I, Hathaway B, Ferris RL, et al. Decreased absolute counts of T lymphocyte subsets and their relation to disease in squamous cell carcinoma of the head and neck. Clin Cancer Res. 2004;10(11):3755–3762. doi:10.1158/1078-0432.CCR-04-0054
32. Lee WJ, Chang KJ, Lee CS, et al. Selective depression of T-lymphocyte subsets in gastric cancer patients: an implication of immunotherapy. J Surg Oncol. 1994;55(3):165–169. doi:10.1002/jso.2930550307
33. Cortellini A, Bersanelli M, Buti S, et al. A multicenter study of body mass index in cancer patients treated with anti-PD-1/PD-L1 immune checkpoint inhibitors: when overweight becomes favorable. J Immunother Cancer. 2019;7(1):57. doi:10.1186/s40425-019-0527-y
34. Aspinall R, Andrew D. Thymic involution in aging. J Clin Immunol. 2000;20(4):250–256. doi:10.1023/a:1006611518223
35. Groves CJ, Carrell J, Grady R, et al. CD19-positive antibody-secreting cells provide immune memory. Blood Adv. 2018;2(22):3163–3176. doi:10.1182/bloodadvances.2017015172
36. Apetoh L, Smyth MJ, Drake CG, et al. Consensus nomenclature for CD8(+) T cell phenotypes in cancer. Oncoimmunology. 2015;4(4):e998538. doi:10.1080/2162402X.2014.998538
37. Han J, Zhao L, Wu J, et al. Role of CD4(+)T, CD8(+)T Cells, and CD4(+)T/CD8(+)T Cell Ratio in Gastric Cancer and Its Clinical Significance. Appl Bionics Biomech. 2022;2022:1094607. doi:10.1155/2022/1094607
38. Khaled AR, Durum SK. The role of cytokines in lymphocyte homeostasis. Biotechniques. 2002;Suppl:40–45.
39. Surh CD, Sprent J. Regulation of naive and memory T-cell homeostasis. Microbes Infect. 2002;4(1):51–56. doi:10.1016/s1286-4579(01)01509-x
40. Kugel CH, Douglass SM, Webster MR, et al. Age correlates with response to Anti-PD1, reflecting age-related differences in intratumoral effector and regulatory T-cell populations. Clin Cancer Res. 2018;24(21):5347–5356. doi:10.1158/1078-0432.CCR-18-1116
41. Mimura K, Teh JL, Okayama H, et al. PD-L1 expression is mainly regulated by interferon gamma associated with JAK-STAT pathway in gastric cancer. Cancer Sci. 2018;109(1):43–53. doi:10.1111/cas.13424
42. Sasaki Y, Iwasa S, Okazaki S, et al. A Phase II study of combination therapy with oral S-1 and cisplatin in elderly patients with advanced gastric cancer. Gastric Cancer. 2018;21(3):439–445. doi:10.1007/s10120-017-0753-2
43. Demaria M, O’Leary MN, Chang J, et al. Cellular senescence promotes adverse effects of chemotherapy and cancer relapse. Cancer Discov. 2017;7(2):165–176. doi:10.1158/2159-8290.CD-16-0241
44. Obeid M, Tesniere A, Ghiringhelli F, et al. Calreticulin exposure dictates the immunogenicity of cancer cell death. Nat Med. 2007;13(1):54–61. doi:10.1038/nm1523
45. Emens LA. Chemotherapy and tumor immunity: an unexpected collaboration. Front Biosci. 2008;13:249–257. doi:10.2741/2675
46. Zitvogel L, Apetoh L, Ghiringhelli F, et al. The anticancer immune response: indispensable for therapeutic success? J Clin Invest. 2008;118(6):1991–2001. doi:10.1172/JCI35180
47. Zitvogel L, Apetoh L, Ghiringhelli F, et al. Immunological aspects of cancer chemotherapy. Nat Rev Immunol. 2008;8(1):59–73. doi:10.1038/nri2216
48. Muranski P, Boni A, Wrzesinski C, et al. Increased intensity lymphodepletion and adoptive immunotherapy--how far can we go? Nat Clin Pract Oncol. 2006;3(12):668–681. doi:10.1038/ncponc0666
49. Gattinoni L, Finkelstein SE, Klebanoff CA, et al. Removal of homeostatic cytokine sinks by lymphodepletion enhances the efficacy of adoptively transferred tumor-specific CD8+ T cells. J Exp Med. 2005;202(7):907–912. doi:10.1084/jem.20050732
50. Wang JB, Li P, Liu XL, et al. An immune checkpoint score system for prognostic evaluation and adjuvant chemotherapy selection in gastric cancer. Nat Commun. 2020;11(1):6352. doi:10.1038/s41467-020-20260-7
51. Shi H, Jiang Y, Cao H, et al. Nomogram based on systemic immune-inflammation index to predict overall survival in gastric cancer patients. Dis Markers. 2018;2018:1787424. doi:10.1155/2018/1787424
 © 2022 The Author(s). This work is published and licensed by Dove Medical Press Limited. The full terms of this license are available at https://www.dovepress.com/terms.php and incorporate the Creative Commons Attribution - Non Commercial (unported, v3.0) License.
By accessing the work you hereby accept the Terms. Non-commercial uses of the work are permitted without any further permission from Dove Medical Press Limited, provided the work is properly attributed. For permission for commercial use of this work, please see paragraphs 4.2 and 5 of our Terms.
© 2022 The Author(s). This work is published and licensed by Dove Medical Press Limited. The full terms of this license are available at https://www.dovepress.com/terms.php and incorporate the Creative Commons Attribution - Non Commercial (unported, v3.0) License.
By accessing the work you hereby accept the Terms. Non-commercial uses of the work are permitted without any further permission from Dove Medical Press Limited, provided the work is properly attributed. For permission for commercial use of this work, please see paragraphs 4.2 and 5 of our Terms.