")
Back to Journals » Risk Management and Healthcare Policy » Volume 15
Development and Validation of a Risk Score Screening Tool to Identify People at Risk for Hypertension in Shanghai, China
Authors Jiang Q, Gong D, Li H, Zhang D, Hu S, Xia Q, Yuan H, Zhou P, Zhang Y, Liu X, Sun M, Lv J, Li C
Received 23 December 2021
Accepted for publication 14 March 2022
Published 30 March 2022 Volume 2022:15 Pages 553—562
DOI https://doi.org/10.2147/RMHP.S354057
Checked for plagiarism Yes
Review by Single anonymous peer review
Peer reviewer comments 2
Editor who approved publication: Professor Mecit Can Emre Simsekler
Qiyun Jiang,1,2 Dan Gong,1,2 Huiqi Li,3 Donglan Zhang,4 Suzhen Hu,5 Qinghua Xia,6 Hong Yuan,7 Peng Zhou,6 Yiying Zhang,7 Xing Liu,8 Mei Sun,1,2 Jun Lv,1,2 Chengyue Li1,2
1Department of Health Policy and Management, School of Public Health, Fudan University, Shanghai, People’s Republic of China; 2Research Institute of Health Development Strategies, Fudan University, Shanghai, People’s Republic of China; 3School of Public Health and Community Medicine, Institute of Medicine, University of Gothenburg, Gothenburg, Sweden; 4Department of Health Policy and Management, College of Public Health, University of Georgia, Athens, GA, USA; 5Department of Medical Affairs, Liaocheng People’s Hospital, Liaocheng, People’s Republic of China; 6Department of Chronic Disease Prevention and Control, Changning District Center for Disease Control and Prevention, Shanghai, People’s Republic of China; 7Department of Chronic Disease Prevention and Control, Jiading District Center for Disease Control and Prevention, Shanghai, People’s Republic of China; 8Department of Epidemiology, School of Public Health, Fudan University, Shanghai, People’s Republic of China
Correspondence: Chengyue Li; Jun Lv, Department of Health Policy and Management, School of Public Health, Fudan University, P.O. Box 177, 130 Dong’an Road, Shanghai, 200032, People’s Republic of China, Tel +86-21-33561022 ; +86-21-33563953, Fax +86-21-33563380, Email [email protected]; [email protected]
Purpose: This study aimed to develop a screening tool based on a risk scoring approach that could identify individuals at high risk for hypertension in Shanghai, China.
Methods: A total of 3147 respondents from the 2013 Shanghai Chronic Disease and Risk Factor Surveillance were randomly divided into the derivation group and validation group. The coefficients obtained from multivariable logistic regression were used to assign a score to each variable category. The receiver operating characteristic (ROC) curve was used to find the optimal cut-off point and to evaluate the screening performance.
Results: Age, family history of hypertension, having diabetes, having dyslipidemia, body mass index, and having abdominal obesity contributed to the risk score. The area under the ROC curve was 0.817 (95% CI: 0.797– 0.836). The optimal cut-off value of 20 had a sensitivity of 83.4%, and a specificity of 64.3%, demonstrating good performance.
Conclusion: We developed a simple and valid screening tool to identify individuals at risk for hypertension. Early detection could be beneficial for high-risk groups to better manage their conditions and delay the progression of hypertension and related complications.
Keywords: Eastern China, high-risk population, hypertension, risk scoring method, screening tool
Introduction
Hypertension has become a major public health problem around the world.1 Hypertension and its complications accounted for more than 50% of the 17 million deaths caused by cardiovascular disease every year.2 The population at risk for hypertension is a group with prevalent risk factors or characteristics and hence with a higher risk for hypertension than the general population.3 The risk of developing hypertension in this group was doubled than those with normal blood pressure (BP).4 Epidemiological studies have indicated that the prevalence of people at risk for hypertension was more than 40% in China.5 A growing body of evidence has suggested that early identification and management of the people at risk for hypertension could be of great benefit to control the cardiovascular events, delay the onset of hypertension and reduce the disease and economic burden.6,7 Therefore, development of a low-cost screening tool for population-based early identification of high-risk individuals is a critical public health strategy.
The blood pressure measured by trained general practitioners was commonly used to identify individuals at risk for hypertension in the community, according to the Guidelines for the Prevention and Treatment of Hypertension in the USA,8 Europe,9 and China.10 Several studies also used BP to height ratios,11 height-specific BP percentile charts,12 or waist circumference (WC)13 to identify the high-risk individuals. However, BP is dynamic and can only give information on a subject’s current status, which may lead to misclassification of high-risk individuals with other risk factors. As the majority of adults have at least one risk factor for hypertension,14 the application of the risk scoring method has advantages in identifying people at high risk for cardiovascular disease.15 This method has been widely used in the screening of asymptomatic people with diabetes,16,17 dementia,18 and sleep-disordered breathing.19 Several studies also used this method to predict the probability of incident hypertension.20–22 However, they did not use this method to screen the people at risk for the purpose of hypertension prevention. To our knowledge, only one study used the method for the early identification of high-risk individuals in primary care settings, which was conducted in rural India.23 Currently there were no such tools available for Chinese population.
Our study aimed to develop a simple and valid screening tool to prospectively identify people at risk for hypertension based on the risk scoring approach, and evaluate the performance of this tool in a cross-sectional setting. This screening tool could help general practitioners to identify high-risk individuals to potentially prevent them from developing hypertension.
Materials and Methods
Study Design and Data
Data for this study were from the survey of Shanghai Chronic Disease and Risk Factors Surveillance in 2013, where a sample of residents aged 15 years or above who had lived in Shanghai for more than 6 months was interviewed.24 The survey was carried out by Shanghai Municipal Center for Disease Control and Prevention (CDC), with the supports of all 16 district-level CDCs from May to July 2013.
The stratified multistage random sampling method was used in the survey. First, sixteen districts were divided into two groups: urban and sub-urban. Sixty townships or communities were randomly selected in each group. Second, within each sampled township or community, four villages or neighborhood blocks were selected by probability proportional to size sampling. The sampled villages or neighborhood blocks were divided into several lanes according to their geographical location, where each lane consisted of about 50 households. Third, two lanes were randomly selected from each sampled village or neighborhood block. Fourth, 27 households were randomly selected from each sampled lane and one person was picked up to participate in the survey from the selected household through the Kish Grid sampling method. Finally, a total of 25,657 respondents participated in the survey. All the participants were interviewed face-to-face by trained interviewers, using a structured questionnaire. Questionnaires included demographic information, socioeconomic status, clinical conditions (eg disease history of diabetes and dyslipidemia, family history of hypertension), physical examination information (eg height, weight, waist circumference, BP), health-related behaviors (eg diets, drinking alcohol, smoking). Hypertension was defined as: (i) having an average systolic BP of 140 mmHg or higher or (ii) having an average diastolic BP of 90 mmHg or higher, or (iii) the respondent was currently taking antihypertensive medications (either Western or traditional Chinese medications) to manage hypertension condition.25 BP was measured by the trained general practitioners, following the standard procedure recommended by the Chinese Guidelines for the Prevention and Treatment of Hypertension. After resting quietly in a seated position for 5 minutes, 3 consecutive BP readings were obtained by the automated validated Omron electronic sphygmomanometer (OMRON Corporation, Kyoto, Japan).
The sample in this study included respondents from one urban and one sub-urban district, with a total of 3495 respondents. After excluding 348 individuals with incomplete information, our final sample consisted of 3147 respondents who had provided complete data for all variables. Comparing the age distributions (Myer’s index=7.77, less than 60) of the 3147 respondents against those of all residents in Shanghai in 2013 suggested that the sample was representative of the population in Shanghai for age and population structure.26,27 The study respondents were then randomly divided into two groups of similar size, one for developing the screening algorithm (1573 cases) and the other for validating (1574 cases). The flowchart of sample selection was shown in Figure 1.
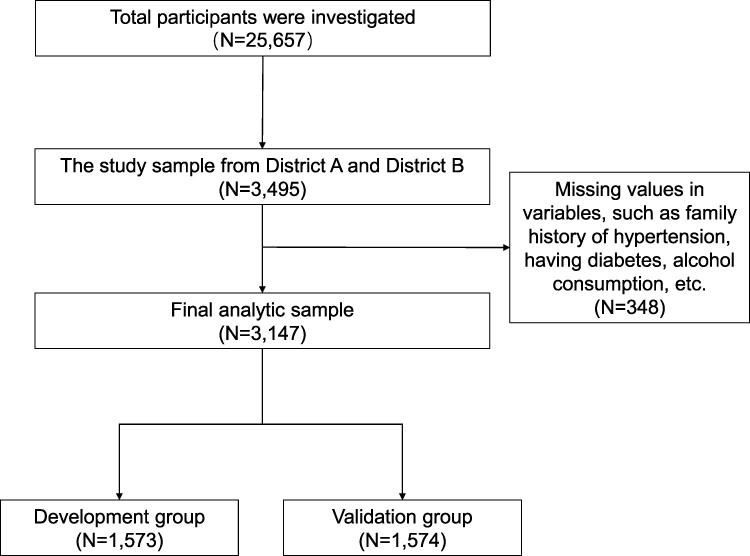 |
Figure 1 Flowchart of sample selection from the survey of Shanghai Chronic Disease and Risk Factors Surveillance in 2013. |
Developing the Screening Tool
Risk factors associated with hypertension were selected to be evaluated, both from literature and clinical knowledge. To keep the screening tool simple and easy to use, we excluded information that can only be assessed in laboratory tests or other clinical measurements, as well as interaction terms in the model. The variables included in the model were age (<60 years; ≥60 years), sex, educational levels (junior high school or below; high school or above), marital status (single; married), smoking (never; previous smoker; smoking but not every day; smoking every day), average frequency of drinking alcohol (never; <1 day a month; 1–3 days a month; 1–4 days a week; ≥5 days a week), average frequency of consumption of meat/vegetables/fresh fruits in a week (< once per day; ≥ once per day), salt intake (low (< 6g per day); moderate (6–9g per day); high (≥ 9g per day)), sleep quality (defined by the average frequency of being unable to sleep or hard to sleep well in a week, and categorized into three groups: good (never); medium (1–3 days per week); poor (≥ 3 days per week)), body mass index (BMI,<24kg/m2; ≥24kg/m2), abdominal obesity (Yes/No, waist circumference ≥90 cm in males or ≥85 cm in females), family history of hypertension (Yes/No), having diabetes (Yes/No), and having dyslipidemia (Yes/No).
Each selected variable was separately tested for their association with the status of hypertension using Pearson’s Chi-square test. Variables significant in the tests were included in the multivariable logistic model using stepwise backward elimination, with the status of hypertension as the dependent variable. The screening tool was then established, including all variables that were kept in the final model. For each variable, the risk score was derived by multiplying the regression coefficients by 10 and rounding to the nearest integer. The reference category of each variable was given a score of 0. A sum score was calculated for each participant by adding the score of each variable.
Validating the Screening Tool
The screening tool was tested for sensitivity and specificity in the validation group, independent of the group in which the score was derived. The receiver operating characteristic (ROC) curve was used to obtain the optimal cut-off value for the risk score. The performance of the screening tool was evaluated according to the area under the curve (AUC) in the ROC curve, sensitivity, specificity, the positive predictive value, and the negative predictive value with 95% Confidence Intervals (CIs). In general, an AUC of more than 0.8 indicates excellent discrimination.28 Furthermore, the trend of the risk score categories and the prevalence of hypertension were calculated using the Trend Chi-square test.
Statistical Analysis
All analyses were performed using SPSS 22.0 (SPSS Inc., Chicago, IL, USA). Descriptive analyses were performed to show the characteristics of the participants. Univariate and multivariable logistic regression analyses were performed to identify independent factors in the risk model. P values were two-sided, and P<0.05 was considered as statistically significant.
Results
Characteristics
The general characteristics of the study population are presented in Table 1. The derivation group consisted of 1573 individuals, and 503 (32.0%) of whom had hypertension. The validation group consisted of 1574 individuals, and 494 (31.4%) of whom had hypertension. There were no differences between these two groups regarding the socio-demographic characteristics and clinical conditions, including age, sex, education, marital status, family history of hypertension, etc.
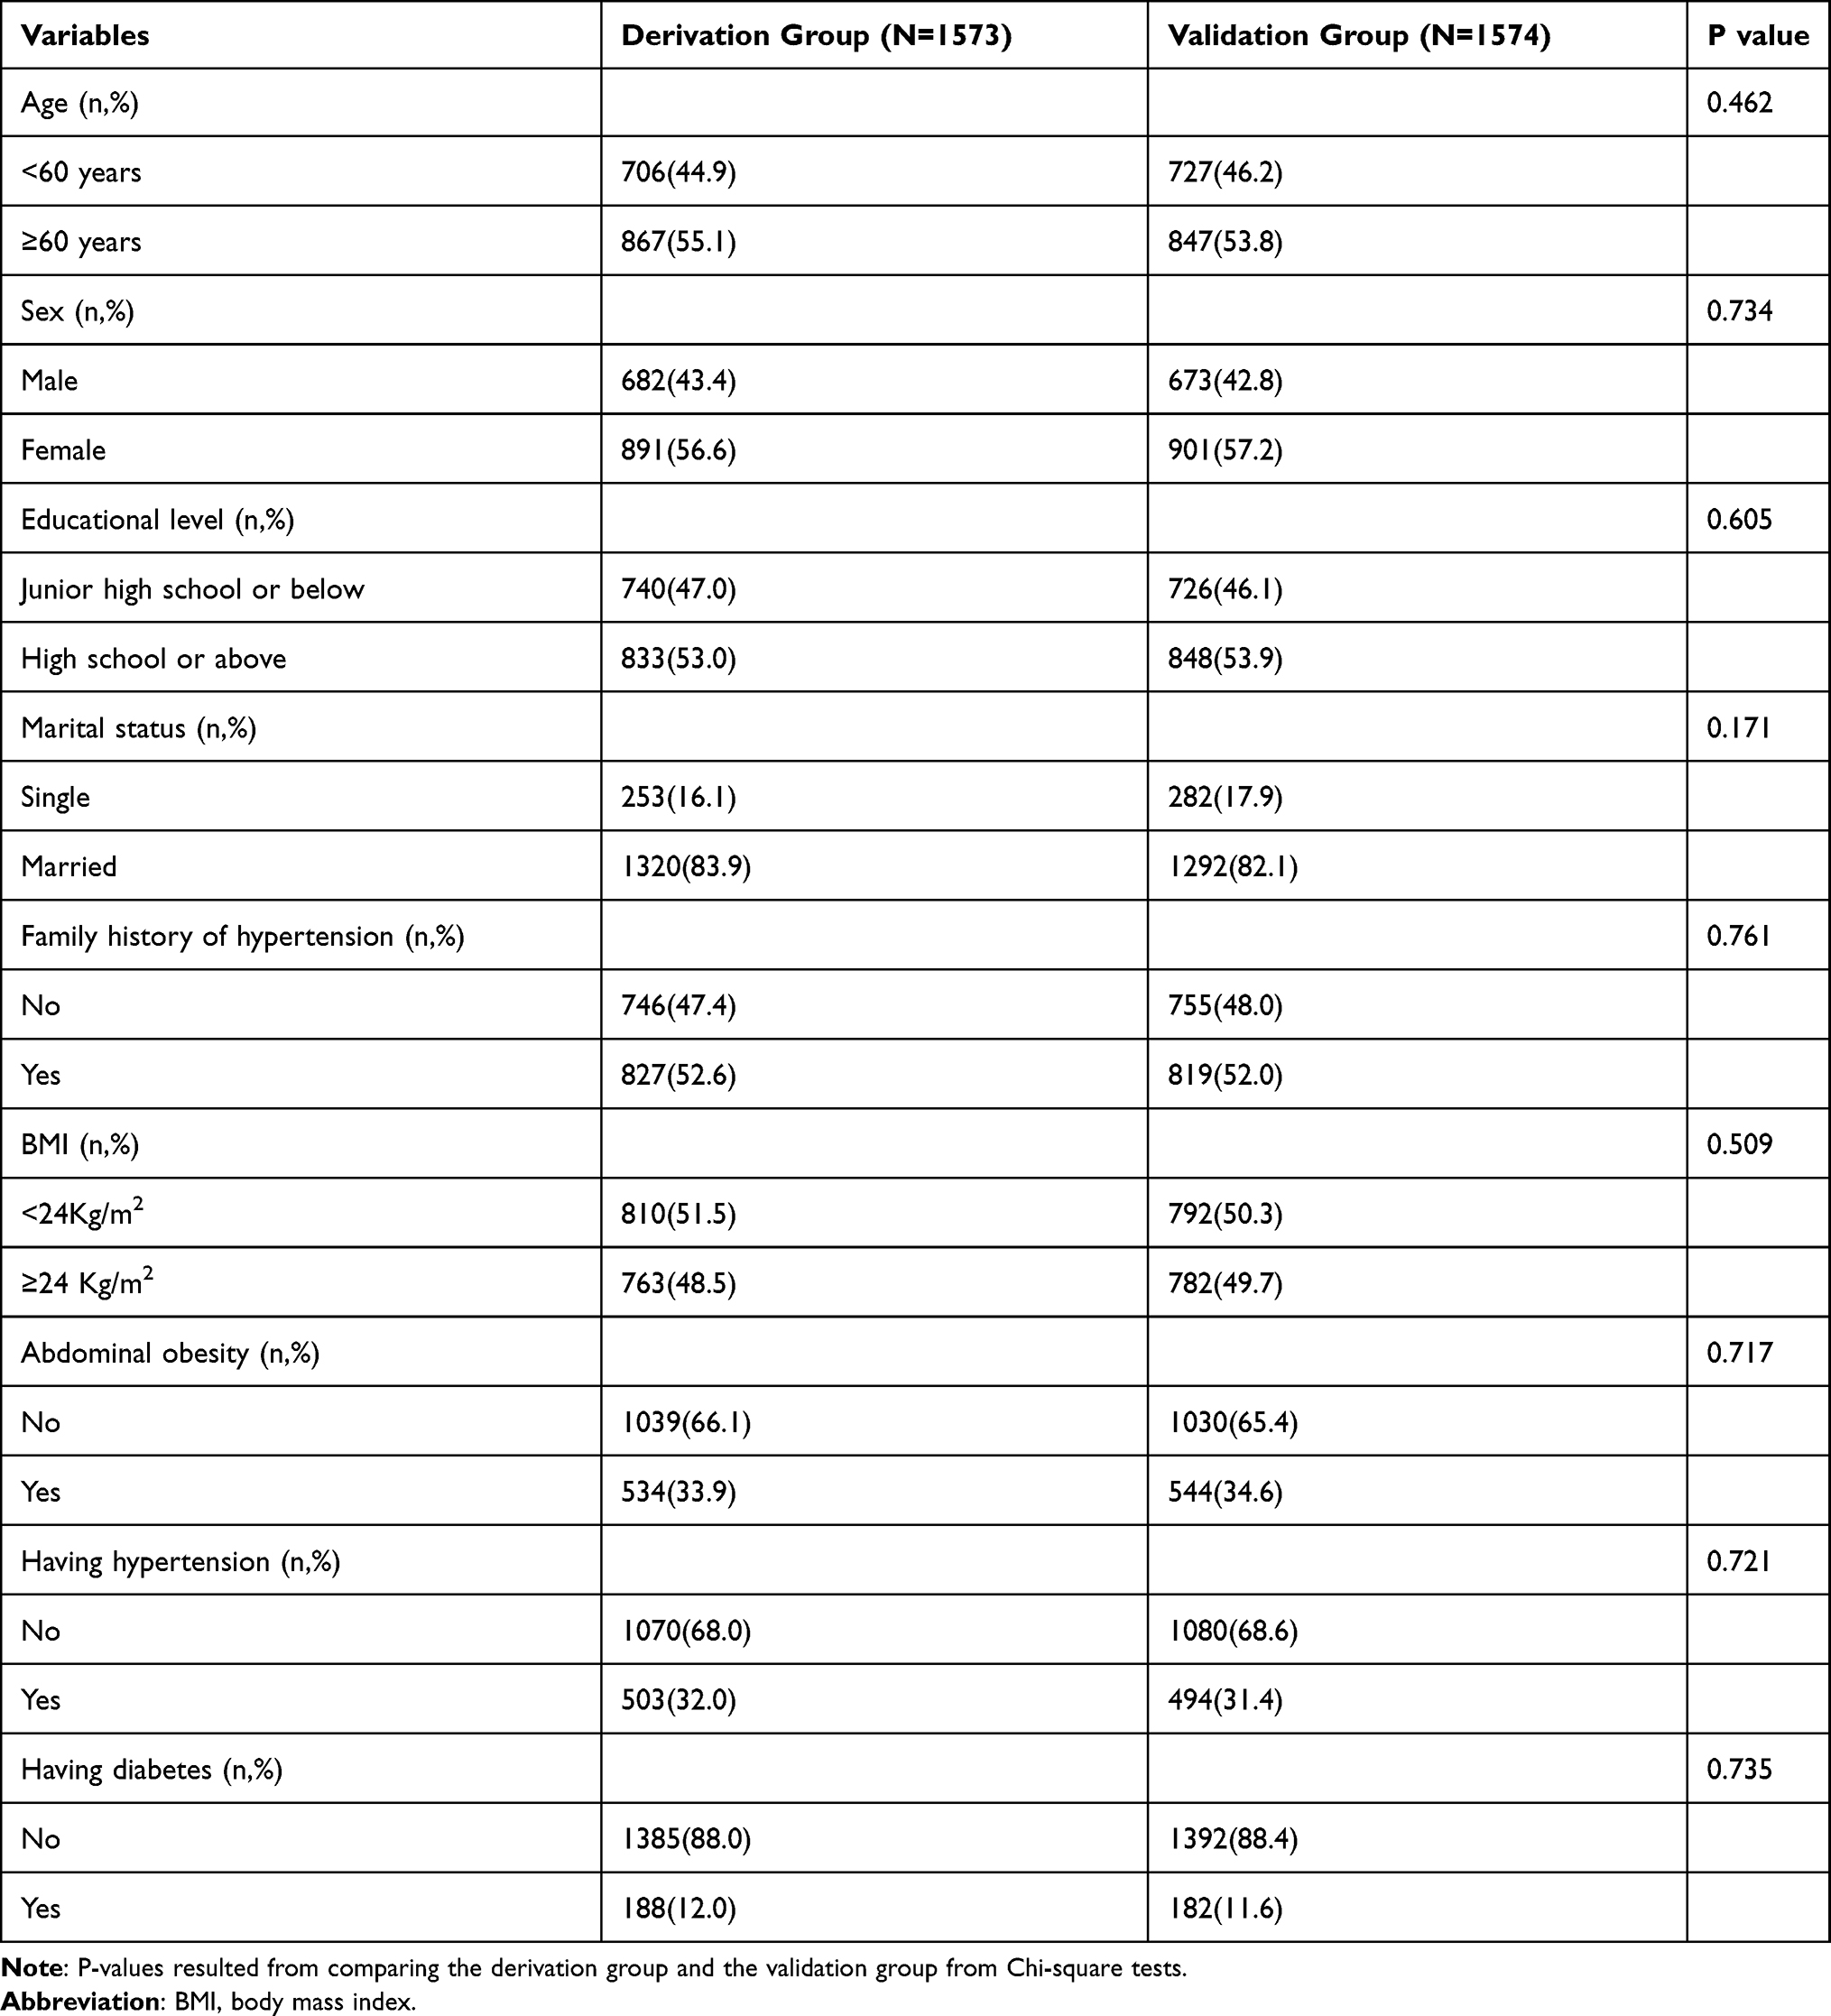 |
Table 1 Characteristics of the Study Population |
Development of the Screening Tool
The results of the separate Chi-square tests were presented in Supplementary Table 1. After stepwise backward elimination of the non-significant variables, the final model included variables of age, family history of hypertension, having diabetes, having dyslipidemia, BMI, and abdominal obesity (Table 2). The model showed a good fit (Hosmer-Lemeshow test P>0.05). The score for each variable is shown in the last column in Table 2. The sum score was calculated as the sum of the individual scores and may vary from 0 to 48.
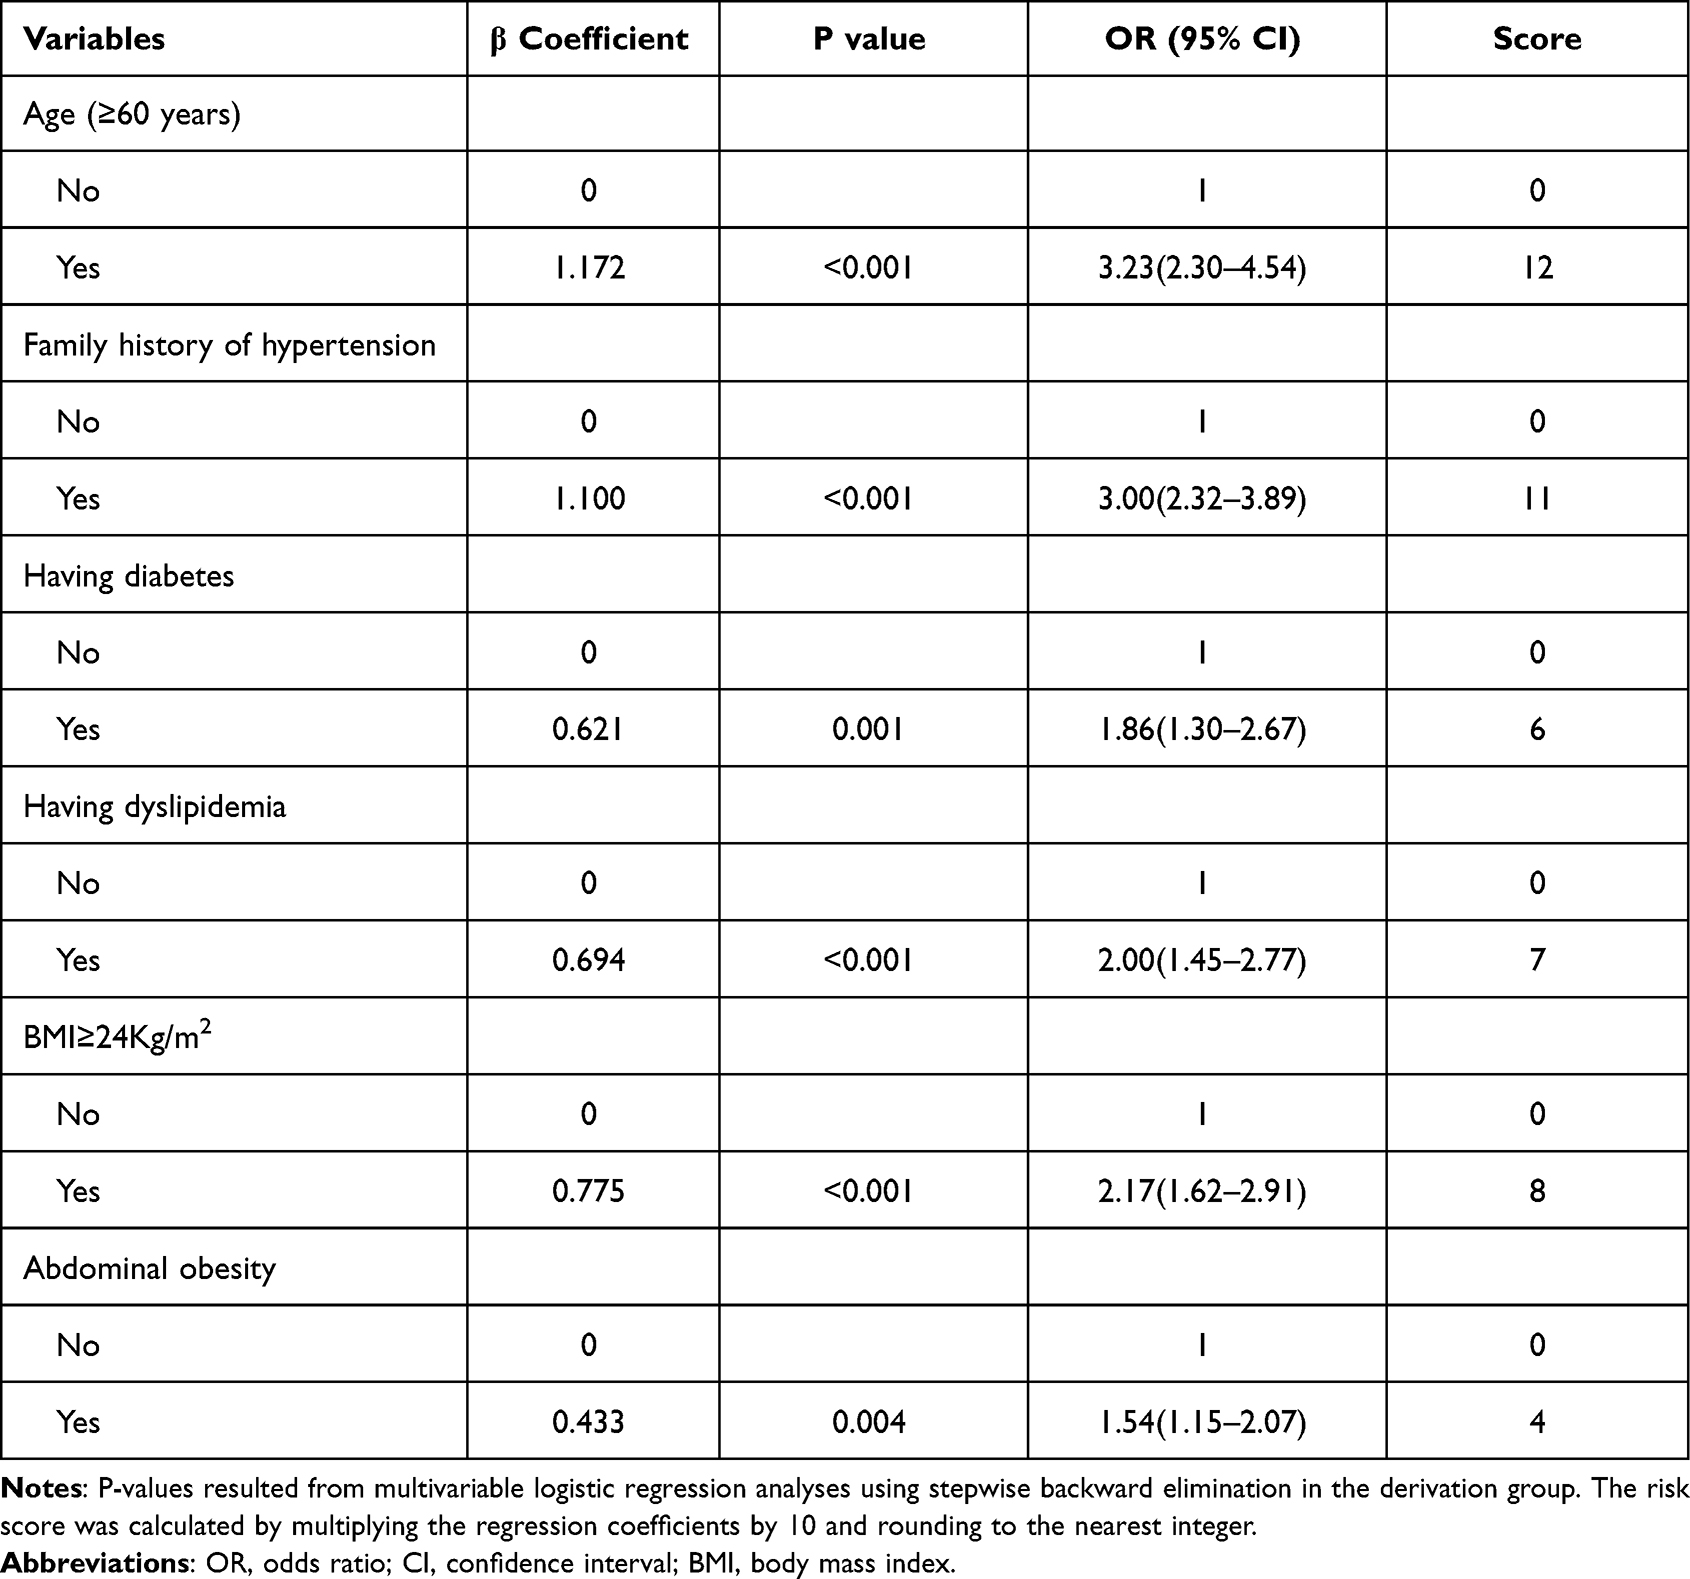 |
Table 2 Results of the Multivariable Logistic Model of the Risk Factors of Hypertension, and the Corresponding Score for Each Variable |
Validation of the Screening Tool
The performance of the screening tool in the validation group is shown in the ROC curves (Figure 2) and in Table 3. The area under the ROC curve was 0.817 (95% CI: 0.797–0.836), which indicated that the tool identified the people at risk for hypertension very well. The cut-off value was chosen to maximize the sensitivity and specificity, aiming to minimize the number of false positives and false negatives. The risk score value of 20 was selected as the optimal cut-off value, with a sensitivity of 83.4%, a specificity of 64.3%, a positive predictive value of 51.6%, and a negative predictive value of 89.4%.
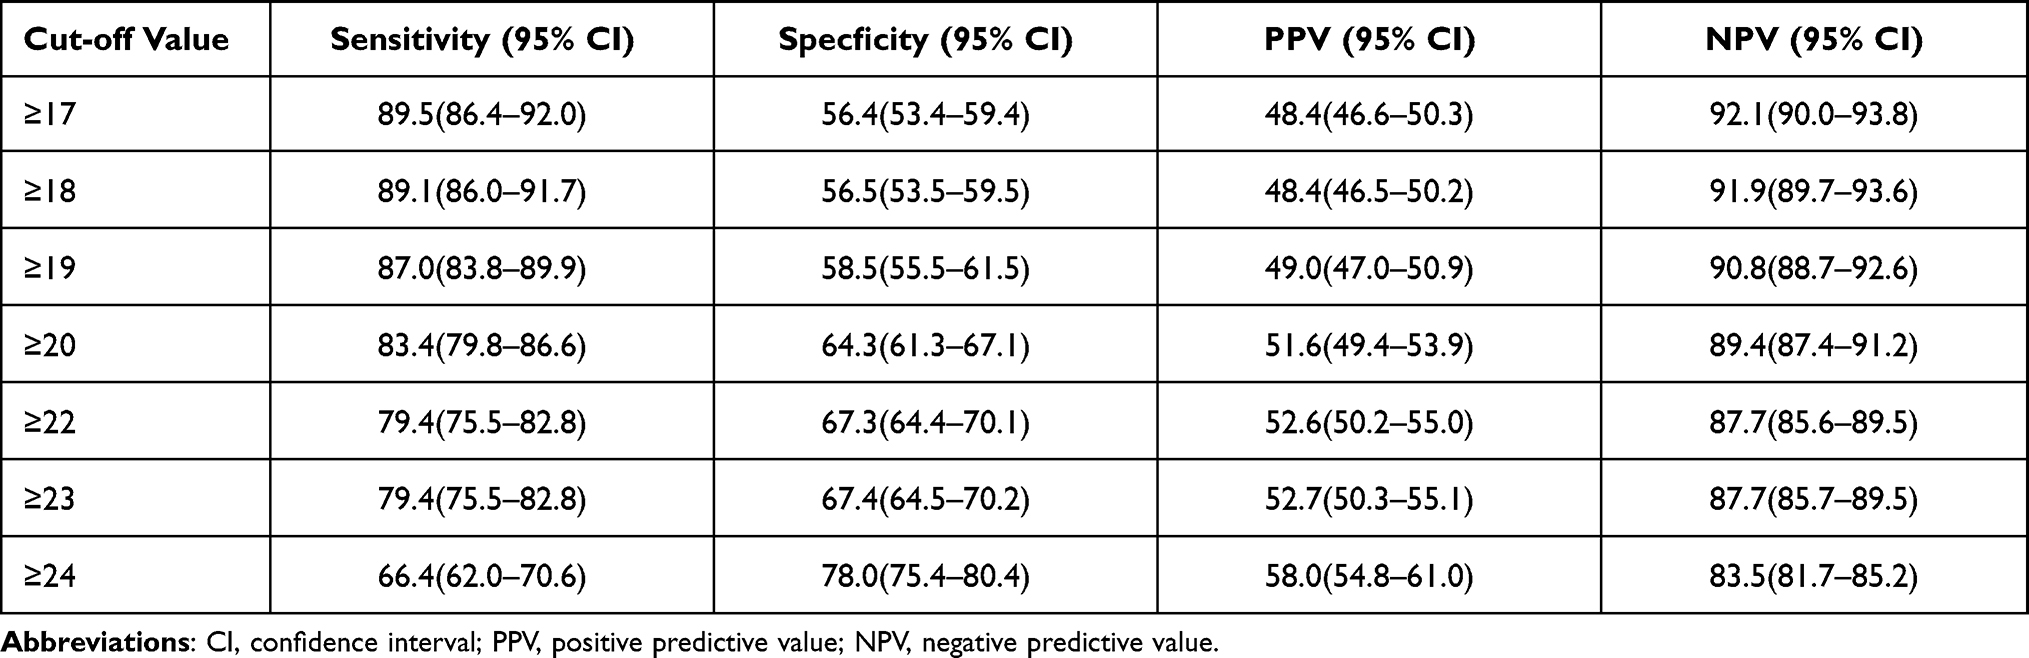 |
Table 3 Performance of the Screening Tool Through the Comparison of the Cut-off Value in Identifying the People at Risk for Hypertension in the Validation Group |
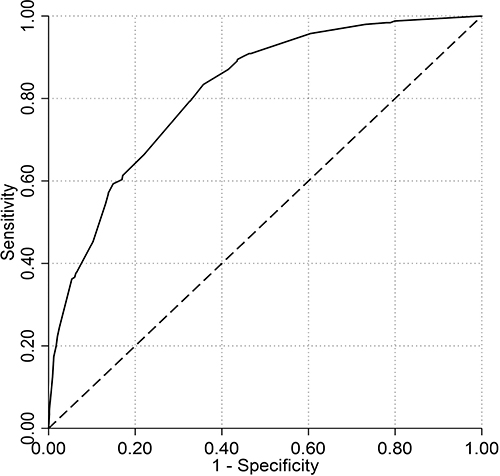 |
Figure 2 Receiver operating characteristic (ROC) curve for identifying the people at risk for hypertension in the validation group: the area under the curve (AUC) = 0.817 (95% CI:0.797–0.836). |
In Table 4, individuals in the validation group were classified into three risk score categories. The prevalence of hypertension rose with higher risk score categories (p<0.001), which was markedly elevated in the two highest categories. Compared to those with risk score between 0–20, the Odds Ratio (OR) of being hypertensive was 4.08 (95% CI: 3.04–5.47) for the group with risk score between 21–30 and 11.52 (95% CI: 8.41–15.79) for the group with risk score between 31–48.
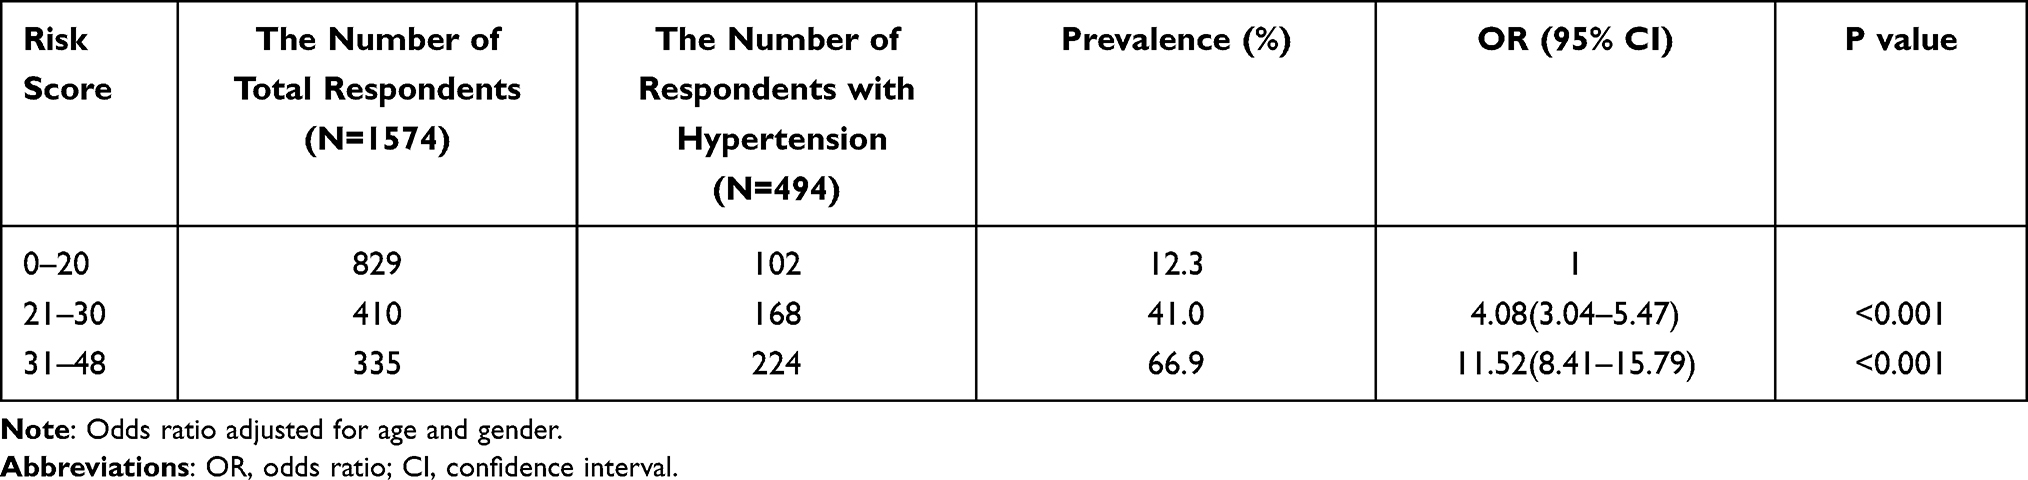 |
Table 4 Association Between the Risk Scores and the Prevalence of Hypertension in the Validation Group |
Discussion
We have developed a simple and valid screening tool to identify the people at increased risk for hypertension in Shanghai, with good discrimination and calibration. Age, family history of hypertension, having diabetes, having dyslipidemia, BMI, and abdominal obesity contributed to the risk score. It was derived from a randomly selected, population-based sample covering both young and old. The tool focused on factors that are easy to measure without invasive methods, known to be associated with being hypertensive, and draw attention to modifiable risk factors of hypertension.29,30
Our study has a sensitivity of 83.4% and specificity of 64.3%, which showed higher sensitivity (83.4% VS 78.6%) than the risk score developed in India.23 Furthermore, the AUC exceeded those for the published risk factor questionnaire,23,29 which indicated that our screening tool had good discriminative ability. Although the positive predictive value and specificity may seem low, the negative predictive value was quite high given that this was a screening tool and not a confirmatory tool. Therefore, this tool could be used as a simple and convenient tool to help the primary health care workers identify high-risk individuals who might develop hypertension. For example, individuals with a low-risk score are less likely to develop hypertension so that they do not need to be tightly followed up for further management. Moreover, the screening tool could be used to stratify the high-risk individuals into different subsets according to their risk score (eg the sum score more than 30), in order to adopt different interventions precisely.31 This could make the preventive interventions and health education more focused on the target population. Additionally, the variables included in the screening tool are mostly modifiable risk factors, and some factors may become apparent over time.32 Therefore, the screening should be an ongoing process.33
Defining a suitable cut-off point is a trade-off. The ROC curve has been recommended for finding the optimal threshold in screening and diagnostic tests, ie, the point maximizing the sum of sensitivity and specificity.34 However, the trade-off between sensitivity and specificity must be weighed against many conditions, including: the prevalence of the disease, the workload of the general practitioners, whether the test is a part of a screening strategy or a single screening test, how often the test should be offered, the effectiveness of subsequent treatment,35 etc. The general practitioners were engaged in the prevention and management of most of the hypertensive patients. If a lower threshold was used, more individuals would be classified as high-risk for hypertension, which would become a challenging workload for the general practitioners. According to the choice of the cut-off point in this study, up to 45% of the population would be classified as high-risk individuals, which was similar to the current prevalence of prehypertension (41.3%) in China.5 This would not cause any substantial increase in workload for the general practitioners since it is already part of their work to manage the individuals at risk for hypertension.25 However, the cut-off point could be evaluated dynamically according to the workload and prevalence of hypertension in the future, and be adjusted when needed.
A screening tool regarding phenotypical characteristics could never be perfect.36 In our study, approximately 20% of individuals with hypertension had a low score. The reason for this may be (i) they had other risk factors that were not included in our screening tool, and very likely to be that information that required laboratory work, for example, genetic factors, biomarker factors, and so on; (ii) these individuals changed their lifestyle after diagnosis of hypertension and therefore had low scores.37 Unfortunately, due to the limit of the cross-sectional setting of our study, we are not able to distinguish the true reason. On the other hand, approximately 33% of the non-hypertensive individuals had a high score. However, it does not necessarily mean that these individuals were misclassified. The main reason is that these individuals appeared to be non-hypertensive at the time of the survey, but they may develop hypertension later. These two problems should be further investigated in a prospective setting.
It is important to identify and manage the high-risk groups for hypertension as early and effectively as possible so as to delay the progression to hypertension.38 After the early detection, appropriate community-based interventions could be provided to encourage them to adopt healthy lifestyles,39 which will likely improve modifiable risk factors. For instance, our study indicated that BMI was a strong influencing factor for developing hypertension, which was similar to the results of other studies.40,41 For those high-risk groups with high BMI, knowledge regarding healthy diet, such as “DASH (Dietary Approaches to Stop Hypertension) diet”, could be promoted to them to form correct beliefs on low fat and low sodium diet, and eventually change to a light diet and reduce energy intake.42 Furthermore, these high-risk subjects should be encouraged to be engaged in more physical exercises to control their BMIs.43
Our study has several limitations. First, we did not analyze all the possible factors that may contribute to the incidence of hypertension due to data availability. Second, we could not predict the short- or long-term risk of hypertension, as reported in other studies,44 because the dataset was derived from a cross-sectional study. Third, selection bias may exist because of missing information in the key variables. Fortunately, the characteristics of those with and without missing values were not significantly different in the dataset. Finally, since the survey was conducted in Shanghai, it was mainly applicable to the developed regions in Eastern China. It should be relevant to evaluate the generalizability before the screening tool could be used in other parts of China.
Conclusions
In summary, our study has developed a simple and valid screening tool with good sensitivity and medium specificity, to identify individuals at risk for hypertension for the general practitioners in Shanghai. It is a practical way to early detect and manage those at high risk, to delay the progression of hypertension and related complications, which would be beneficial to the individual, the family, and the whole society. Such strategies should be adopted into the nationwide program for hypertension prevention and be launched thoroughly across the country, which could help to delay the onset of hypertension and reduce its prevalence in China.
Data Sharing Statement
The datasets used and/or analyzed during the current study are available from the corresponding author, Chengyue Li, upon reasonable request by emailing [email protected].
Ethics Approval and Consent to Participate
This study was approved by the Ethical Review Committee at Shanghai Municipal CDC, Shanghai, China, and the approval number was IRB#2013-1. And all participants gave consent in written format.
Acknowledgments
We thank the Changning District Center for Disease Control and Prevention, and Jiading District Center for Disease Control and Prevention, Shanghai, China for their support of providing data.
Author Contributions
All authors made a significant contribution to the work reported, whether that is in the conception, study design, execution, acquisition of data, analysis and interpretation, or in all these areas; took part in drafting, revising or critically reviewing the article; gave final approval of the version to be published; have agreed on the journal to which the article has been submitted; and agree to be accountable for all aspects of the work.
Funding
This study was funded by the National Natural Science Foundation of China (71774031 and 71974035), the National Science &Technology Pillar Program during the Twelfth Five-year Plan Period (2014BAI08B01), the Major Project of the National Social Science Fund of China (17ZDA078), and the Shanghai Foundation for Talents Development (grant number 2020128).
Disclosure
The authors declare that they have no competing interests in this work.
References
1. Kearney PM, Whelton M, Reynolds K, Muntner P, Whelton PK, He J. Global burden of hypertension: analysis of worldwide data. Lancet. 2005;365(9455):217–223. doi:10.1016/S0140-6736(05)17741-1
2. World Health Organization. A global brief on hypertension: silent killer, global public health crisis: World Health Day 2013; 2013. Available from: https://apps.who.int/iris/handle/10665/79059.
3. Gong D, Yuan H, Zhang Y, et al. Hypertension-related knowledge, attitudes, and behaviors among community-dwellers at risk for high blood pressure in Shanghai, China. Int J Environ Res Public Health. 2020;17(10):3683. doi:10.3390/ijerph17103683
4. Chobanian AV, Bakris GL, Black HR, et al. Seventh report of the joint national committee on prevention, detection, evaluation, and treatment of high blood Pressure. Hypertension. 2003;42(6):1206–1252. doi:10.1161/01.HYP.0000107251.49515.c2
5. Wang Z, Chen Z, Zhang L, et al. Status of hypertension in China: results From the China hypertension survey, 2012–2015. Circulation. 2018;137(22):2344–2356. doi:10.1161/CIRCULATIONAHA.117.032380
6. Julius S, Nesbitt SD, Egan BM, et al. Feasibility of treating prehypertension with an angiotensin-receptor blocker. N Engl J Med. 2006;354(16):1685–1697. doi:10.1056/NEJMoa060838
7. Assadi F. Prehypertension: a warning sign of future cardiovascular risk. Int J Prev Med. 2014;5(Suppl 1):S4–S9.
8. Whelton PK, Carey RM, Aronow WS, et al. 2017 ACC/AHA/AAPA/ABC/ACPM/AGS/APhA/ASH/ASPC/NMA/PCNA guideline for the prevention, detection, evaluation, and management of high blood pressure in adults: executive summary: a report of the American College of Cardiology/American Heart Association Task Force on Clinical Practice Guidelines. Hypertension. 2018;71(6):1269–1324. doi:10.1161/HYP.0000000000000066
9. Williams B, Mancia G, Spiering W, et al. 2018 ESC/ESH guidelines for the management of arterial hypertension: the task force for the management of arterial hypertension of the European society of cardiology and the European Society of Hypertension: the task force for the management of arterial hypertension of the European Society of Cardiology and the European Society of Hypertension. J Hypertens. 2018;36(10):1953–2041. doi:10.1097/HJH.0000000000001940
10. The Revision Committee of Chinese Guidelines for Prevention and Treatment of Hypertension. Chinese guidelines for prevention and treatment of hypertension (2018). Chin J Cardiovasc Med. 2019;24:24–56. doi:10.3969/j.issn.1007-5410.2019.01.002
11. Ejike CE. Blood pressure to height ratios as simple, sensitive and specific diagnostic tools for adolescent (pre)hypertension in Nigeria. Ital J Pediatr. 2011;37(1):30. doi:10.1186/1824-7288-37-30
12. Banker A, Bell C, Gupta-Malhotra M, Samuels J. Blood pressure percentile charts to identify high or low blood pressure in children. BMC Pediatr. 2016;16(1):98. doi:10.1186/s12887-016-0633-7
13. Ma M, Tan X, Zhu S. Prehypertension and its optimal indicator among adults in Hubei Province, Central China, 2013–2015. Clin Exp Hypertens. 2017;39(6):532–538. doi:10.1080/10641963.2017.1281948
14. Gu DF, Gupta A, Muntner P, et al. Prevalence of cardiovascular disease risk factor clustering among the adult population of China: results from the International Collaborative Study of cardiovascular disease in Asia (InterAsia). Circulation. 2005;112(5):658–665. doi:10.1161/CIRCULATIONAHA.104.515072
15. Lubna SR. Predicting coronary heart disease through risk factor categories.
16. Zhang L, Zhang Z, Zhang Y, Hu G, Chen L. Evaluation of Finnish Diabetes Risk Score in screening undiagnosed diabetes and prediabetes among U.S. adults by gender and race: NHANES 1999–2010. PLoS One. 2014;9(5):e97865. doi:10.1371/journal.pone.0097865
17. Griffin SJ, Little PS, Hales CN, Kinmonth AL, Wareham NJ. Diabetes risk score: towards earlier detection of type 2 diabetes in general practice. Diabetes Metab Res Rev. 2000;16(3):164–171. doi:10.1002/1520-7560(200005/06)16:3<164::AID-DMRR103>3.0.CO;2-R
18. Kivipelto M, Ngandu T, Laatikainen T, Winblad B, Soininen H, Tuomilehto J. Risk score for the prediction of dementia risk in 20 years among middle aged people: a longitudinal, population-based study. Lancet Neurol. 2006;5(9):735–741. doi:10.1016/S1474-4422(06)70537-3
19. Marti-Soler H, Hirotsu C, Marques-Vidal P, et al. The NoSAS score for screening of sleep-disordered breathing: a derivation and validation study. Lancet Respir Med. 2016;4(9):742–748. doi:10.1016/S2213-2600(16)30075-3
20. Lim NK, Son KH, Lee KS, Park HY, Cho MC. Predicting the risk of incident hypertension in a Korean middle-aged population: Korean genome and epidemiology study. J Clin Hypertens. 2013;15(5):344–349. doi:10.1111/jch.12080
21. Chien KL, Hsu HC, Su T, et al. Prediction models for the risk of new-onset hypertension in ethnic Chinese in Taiwan. J Hum Hypertens. 2011;25(5):294–303. doi:10.1038/jhh.2010.63
22. Paynter NP, Cook NR, Everett BM, Sesso HD, Buring JE, Ridker PM. Prediction of incident hypertension risk in women with currently normal blood pressure. Am J Med. 2009;122(5):464–471. doi:10.1016/j.amjmed.2008.10.034
23. Sathish T, Kannan S, Sarma PS, Razum O, Thrift AG, Thankappan KR. A risk score to predict hypertension in primary care settings in Rural India. Asia Pac J Public Health. 2016;28(1_suppl):26S–31S. doi:10.1177/1010539515604701
24. Shanghai Municipal Center for Disease Control and Prevention. The Survey of Shanghai Chronic Disease and Risk Factors Surveillance in 2013. Shanghai: Shanghai Science Spreading Publishing House; 2014.
25. Zhang D, Pan X, Li S, et al. Impact of the national essential public health services policy on hypertension control in China. Am J Hypertens. 2017;31(1):115–123. doi:10.1093/ajh/hpx139
26. Shanghai Municipal Statistics Bureau. Shanghai Statistical Yearbook 2014. Beijing: China Statistical Publishing House; 2014.
27. Shryokc HS, Siegal JS. The Methods and Materials of Demography. New York City: Academic Press; 1976.
28. Hosmer DW, Lemeshow S, Sturdivant RX. Applied Logistic Regression. New York City: John Wiley & Sons; 2013.
29. Zhang H, Shi W, Zhang M, et al. Establishing a noninvasive prediction model for type 2 diabetes mellitus based on a rural Chinese population. Chin J Prev Med. 2016;50:397–403. doi:10.3760/cma.j.issn.0253-9624.2016.05.003
30. Gu A, Yue Y, Kim J, Argulian E. The burden of modifiable risk factors in newly defined categories of blood pressure. Am J Med. 2018;131(11):1349–1358.e5. doi:10.1016/j.amjmed.2018.06.030
31. Egan BM, Stevens-Fabry S. Prehypertension–prevalence, health risks, and management strategies. Nat Rev Cardiol. 2015;12(5):289–300. doi:10.1038/nrcardio.2015.17
32. Owiredu EW, Dontoh E, Essuman SES, Bazanfara BB. Demographic and lifestyle predictors of prehypertension: a cross-sectional study among apparently healthy adults in Kumasi, Ghana. Biomed Res Int. 2019;2019:1–7. doi:10.1155/2019/1764079
33. Shickle D, Chadwick R. The ethics of screening: is ‘screeningitis’ an incurable disease? J Med Ethics. 1994;20(1):12–18. doi:10.1136/jme.20.1.12
34. Vetter TR, Schober P, Mascha EJ. Diagnostic testing and decision-making: beauty is not just in the eye of the beholder. Anesth Analg. 2018;127(4):1085–1091. doi:10.1213/ANE.0000000000003698
35. Habibzadeh F, Habibzadeh P, Yadollahie M. On determining the most appropriate test cut-off value: the case of tests with continuous results. Biochem Med (Zagreb). 2016;26:297–307. doi:10.11613/BM.2016.034
36. Jass JR. Understanding Pathology: From Disease Mechanisms to Clinical Practice. London: CRS Press; 1999.
37. Nepal P, Dhungana B. Lifestyle modification after diagnosis of hypertension in patients visiting Lumbini Medical College Teaching Hospital. J Lumbini Med Coll. 2015;3(1):12–15. doi:10.22502/jlmc.v3i1.62
38. Fuchs FD, de Mello RB, Fuchs SC. Preventing the progression of prehypertension to hypertension: role of antihypertensives. Curr Hypertens Rep. 2015;17(1):505. doi:10.1007/s11906-014-0505-1
39. Mahmood S, Shah KU, Khan TM, et al. Non-pharmacological management of hypertension: in the light of current research. Ir J Med Sci. 2019;188(2):437–452. doi:10.1007/s11845-018-1889-8
40. Shen Y, Chang C, Zhang J, Jiang Y, Ni B, Wang Y. Prevalence and risk factors associated with hypertension and prehypertension in a working population at high altitude in China: a cross-sectional study. Environ Health Prev Med. 2017;22(1):19. doi:10.1186/s12199-017-0634-7
41. Chen C, Yuan Z. Prevalence and risk factors for prehypertension and hypertension among adults in Central China from 2000–2011. Clin Exp Hypertens. 2018;40(8):734–743. doi:10.1080/10641963.2018.1431252
42. Hashemi R, Rahimlou M, Baghdadian S, Manafi M. Investigating the effect of DASH diet on blood pressure of patients with type 2 diabetes and prehypertension: randomized clinical trial. Diabetes Metab Syndr. 2019;13(1):1–4. doi:10.1016/j.dsx.2018.06.014
43. Tuso P. Strategies to increase physical activity. Perm J. 2015;19(4):84–88. doi:10.7812/TPP/14-242
44. Chen X, Liu Y, Sun X, et al. Comparison of body mass index, waist circumference, conicity index, and waist-to-height ratio for predicting incidence of hypertension: the rural Chinese cohort study. J Hum Hypertens. 2018;32(3):228–235. doi:10.1038/s41371-018-0033-6
 © 2022 The Author(s). This work is published and licensed by Dove Medical Press Limited. The full terms of this license are available at https://www.dovepress.com/terms.php and incorporate the Creative Commons Attribution - Non Commercial (unported, v3.0) License.
By accessing the work you hereby accept the Terms. Non-commercial uses of the work are permitted without any further permission from Dove Medical Press Limited, provided the work is properly attributed. For permission for commercial use of this work, please see paragraphs 4.2 and 5 of our Terms.
© 2022 The Author(s). This work is published and licensed by Dove Medical Press Limited. The full terms of this license are available at https://www.dovepress.com/terms.php and incorporate the Creative Commons Attribution - Non Commercial (unported, v3.0) License.
By accessing the work you hereby accept the Terms. Non-commercial uses of the work are permitted without any further permission from Dove Medical Press Limited, provided the work is properly attributed. For permission for commercial use of this work, please see paragraphs 4.2 and 5 of our Terms.