")
Back to Journals » Pharmacogenomics and Personalized Medicine » Volume 14
Development and Validation of a Prognostic N6-Methyladenosine-Related Immune Gene Signature for Lung Adenocarcinoma
Authors Zhang L , Luo Y, Cheng T, Chen J, Yang H, Wen X, Jiang Z, Li H, Pan C
Received 9 August 2021
Accepted for publication 23 November 2021
Published 30 November 2021 Volume 2021:14 Pages 1549—1563
DOI https://doi.org/10.2147/PGPM.S332683
Checked for plagiarism Yes
Review by Single anonymous peer review
Peer reviewer comments 2
Editor who approved publication: Dr Martin H Bluth
Lemeng Zhang, Yongzhong Luo, Tianli Cheng, Jianhua Chen, Hua Yang, Xiaoping Wen, Zhou Jiang, Haitao Li, Changqie Pan
Thoracic Medicine Department 1, Hunan Cancer Hospital, Changsha, Hunan Province, 410013, People’s Republic of China
Correspondence: Yongzhong Luo Tel/Fax +86-731-89762220
Email [email protected]
Purpose: The prognostic value of an N6-methyladenosine (m6A) methylation-related immune gene signature for lung adenocarcinoma (LUAD) was investigated.
Patients and Methods: Gene expression and clinical phenotype data of LUAD patients were downloaded from The Cancer Genome Atlas database. A list of immune-related genes was retrieved from the InnateDB database. Correlation analysis, survival analysis, and univariate and multivariate Cox regression analyses were performed. After allocating patients into a high-risk or a low-risk group, the corresponding survival rates, immune microenvironment, expression of immune checkpoint genes, and modulation of Kyoto Encyclopedia of Genes and Genomes pathways were examined. Finally, the expression levels of prognostic biomarkers were assessed in the GSE126044 dataset.
Results: Seven m6A-related immune prognostic genes were identified. High expression of PSMD10P1, DIDO1, ABCA5, and CIITA was associated with high survival rates, while that of PRC1, ZWILCH, and ANLN was associated with low survival rates. The high- and low-risk groups showed significant differences in terms of the abundance of six tumor-infiltrating immune cell types and expression of 12 immune checkpoint genes. The risk group acted as an independent prognostic factor (hazard ratio = 0.398, 95% confidence interval = 0.217– 0.729, P = 0.003). Finally, the developed nomogram could predict most efficiently the 1-, 2-, and 3-year survival probability of LUAD patients with a C-index of 0.833.
Conclusion: A seven-gene risk signature, associated with the immune microenvironment in LUAD, showed independent prognostic value.
Keywords: lung adenocarcinoma, N6-methyladenosine methylation, immune-related genes, immune microenvironment, prognostic signature
Introduction
Lung cancer poses a serious threat to human health: in fact, according to global cancer statistics, this cancer type was associated with 2.09 million new cases and 1.76 million deaths worldwide in 2018.1 Lung adenocarcinoma (LUAD) accounts for approximately 50% of all lung cancer cases2 and entails a 5-year survival rate of less than 15%.3 Recently, the development of immune checkpoint inhibitors has led to a breakthrough in LUAD immunotherapy, improving long-term survival in patients with advanced-stage disease; however, tremendous clinical challenges, such as the fact that only a small proportion of patients benefit from immunotherapy,4,5 must still be overcome.
N6-methyladenosine (m6A) methylation is the most conserved and frequent internal modification of nucleic acids, and is primarily found in mRNAs and long noncoding RNAs. m6A methylation is involved in multiple fundamental cellular functions, such as 3′-end and microRNA processing, pre-mRNA splicing, and translation regulation.6 m6A methylation is dynamic and reversible: it is catalyzed by m6A methyltransferases (also called “writers”) and reverted by demethylases (also called “erasers”), whereas m6A-binding proteins (also called “readers”) are responsible for recognizing m6A-methylated sites.7 The genes coding for these m6A methylation-related enzymes participate in the genesis and progression of various cancer types. For example, the m6A methyltransferase METTL3 accelerates bladder cancer formation and progression by promoting the maturation of pri-microRNA-221/222.8 Similarly, the m6A reader YTHDF2 contributes to tumor metastasis and the stem cell phenotype in liver cancer by mediating the expression of the pluripotency factor Oct4.9 Moreover, m6A methylation regulators have been reported to be involved in the malignant progression of LUAD; consistently, an m6A methylation regulator-based prognostic signature not only showed a strong association with clinicopathological features but also acted as an independent prognostic factor in LUAD.10
In addition, m6A methylation participates in the regulation of the immune response and the tumor immune microenvironment (TME).11 In particular, inhibition of the m6A writers METTL3/METTL14 has been shown to enhance the response to anti-PD-1 therapy. In fact, tumors characterized by the loss of METTL3/METTL14 expression showed elevated cytotoxic CD8+ T-cell infiltration and increased secretion of the chemokines CXCL9/10 and interferon-γ in the TME.12 Furthermore, overexpression of the m6A eraser ALKBH5 sensitized the tumors to anti-PD-1 therapy by mediating the accumulation of lactate and suppressive immune cells (ie, myeloid-derived suppressor cells and tumor-infiltrating T regulatory cells [Tregs]) in the TME.13 Nevertheless, the role of m6A methylation-related immune genes in LUAD has yet not been elucidated.
Based on the gene expression and clinical phenotype data of LUAD patients included in The Cancer Genome Atlas (TCGA) database, we identified several immune prognostic signature genes whose expression was correlated with that of multiple m6A-related genes. These genes were used to establish a prognostic risk signature, whose correlations with clinical factors, the immune microenvironment, response to immune checkpoint inhibitors, and prognosis were further investigated to construct a risk model (Figure 1). The results of this study thus highlight novel potential therapeutic targets and prognostic markers for LUAD treatment.
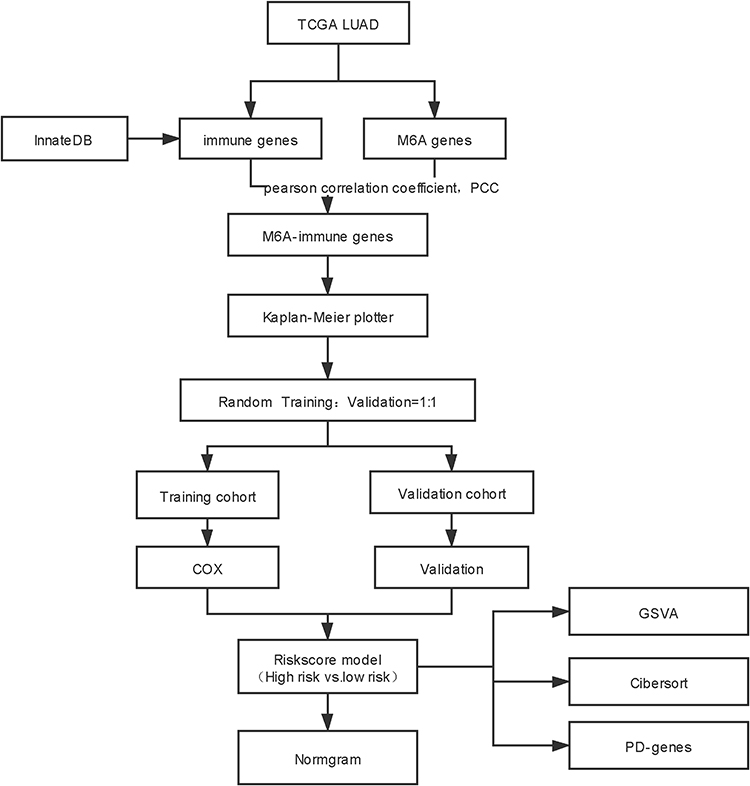 |
Figure 1 Flow chart. |
Materials and Methods
Data Collection and Processing
RNA sequencing (RNA-seq) data in FPKM format and clinical phenotype data of LUAD in TCGA database (TCGA-LUAD) were downloaded from UCSC Xena browser (https://gdc.xenahubs.net). The data of a total of 572 samples were obtained, including those of 59 control cases and 513 LUAD cases (Table 1). Genes were annotated to convert each Ensembl_ID into the corresponding Symbol_ID based on the reference genome hg38 (V 22) from the GENCODE database.14 The mean expression value was used as the reference expression value when referring multiple Ensembl_IDs to the same Symbol_ID. Genes with an expression value of 0 in more than 80% of the samples were excluded from the analysis. The data from TCGA is publicly available. Thus, the present study was exempted from the approval of local ethics committees. The current research follows the TCGA data access policies and publication guidelines. All data submitted to the TCGA database has been ethically approved. The TCGA data citation guidelines and licenses have been followed.
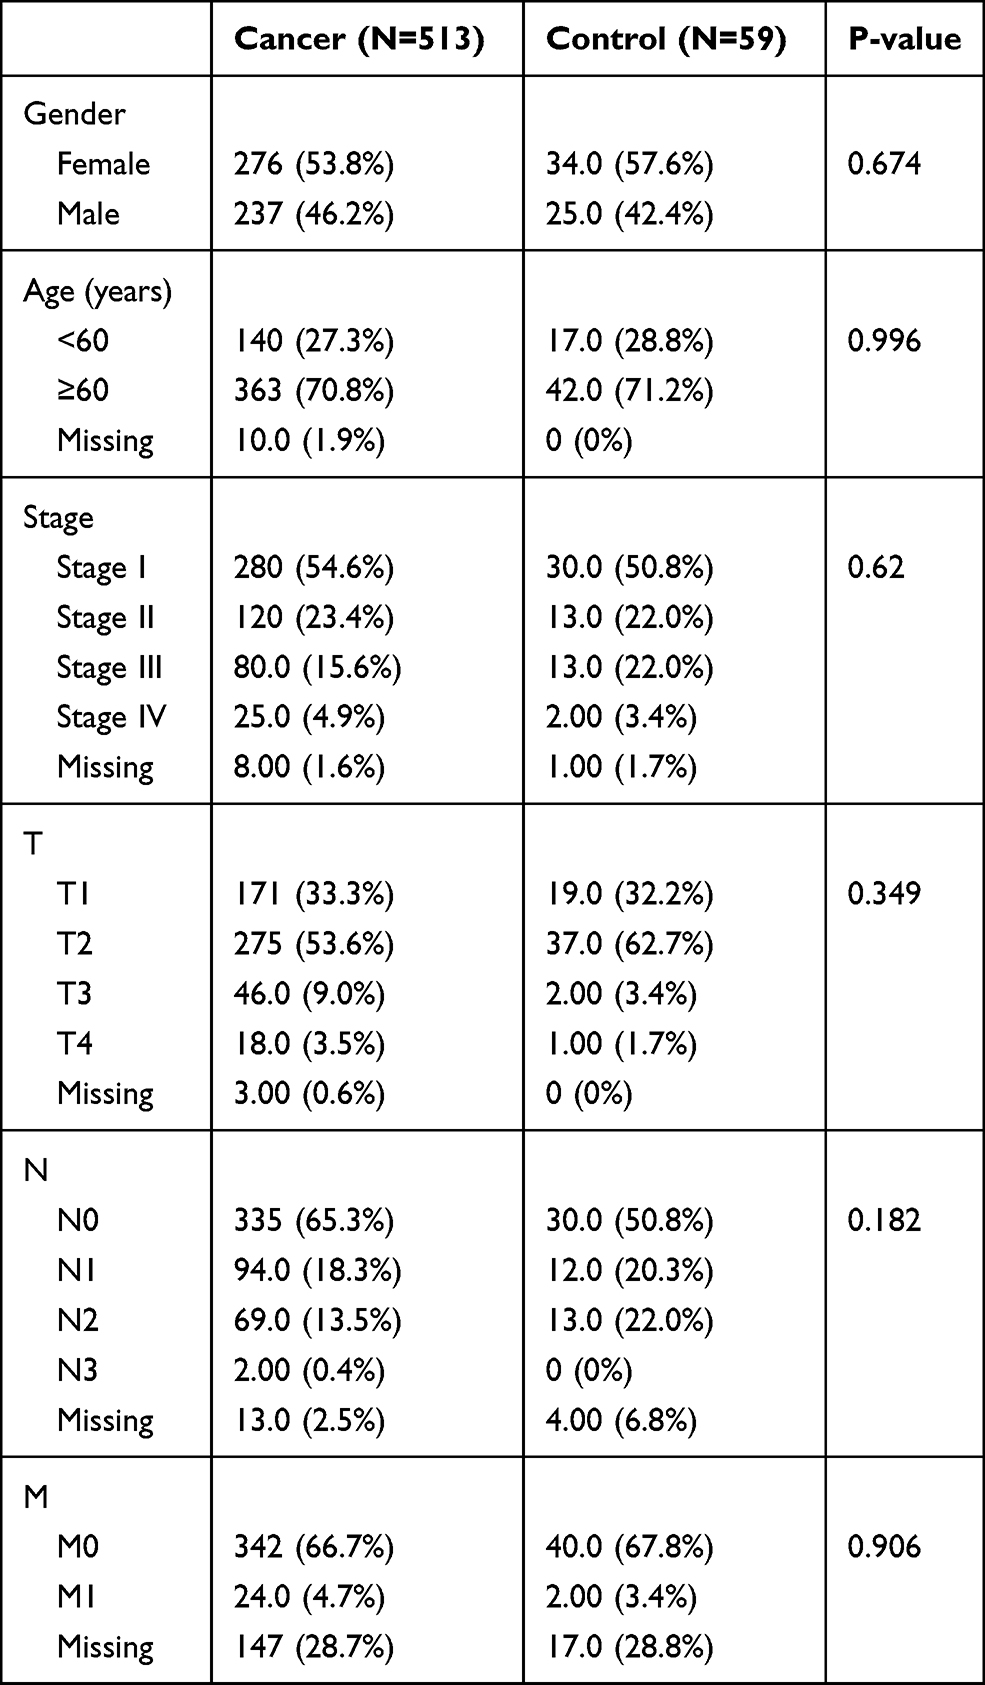 |
Table 1 Clinical Characteristics of All Subjects Included in the Study |
Screening of m6A-Associated Immune Genes
The expression values of m6A methylation genes (ie, the genes coding for the methyltransferases METTL3, METTL14, METTL15, WTAP, VIRMA, RBM15, RBM15B, KIAA1429, and ZC3H13; the demethylases FTO and ALKBH5; and the m6A effectors RBMX, YTHDC1, YTHDC2, IGF2BP1, IGF2BP2, IGF2BP3, YTHDF1, YTHDF2, YTHDF3, HNRNPA2B1, and HNRNPC) were obtained from the TCGA-LUAD tumor sample dataset. The list of immune genes available in ImmPort was downloaded from InnateDB;15 the expression values of the genes included therein were similarly retrieved from the TCGA-LUAD tumor sample dataset. Pearson correlation coefficients were calculated by correlation analysis using the cor test in R to screen for m6A-associated immune genes considering the following cut-off values: |correlation coefficient| > 0.5 and P < 0.001.
Evaluation of the Prognostic Value of m6A-Associated Immune Genes
Samples relative to patients with a survival time of less than 30 days were removed, and the remaining 503 samples were retained (Table 2). According to the median expression value of each m6A-associated immune gene, patients were divided into high-expression and low-expression groups, in order to carry out stratified survival analysis via Log rank test and the Kaplan–Meier (KM) method. In addition, patients were randomly separated into a training set (n = 251) and a validation set (n = 252). In the training set, univariate Cox regression analysis was performed for genes displaying P < 0.05 in the KM survival analysis to further evaluate their prognostic value, and genes exhibiting P < 0.05 in the Log rank test were included in the subsequent multivariate Cox regression analysis. Genes with an independent prognostic value were revealed based on a log-rank P value lower than 0.05, and used for the subsequent analyses.
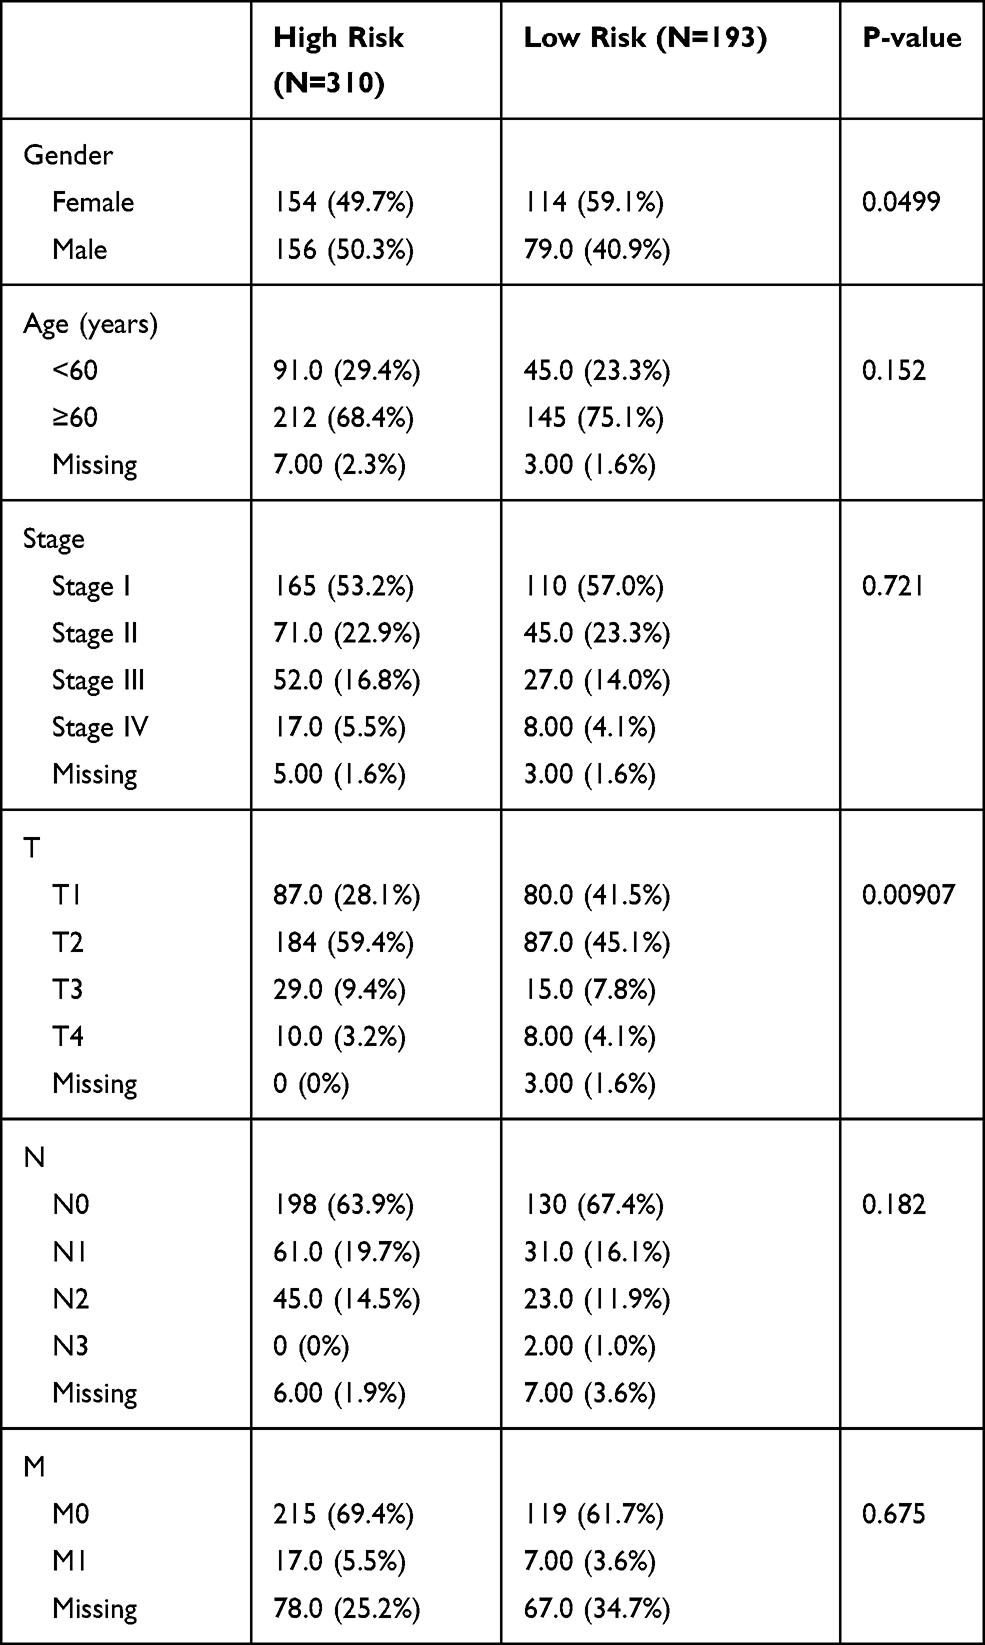 |
Table 2 Clinical Characteristics of Subjects Included in the Prognosis Study |
Gene Set Enrichment Analysis
Genes that were significantly related to prognosis as determined by univariate Cox regression analysis were used for enrichment analysis. The R package ClusterProfiler version 3.2.1114 was used to perform Kyoto Encyclopedia of Genes and Genomes (KEGG) pathway16 and Gene Ontology (GO) enrichment analyses.17 P < 0.05 was used as the significance threshold.
Construction of a Prognostic Risk Model
In order to evaluate the prognostic value of the selected genes, a prognostic risk model was developed using the following formula:
Risk score = ∑Coef immune genes × Exp immune genes
where Coef represents the β coefficient in multivariate Cox regression, and Exp represents the expression value of each immune gene. After calculating the risk scores, patients were separated into different risk groups, based on which a survival analysis was then performed.
Clinical Characteristics of Patients in the High-Risk and Low-Risk Groups
Differences in the clinical characteristics, including clinical TNM stage, response to treatment, age, and sex, between high-risk and low-risk patients were evaluated using the package ggstatsplot version 0.5.0 in R software, and a chi-square test was used to calculate P values.
Screening of Independent Prognostic Factors
Prognosis-associated factors, including clinical characteristics and risk score, were examined using univariate Cox regression analysis, after which factors characterized by a log-rank P lower than 0.05 were further analyzed by multivariate Cox regression analysis. Next, factors with a log-rank P lower than 0.05 were selected as independent prognostic factors. A nomogram was established based on such independent prognostic factors, and its predictive performance was evaluated through the calculation of the C-index.
Status of the Immune Microenvironment and Expression of Immune Checkpoint Genes in the High-Risk and Low-Risk Groups
The abundance of 22 tumor-infiltrating immune cell types [ie, naïve B cells, memory B cells, plasma cells, CD8+ T cells, naïve CD4+ T cells, resting memory CD4+ T cells, activated memory CD4+ T cells, follicular helper T cells, Tregs, gamma delta T cells, resting natural killer (NK) cells, activated NK cells, monocytes, M0 macrophages, M1 macrophages, M2 macrophages, resting dendritic cells, activated dendritic cells, resting mast cells, activated mast cells, eosinophils, and neutrophils] in samples from high-risk and low-risk patients was evaluated using the CIBERSORT algorithm with the following parameters: number of permutation = 100 and quantile normalization of input mixture = false. P < 0.05 was used as the threshold for statistical significance to indicate immune cell types exhibiting significant differences in infiltrating abundance between the two groups. In addition, differences in the expression levels of immune checkpoint genes, including PD-1 (PDCD1), PD-L1 (CD274), CTLA-4, CD278 (ICOS), Tim-3 (HAVCR2), LAG3, CD73, CD47, BTLA, TIGIT, MYD-1 (SIRPA), OX40 (TNFRSF4), 4–1BB (TNFRSF9), and B7-H4 (VTCN1), were also examined.
Finally, gene set variation analysis (GSVA)18 was carried out to investigate differences in the activity of the KEGG pathways between the high-risk and the low-risk group. In brief, based on the enrichment background (c2.cp.kegg.v7.2.symbols.gmt) reported in the MSigDB database version 7.2, enrichment scores of the KEGG pathways were calculated for all samples to obtain a scoring matrix using the R package GSVA version 1.36.2; next, differential analysis for the activity status of each KEGG pathway in the high-risk and low-risk groups was carried out using the R package Limma. P < 0.05 was used as the threshold for statistical significance.
Validation of m6A-Associated Immune Genes in the GEO Database
The dataset GSE116959, including gene expression data from 57 LUAD samples and 11 healthy peritumoral lung tissues, was downloaded from the GEO database. Gene expression data were generated on a GPL17077 Agilent-039494 SurePrint G3 Human GE v2 8×60K Microarray 039381 (Probe Name version). The original expression matrix and corresponding probe annotation information were extracted after standardized processing. After converting probes into gene symbols, gene expression values were defined as the average expression values of different probes in case the latter mapped to the same gene.
The expression values of m6A methylation-related genes were obtained from the GSE116959 dataset. The list of immune genes available in ImmPort was downloaded from InnateDB.15 Pearson correlation coefficients were calculated by correlation analysis using the cor test in R to screen for m6A-associated immune genes considering the following cut-off values: |correlation coefficient| > 0.5 and P < 0.001.
Results
Screening of m6A-Related Immune Prognostic Genes
After data preprocessing, expression data relative to 3879 immune genes were obtained. A total of 856 co-expressing pairs with |correlation coefficient| > 0.6 and P < 0.001 were screened by correlation analysis, resulting in the identification of 441 immune genes and 21 m6A-related genes. Survival analysis was then carried out for these 441 immune genes, out of which 90 were found to correlate with the survival of LUAD patients (Table S1). Subsequently, these 90 immune genes were analyzed by univariate Cox regression, and 66 genes were found to be associated with the prognosis of LUAD patients (Table S2). Further multivariate Cox regression analysis showed that 7 out of these 90 immune genes, namely those encoding protein regulator of cytokinesis 1 (PRC1), anillin actin binding protein (ANLN), death inducer-obliterator 1 (DIDO1), proteasome 26S subunit, non-ATPase, 10 pseudogene 1 (PSMD10P1), class II major histocompatibility complex transactivator (CIITA), zwilch kinetochore protein (ZWILCH), and ATP binding cassette subfamily A member 5 (ABCA5), possessed independent prognostic value for LUAD patients (Figure 2A, Table S3).
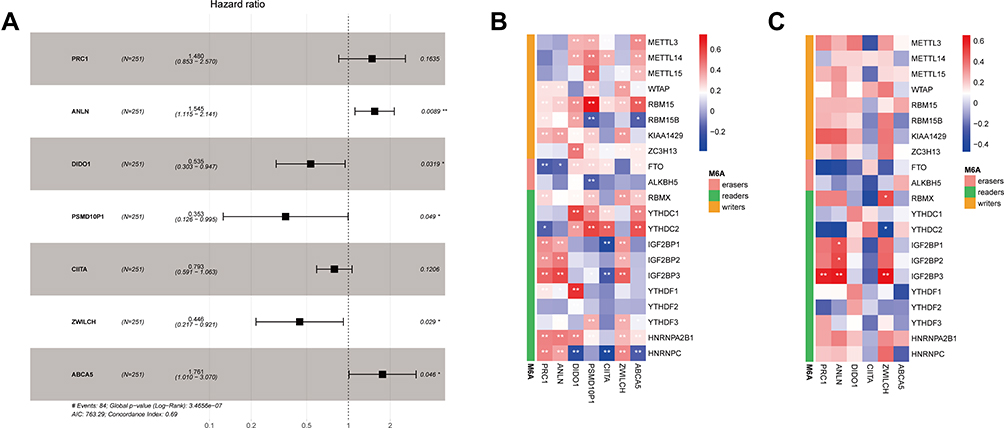 |
Figure 2 Identification of seven m6A-related immune prognostic genes. (A) Forest plot showing the results of multivariate Cox regression analysis for the seven reported genes; (B) correlation heatmap showing the correlations between the expression levels of seven immune genes and those of m6A-related genes based on data from The Cancer Genome Atlas database; (C) correlation heatmap showing the correlations between the expression levels of six immune genes and those of m6A-related genes based on data from the GEO database. Negative correlations are depicted in blue while positive correlations are depicted in red; *Indicates statistical significance P<0.05; **Indicates statistical significance P<0.01. |
A correlation heatmap showed that the expression of these seven immune prognostic genes was correlated with that of m6A-related genes (Figure 2B). In particular, DIDO1 expression showed strong positive correlation with that of the m6A reader-encoding genes YTHDC1 and YTHDF1 but was negatively correlated with that of the m6A reader-encoding gene HNRNPC. Also, PSMD10P1 expression was positively correlated with that of the m6A writer-encoding gene RBM15. We performed a similar analysis in the GEO database, from which 3934 m6A-related immune genes were obtained. After correlation analysis, a total of 117 co-expressing pairs including 111 immune genes and 17 m6A-related genes were obtained. The seven m6A-related immune prognostic genes identified in TCGA database matched with 6 (ie, PRC1, ANLN, DIDO1, CIITA, ZWILCH, and ABCA5) of the abovementioned 117 genes (Figure 2C).
Survival analysis for these seven genes showed that patients displaying high expression of PSMD10P1, DIDO1, ABCA5, and CIITA were characterized by longer survival times. Conversely, high expression of PRC1, ZWILCH, and ANLN were associated with lower survival rates (Figure 3).
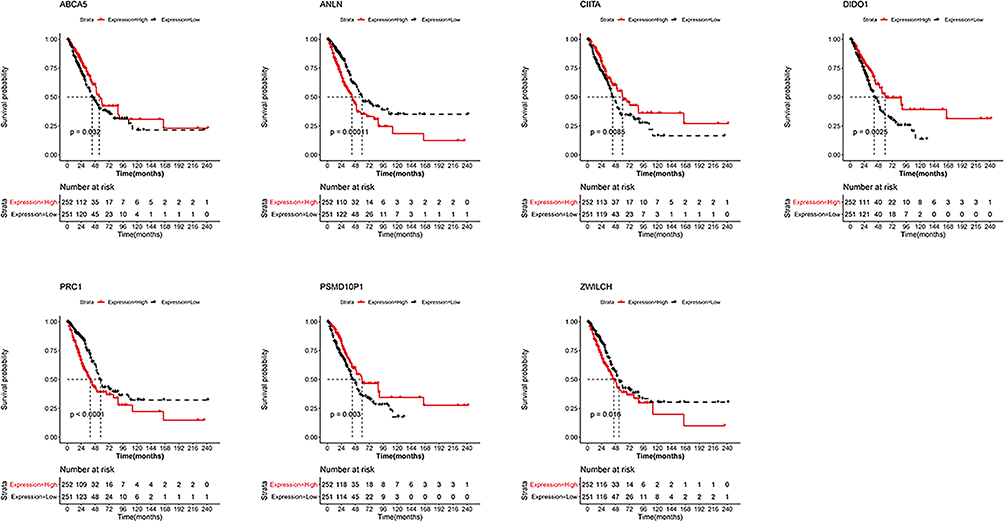 |
Figure 3 Survival analysis of seven m6A-related immune prognostic genes. Kaplan–Meier survival curves showing the prognostic value of PSMD10P1, DIDO1, ABCA5, CIITA, PRC1, ZWILCH, and ANLN. |
Results of Enrichment Analysis
A total of 66 prognostic genes were used for enrichment analysis. Considering a threshold of P < 0.05, genes involved in 12 KEGG pathways, 123 biological processes, 32 cellular components, and 12 molecular functions were found to be enriched in the test dataset; only the top 10 enriched categories are shown in Figure 4. These genes were mainly implied in pathways related to the cell cycle and oocyte meiosis (Figure 4A). Moreover, GO analysis revealed that these genes were mainly involved in organelle fission (Figure 4B), chromosome condensation (Figure 4C), and DNA polymerase binding (Figure 4D).
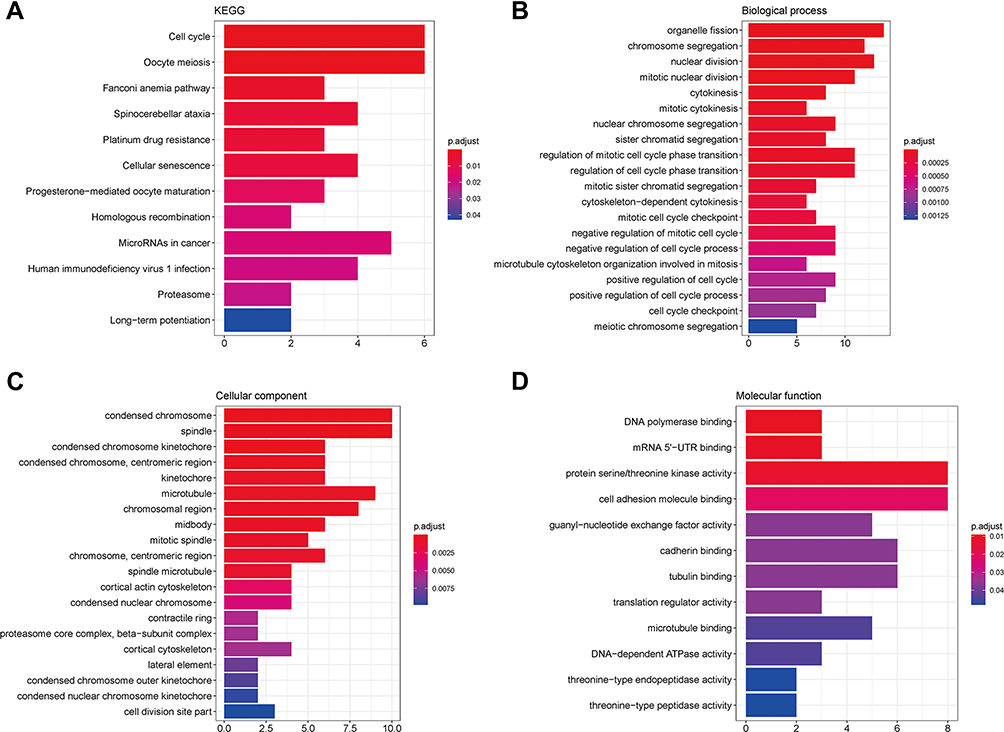 |
Figure 4 KEGG and GO enrichment analyses. (A) KEGG results; (B) biological process; (C) cellular component; (D) molecular function. |
Construction of a Prognostic Risk Signature
The seven aforementioned genes were used to establish a prognostic risk model, according to which risk scores were calculated. For each dataset, patients were divided into a high-risk and a low-risk group based on their median risk scores; survival analysis was then performed. In the training set, patients in the high-risk group had poorer prognosis compared to that of patients in the low-risk group (Figure 5A). Similar results were observed in the validation set (Figure 5B) and the whole set (Figure 5C).
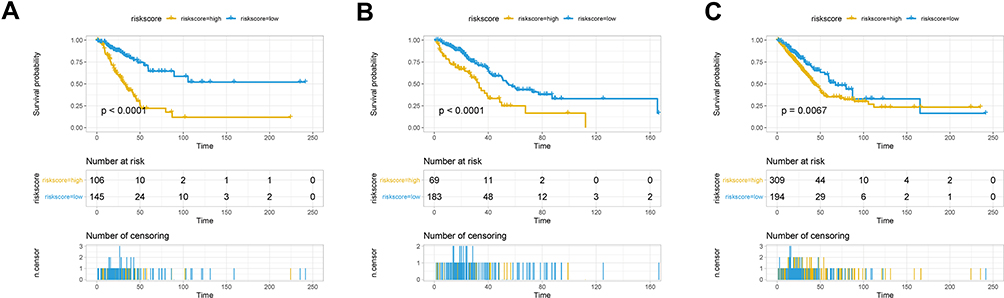 |
Figure 5 Survival analysis in the high-risk and low-risk groups. Survival curves showing the prognostic value of the risk score calculated by the prognostic risk model in the training set (A), validation set (B), and whole set (C). |
Clinical Factors in the High-Risk and Low-Risk Groups
In order to investigate the association between the clinical factors and the risk score, differences in clinical factors between the high-risk and the low-risk group were examined (Figure 6). Age (Figure 6A, P = 0.074), tumor stage (Figure 6C, P = 0.087), pathologic T (Figure 6D, P = 0.566), pathologic N (Figure 6E, P = 0.854), and pathologic M (Figure 6F, P = 0.262) did not differ significantly between the high-risk and the low-risk group. However, the high-risk group had a higher proportion of male patients than the low-risk group (Figures 6B, 56% vs 38%, P = 0.012). In addition, the low-risk group included more patients that successfully responded to treatment than the high-risk group (Figures 6G, 70% vs 55%, P = 0.027). This might provide a partial explanation for the poor prognosis observed in the high-risk group.
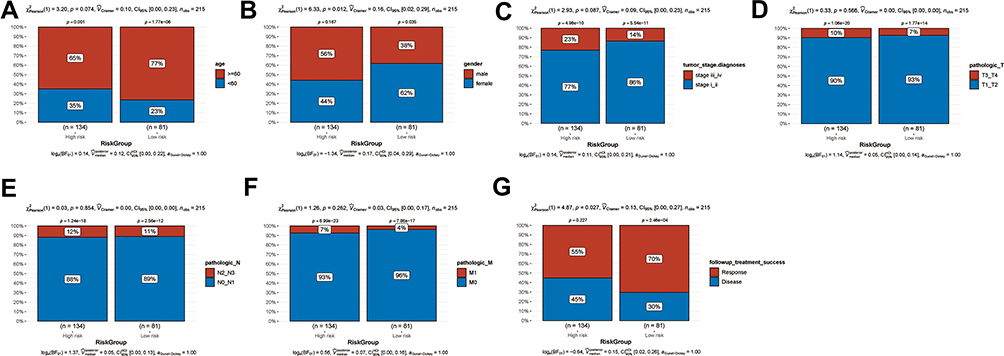 |
Figure 6 Clinical factors in the high-risk and low-risk groups. Histogram showing the proportion of patients in the high-risk and low-risk groups exhibiting differences in age (A), sex (B), tumor stage (C), pathologic T (D), pathologic N (E), pathologic M (F), and successful response to treatment (G). |
We further evaluated differences in the expression of the seven prognostic genes included in the prognostic risk model between patients responding and not responding to anti-PD-1 treatment based on data from the GEO dataset GSE126044. With the exception of PSMD10P1, the expression of all prognostic genes was detected in the GSE126044 dataset. Significantly higher expression of CIITA and significantly lower expression of ZWILCH was observed in patients who responded to anti-PD-1 treatment than in those who did not. Moreover, decreased expression of ANLN, ABCA5, and PRC1 was observed in patients who responded to anti-PD-1 treatment, but these differences were not statistically significant (Figure 7).
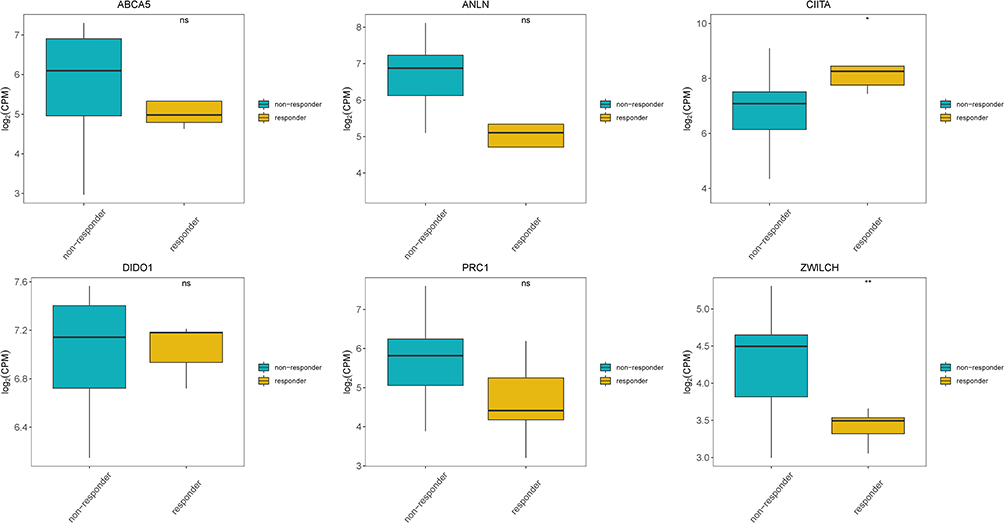 |
Figure 7 Expression of prognostic genes in responders and non-responders to anti-PD-1 treatment in the GSE126044 dataset. *Indicates statistical significance P<0.05; **Indicates statistical significance P<0.01. |
Evaluation of the Independent Prognostic Value of the Prognostic Risk Model
Univariate Cox regression analysis showed that follow-up treatment success, risk group, pathologic N, and pathologic T were associated with the prognosis of LUAD patients. These factors were included in a multivariate Cox regression analysis, and the results indicated that follow-up treatment success [hazard ratio (HR) = 6.097, 95% confidence interval (CI) = 3.513–10.584, P < 0.0001), risk group (HR = 0.398, 95% CI = 0.217–0.729, P = 0.003], and pathologic N (HR = 2.059, 95% CI = 1.137–3.728, P = 0.017) were independent prognostic factors (Figure 8A, Table 3).
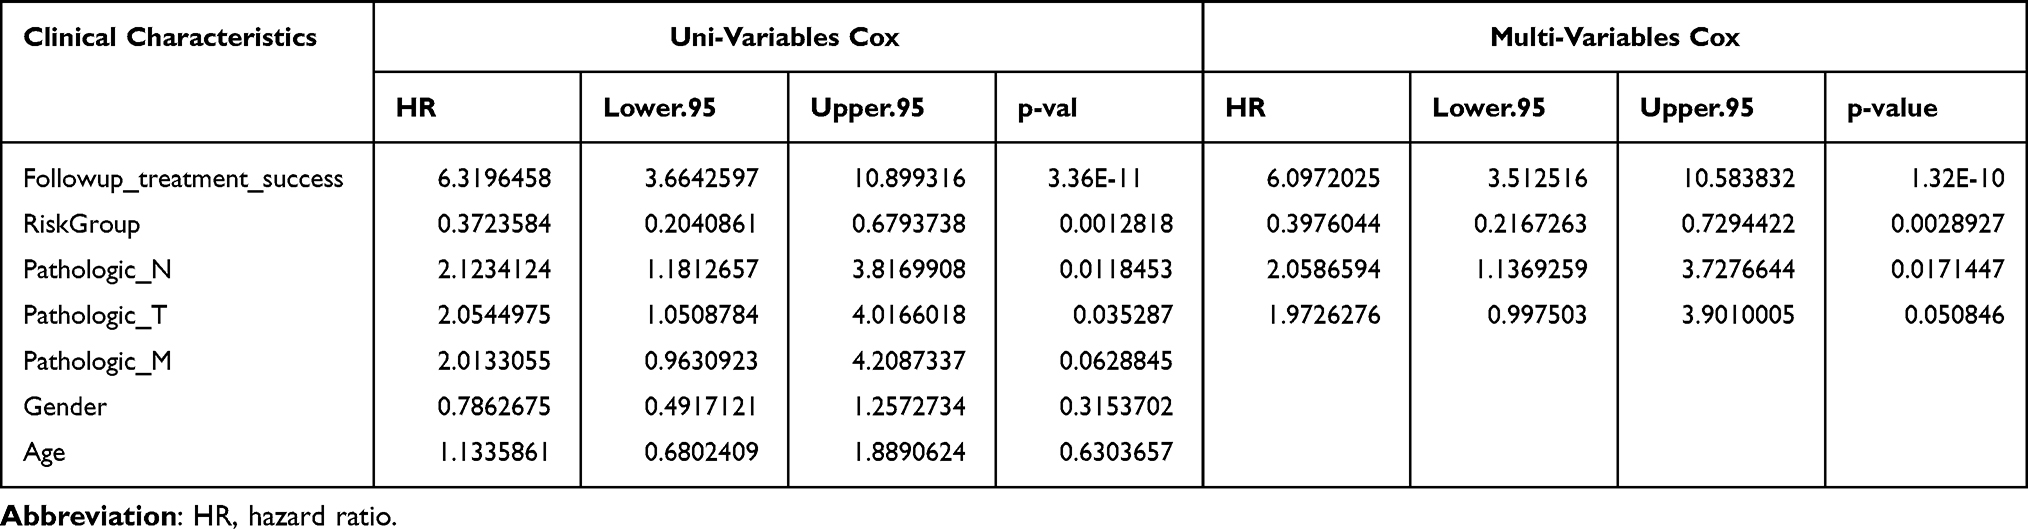 |
Table 3 Univariate and Multivariate Cox Regression Analyses for Clinical Factors |
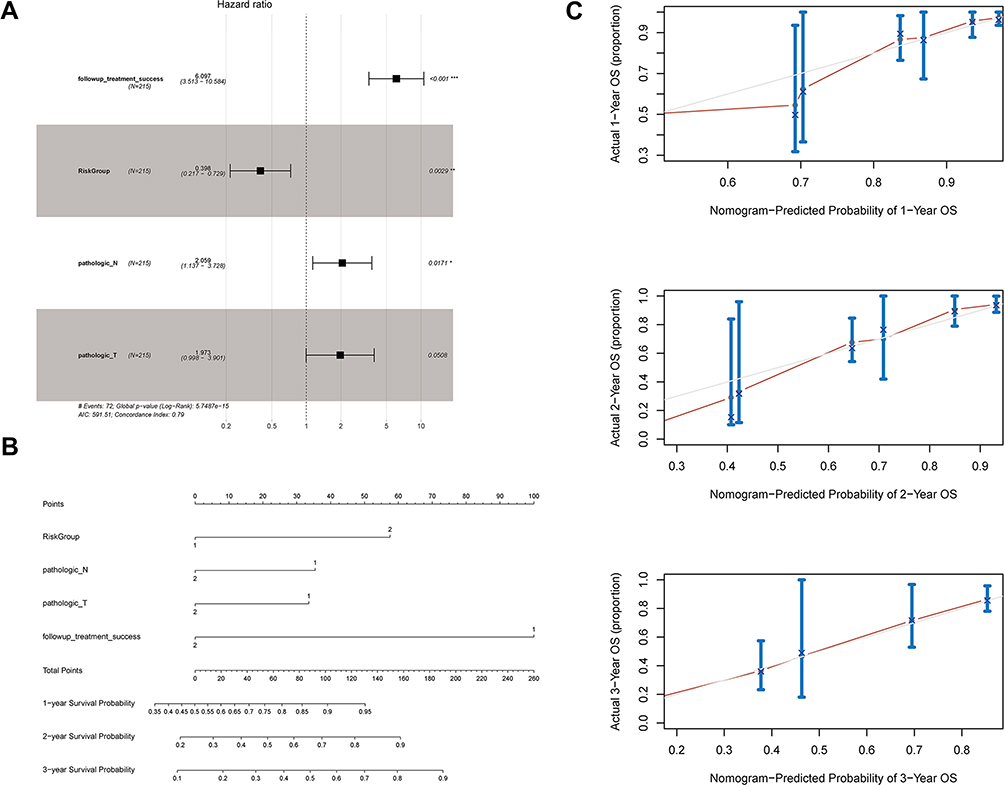 |
Figure 8 Evaluation of the prognostic risk model. (A) Forest plot showing the results of multivariate Cox regression analysis for clinical factors and risk groups; (B) nomogram; and (C) calibration curves for the prediction of 1-, 2-, and 3-year overall survival of LUAD patients. *Indicates statistical significance P<0.05; **Indicates statistical significance P<0.01. |
These four prognostic factors were used to establish a nomogram, which showed optimal predictive performance for the 1-, 2-, and 3-year survival probability of LUAD patients with a C-index of 0.833 (Figure 8B, Table 4). The calibration curves for 1-, 2-, and 3-year overall survival indicated that the prediction was consistent with the actual results (Figure 8C).
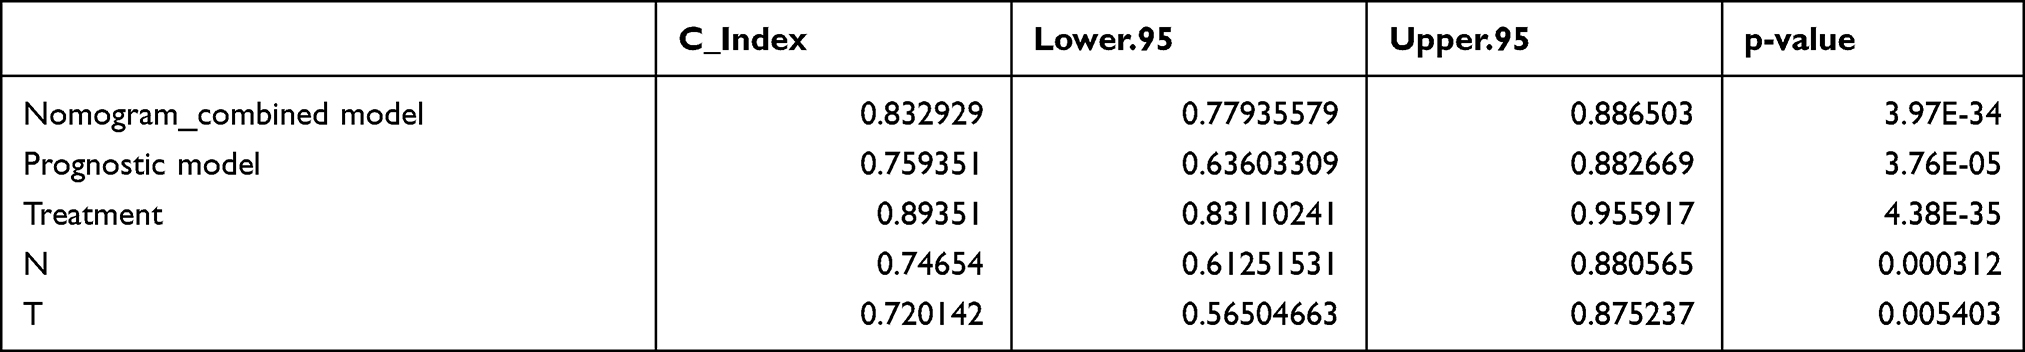 |
Table 4 C-Index for Nomogram Model and Prognostic Factors |
Differences in Immune Microenvironment and Expression of Immune Checkpoint Genes Between the High-Risk and the Low-Risk Group
To investigate differences in the immune microenvironment between high-risk and low-risk patients, the abundance of 22 tumor-infiltrating immune cell types was evaluated using the CIBERSORT algorithm. The results showed that the abundances of six infiltrating immune cell types differed significantly between the high-risk and the low-risk groups. In particular, the high-risk group was characterized by a high abundance of infiltrating naïve B cells, plasma cells, activated dendritic cells, and eosinophils, while the low-risk group displayed a high abundance of infiltrating monocytes and M1 macrophages (Figure 9A). Additionally, the expression of various immune checkpoint genes differed significantly between the two risk groups (Figure 9B). In fact, most of the immune checkpoint genes, including BTLA, CD47, CD274, CTLA4, HAVCR2, ICOS, LAG3, PDCD1, SIRPA, TIGIT, TNFRSF4, and TNFRSF9, showed decreased expression in the high-risk group relative to that in the low-risk group.
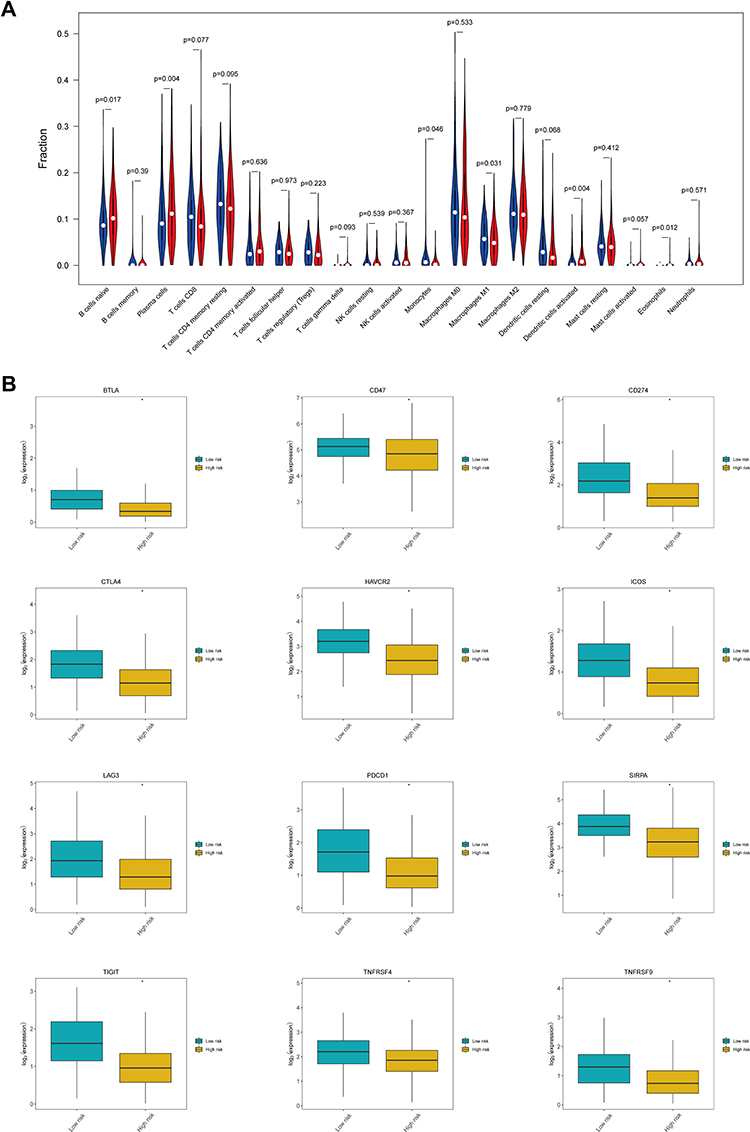 |
Figure 9 Status of the immune microenvironment and expression of immune checkpoint genes in the high-risk and low-risk groups. (A) Violin plot showing differences in the abundance of tumor-infiltrating immune cell types between the high-risk and the low-risk groups. The high-risk group is depicted in red and the low-risk group is depicted in blue. (B) Box plots showing differences in the expression of immune checkpoint genes between the high-risk and the low-risk groups. *Indicates statistical significance P<0.05. |
Differences in KEGG Pathway Enrichment Between the High-Risk and the Low-Risk Group
GSVA was performed to investigate differences in the enrichment for KEGG pathways between the two risk groups, and 47 KEGG pathways characterized by a significantly different activation status between the two groups were identified. Most of these KEGG pathways (45 out of 47), such as the Notch/Wnt/MTOR/MAPK signaling pathways and various metabolic pathways, were upregulated in the high-risk group. Conversely, the pathways “neuroactive ligand receptor interaction” and “primary immunodeficiency” were downregulated in the high-risk group (Figure 10, Table S4).
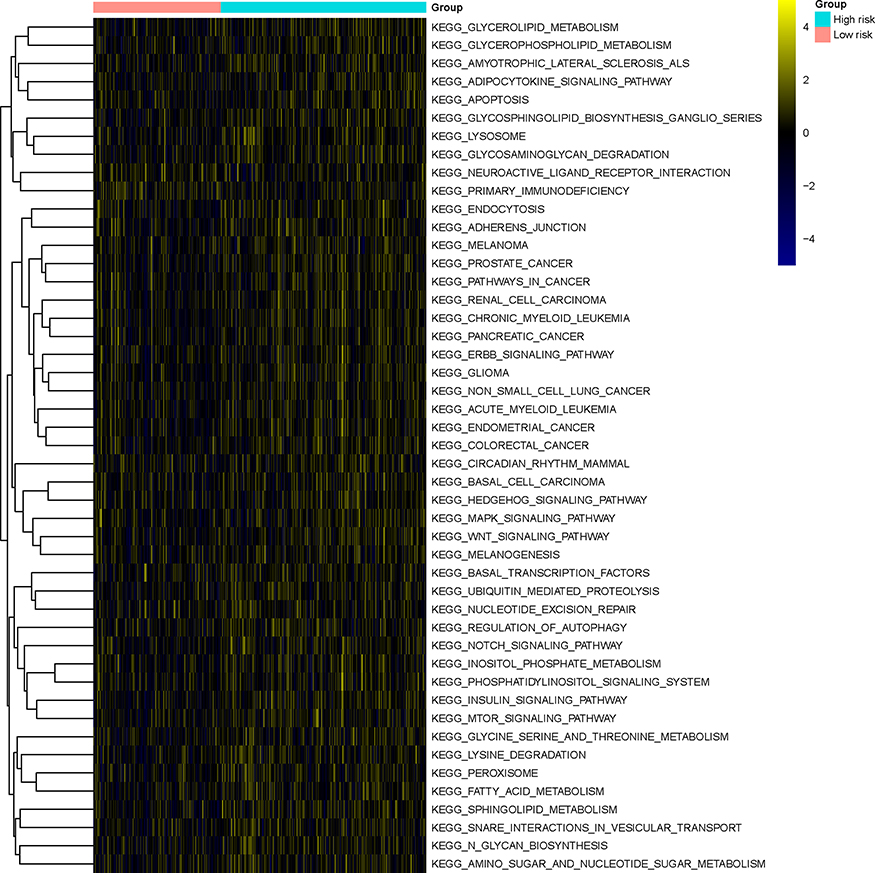 |
Figure 10 Gene set variation analysis. Heatmap showing the KEGG pathways characterized by significant differences in their activation status between the high-risk and the low-risk groups. |
Discussion
m6A methylation-related genes have been reported to participate in the onset and progression of various tumors.19 They have also been reported to regulate the TME.20 In this study, we identified seven m6A-related immune prognostic genes (ie, PSMD10P1, DIDO1, ABCA5, CIITA, PRC1, ZWILCH, and ANLN) for LUAD based on their expression data in TCGA. High expression of PSMD10P1, DIDO1, ABCA5, and CIITA was associated with high survival rates, while high expression of PRC1, ZWILCH, and ANLN was associated with low survival rates in LUAD patients. The observed differences in the immune microenvironment and immune gene expression likely affected such prognosis. Therefore, the seven m6A-related immune prognostic genes identified in this study could serve as independent predictors of LUAD prognosis.
DIDO1 has been found to be involved in the progression and metastasis of many cancers, such as melanoma21 and esophageal squamous cell carcinoma.22 Indeed, its expression is significantly correlated with the invasion depth of tumors. On the other hand, CIITA might drive the expression of MHC class II molecules which could stimulate tumor-specific CD4+ T helper cells.23 MHC class II molecules are necessary elements for cell recognition by CD4+ T helper cells, and are generally not expressed in solid tumors. In turn, CD4+ T helper cells play a fundamental role in activating and sustaining the proliferation of immune effector cells that are required for eliminating tumor cells.24 Therefore, such anti-tumor effect might be enhanced by inducing CIITA expression in tumor cells. PRC1 encodes polycomb repressive complex 1, an important epigenetic regulator that also functions as a transcriptional activator during the onset of diseases and cancers.24 In particular, Su et al observed that PRC1-driven tumor metastasis in double-negative prostate cancer occurs via coordinated modulation of stemness, immune suppression, and neoangiogenesis.25 Moreover, high expression of ANLN in LUAD may promote tumor metastasis by triggering epithelial–mesenchymal transformation, since patients displaying elevated ANLN expression present with metastasis more frequently than patients with low ANLN expression.26 Long et al suggested the predictive value of ANLN for both LUAD diagnosis and prognosis.27 Considering their important functional roles, we suggest that these genes can be considered novel therapeutic targets and potential prognostic biomarkers of LUAD. In addition, ABCA subfamily members are involved in lipid metabolism. In the mouse macrophage cell line RAW264.7, the expression of Abca5 can be strongly induced by the presence of cholesterol.28 In addition, increased expression of ABCA5 was found in the hippocampal neurons and amygdala neurons of patients with Alzheimer’s disease.29 However, a correlation between ABCA5 expression and LUAD has not been previously reported. Using these seven genes, we constructed a prognostic risk model and distinguished LUAD patients into groups based on their risk score. Patients with high risk scores showed worse outcomes compared to those of patients with low risk scores. These results confirmed the prognostic value of this gene-based risk model.
In addition, we further investigated the potential reasons for the poor survival outcome of high-risk patients by comparing clinical factors, the state of the immune microenvironment, and the expression of immune checkpoint genes between high-risk and low-risk patients. The overall survival of patients in the high-risk group was shorter than that of patients in the low-risk group. This difference prompted us to further explore the possible underlying mechanisms: we found that this phenomenon might depend on differences in the abundance of tumor-infiltrating immune cells and in the expression of immune checkpoint genes. In fact, the high-risk group was characterized by a high abundance of infiltrating naïve B cells, plasma cells, activated dendritic cells, and eosinophils, while the low-risk group displayed a high abundance of infiltrating monocytes and M1 macrophages. The modulation of M1 and M2 macrophage polarization is important for tumor progression.30 In particular, anti-PD-1 treatment has been reported to inhibit lung metastasis by activating M1 macrophages and inhibiting M2 macrophages.30 In addition, dendritic cells play key roles in the TME, as they can trigger the activation of naïve T cells and induce the differentiation of effector cells, and have been found to affect the progression of multiple tumors.31 Moreover, tumor-infiltrating activated or mature dendritic cells are associated with immune activation and recruitment of immune effector cells. Nevertheless, tumor cells can inhibit dendritic cell function or alter the TME to recruit immunosuppressive dendritic cells.32 The majority of immune checkpoint genes, such as CTLA4, CD274 (PD-L1), and PDCD1 (PD-1), showed decreased expression in the high-risk group with respect to that in the low-risk group. Since the immune checkpoint genes CTLA4 and PD-1 are negative regulators of T-cell immune function, their inhibition could activate the immune response.33 Consistently, PD-1 or PD-L1 blockage has been approved as a therapy for multiple advanced tumors, and has been shown to improve the response and clinical outcomes of patients with advanced non-small-cell lung cancer.34 Altogether, the above considerations might partly explain the poor prognosis observed in the high-risk group.
Nevertheless, this study also presents are some limitations. Firstly, this study was based on bioinformatics methods, and the actual clinical significance of the results remains to be verified experimentally. Secondly, as this was a retrospective study, a multi-center and large-sample prospective study will also be necessary in the future. However, this work provides promising directions for future clinical studies.
Conclusion
In conclusion, we identified seven m6A-related immune prognostic genes (PSMD10P1, DIDO1, ABCA5, CIITA, PRC1, ZWILCH, and ANLN) in LUAD. A prognostic risk model based on these seven genes could accurately predict the survival of LUAD patients; in particular, patients with high risk scores exhibited worse outcomes. Moreover, the risk score was associated with successful response to treatment and status of the immune microenvironment, and can thus act as an independent prognostic factor for patients with LUAD. Further clinical studies are necessary to fill existing gaps in the present study and explore the mechanisms underlying the observed phenomena.
Abbreviations
LUAD, lung adenocarcinoma; m6A, N6-methyladenosine; TME, tumor immune microenvironment; TCGA, The Cancer Genome Atlas; RNA-seq, RNA sequencing; KEGG, Kyoto Encyclopedia of Genes and Genomes; GO, Gene Ontology; GSVA, gene set variation analysis; HR, hazard ratio; CI, confidence interval.
Data Sharing Statement
Data sharing is not applicable to this article as no new data were created or analyzed in this study.
Ethics Approval and Informed Consent
This article does not contain any studies with human participants performed by any of the authors.
Author Contributions
All authors made a significant contribution to the work reported, whether that is in the conception, study design, execution, acquisition of data, analysis and interpretation, or in all these areas; took part in drafting, revising or critically reviewing the article; gave final approval of the version to be published; have agreed on the journal to which the article has been submitted; and agree to be accountable for all aspects of the work.
Funding
This study was supported by grants from the National Natural Science Foundation of Hunan Province (2019JJ50353, 2020JJ4418, 2020RC3067), Natural Science Foundation of Hunan Province National Health Commission (B2019091, 20201286), Natural Science Foundation of Changsha Science and Technology Bureau (Kq1901084, Kq1901080, Kq2001024), and Cancer Foundation of China (NCC2018B58), Key Research and Development Project of Hunan Province (2017WK2061); HUI LAN PUBLIC FOUNDATION (HL-HS2020-1); Clinical medical technology innovation guided project (2020SK51112).
Disclosure
The authors report no conflicts of interest in this work.
References
1. Bray F, Ferlay J, Soerjomataram I, Siegel RL, Torre LA, Jemal A. Global cancer statistics 2018: GLOBOCAN estimates of incidence and mortality worldwide for 36 cancers in 185 countries. CA Cancer J Clin. 2018;68(6):394–424. doi:10.3322/caac.21492
2. Hutchinson BD, Shroff GS, Truong MT, Ko JP. Spectrum of lung adenocarcinoma. Semin Ultrasound CT MR. 2019;40(3):255–264. doi:10.1053/j.sult.2018.11.009
3. Denisenko TV, Budkevich IN, Zhivotovsky B. Cell death-based treatment of lung adenocarcinoma. Cell Death Dis. 2018;9(2):117. doi:10.1038/s41419-017-0063-y
4. Slawinski G, Wrona A, Dabrowska-Kugacka A, Raczak G, Lewicka E. Immune checkpoint inhibitors and cardiac toxicity in patients treated for non-small lung cancer: a review. Int J Mol Sci. 2020;21(19):7195. doi:10.3390/ijms21197195
5. Zimmermann S, Peters S, Owinokoko T, Gadgeel SM. Immune checkpoint inhibitors in the management of lung cancer. Am Soc Clin Oncol Educ Book. 2018;38:682–695. doi:10.1200/EDBK_201319
6. Chen XY, Zhang J, Zhu JS. The role of m(6)A RNA methylation in human cancer. Mol Cancer. 2019;18(1):103. doi:10.1186/s12943-019-1033-z
7. Bi Z, Liu Y, Zhao Y, et al. A dynamic reversible RNA N(6) -methyladenosine modification: current status and perspectives. J Cell Physiol. 2019;234(6):7948–7956. doi:10.1002/jcp.28014
8. Han J, Wang JZ, Yang X, et al. METTL3 promote tumor proliferation of bladder cancer by accelerating pri-miR221/222 maturation in m6A-dependent manner. Mol Cancer. 2019;18(1):110. doi:10.1186/s12943-019-1036-9
9. Guo X, Li K, Jiang W, et al. RNA demethylase ALKBH5 prevents pancreatic cancer progression by posttranscriptional activation of PER1 in an m6A-YTHDF2-dependent manner. Mol Cancer. 2020;19(1):91. doi:10.1186/s12943-020-01158-w
10. Li F, Wang H, Huang H, Zhang L, Wang D, Wan Y. m6A RNA methylation regulators participate in the malignant progression and have clinical prognostic value in lung adenocarcinoma. Front Genet. 2020;11:994. doi:10.3389/fgene.2020.00994
11. Zhang X, Zhang S, Yan X, et al. m6A regulator-mediated RNA methylation modification patterns are involved in immune microenvironment regulation of periodontitis. J Cell Mol Med. 2021;25(7):3634–3645. doi:10.1111/jcmm.16469
12. Wang L, Hui H, Agrawal K, et al. m6 A RNA methyltransferases METTL3/14 regulate immune responses to anti-PD-1 therapy. EMBO J. 2020;39(20):e104514. doi:10.15252/embj.2020104514
13. Li N, Kang Y, Wang L, et al. ALKBH5 regulates anti-PD-1 therapy response by modulating lactate and suppressive immune cell accumulation in tumor microenvironment. Proc Natl Acad Sci U S A. 2020;117(33):20159–20170. doi:10.1073/pnas.1918986117
14. Yu G, Wang LG, Han Y, He QY. clusterProfiler: an R package for comparing biological themes among gene clusters. OMICS. 2012;16(5):284–287. doi:10.1089/omi.2011.0118
15. Dickerson HW, Findly RC. Immunity to Ichthyophthirius infections in fish: a synopsis. Dev Comp Immunol. 2014;43(2):290–299. doi:10.1016/j.dci.2013.06.004
16. Kanehisa M, Goto S, Sato Y, Kawashima M, Furumichi M, Tanabe M. Data, information, knowledge and principle: back to metabolism in KEGG. Nucleic Acids Res. 2014;42(Databaseissue):D199–205. doi:10.1093/nar/gkt1076
17. Ashburner M, Ball CA, Blake JA, et al. Gene ontology: tool for the unification of biology. The Gene Ontology Consortium. Nat Genet. 2000;25(1):25–29. doi:10.1038/75556
18. Otasek D, Morris JH, Boucas J, Pico AR, Demchak B. Cytoscape Automation: empowering workflow-based network analysis. Genome Biol. 2019;20(1):185. doi:10.1186/s13059-019-1758-4
19. Du J, Hou K, Mi S, et al. Malignant evaluation and clinical prognostic values of m6A RNA methylation regulators in glioblastoma. Front Oncol. 2020;10:208. doi:10.3389/fonc.2020.00208
20. Zhang B, Wu Q, Li B, Wang D, Wang L, Zhou YL. m(6)A regulator-mediated methylation modification patterns and tumor microenvironment infiltration characterization in gastric cancer. Mol Cancer. 2020;19(1):53. doi:10.1186/s12943-020-01170-0
21. Braig S, Bosserhoff AK. Death inducer-obliterator 1 (Dido1) is a BMP target gene and promotes BMP-induced melanoma progression. Oncogene. 2013;32(7):837–848. doi:10.1038/onc.2012.115
22. Forghanifard MM, Naeimi Khorasanizadeh P, Abbaszadegan MR, Javdani Mallak A, Moghbeli M. Role of DIDO1 in progression of esophageal squamous cell carcinoma. J Gastrointest Cancer. 2020;51(1):83–87. doi:10.1007/s12029-019-00212-1
23. Forlani G, Shallak M, Celesti F, Accolla RS. Unveiling the hidden treasury: CIITA-driven MHC Class II expression in tumor cells to dig up the relevant repertoire of tumor antigens for optimal stimulation of tumor specific CD4+ T helper cells. Cancers. 2020;12(11):3181. doi:10.3390/cancers12113181
24. Accolla RS, Ramia E, Tedeschi A, Forlani G. CIITA-Driven MHC Class II expressing tumor cells as antigen presenting cell performers: toward the construction of an optimal anti-tumor vaccine. Front Immunol. 2019;10:1806. doi:10.3389/fimmu.2019.01806
25. Su W, Han HH, Wang Y, et al. The polycomb repressor complex 1 drives double-negative prostate cancer metastasis by coordinating stemness and immune suppression. Cancer Cell. 2019;36(2):139–155 e110. doi:10.1016/j.ccell.2019.06.009
26. Xu J, Zheng H, Yuan S, et al. Overexpression of ANLN in lung adenocarcinoma is associated with metastasis. Thorac Cancer. 2019;10(8):1702–1709. doi:10.1111/1759-7714.13135
27. Long X, Zhou W, Wang Y, Liu S. Prognostic significance of ANLN in lung adenocarcinoma. Oncol Lett. 2018;16(2):1835–1840. doi:10.3892/ol.2018.8858
28. Ye D, Meurs I, Ohigashi M, et al. Macrophage ABCA5 deficiency influences cellular cholesterol efflux and increases susceptibility to atherosclerosis in female LDLr knockout mice. Biochem Biophys Res Commun. 2010;395(3):387–394. doi:10.1016/j.bbrc.2010.04.027
29. Fu Y, Hsiao JH, Paxinos G, Halliday GM, Kim WS. ABCA5 regulates amyloid-beta peptide production and is associated with Alzheimer’s disease neuropathology. J Alzheimers Dis. 2015;43(3):857–869. doi:10.3233/JAD-141320
30. Xu F, Cui WQ, Wei Y, et al. Astragaloside IV inhibits lung cancer progression and metastasis by modulating macrophage polarization through AMPK signaling. J Exp Clin Cancer Res. 2018;37(1):207. doi:10.1186/s13046-018-0878-0
31. Patente TA, Pinho MP, Oliveira AA, Evangelista GCM, Bergami-Santos PC, Barbuto JAM. Human dendritic cells: their heterogeneity and clinical application potential in cancer immunotherapy. Front Immunol. 2018;9:3176. doi:10.3389/fimmu.2018.03176
32. Tran Janco JM, Lamichhane P, Karyampudi L, Knutson KL. Tumor-infiltrating dendritic cells in cancer pathogenesis. J Immunol. 2015;194(7):2985–2991. doi:10.4049/jimmunol.1403134
33. Buchbinder EI, Desai A. CTLA-4 and PD-1 pathways: similarities, differences, and implications of their inhibition. Am J Clin Oncol. 2016;39(1):98–106. doi:10.1097/COC.0000000000000239
34. Xia L, Liu Y, Wang Y. PD-1/PD-L1 blockade therapy in advanced non-small-cell lung cancer: current status and future directions. Oncologist. 2019;24(Suppl 1):S31–S41. doi:10.1634/theoncologist.2019-IO-S1-s05
 © 2021 The Author(s). This work is published and licensed by Dove Medical Press Limited. The full terms of this license are available at https://www.dovepress.com/terms.php and incorporate the Creative Commons Attribution - Non Commercial (unported, v3.0) License.
By accessing the work you hereby accept the Terms. Non-commercial uses of the work are permitted without any further permission from Dove Medical Press Limited, provided the work is properly attributed. For permission for commercial use of this work, please see paragraphs 4.2 and 5 of our Terms.
© 2021 The Author(s). This work is published and licensed by Dove Medical Press Limited. The full terms of this license are available at https://www.dovepress.com/terms.php and incorporate the Creative Commons Attribution - Non Commercial (unported, v3.0) License.
By accessing the work you hereby accept the Terms. Non-commercial uses of the work are permitted without any further permission from Dove Medical Press Limited, provided the work is properly attributed. For permission for commercial use of this work, please see paragraphs 4.2 and 5 of our Terms.