")
Back to Journals » Journal of Inflammation Research » Volume 15
Development and Validation of a Prognostic Classifier Based on Lipid Metabolism-Related Genes for Breast Cancer
Authors Wang N , Gu Y, Li L , Chi J, Liu X , Xiong Y, Zhong C
Received 5 January 2022
Accepted for publication 7 June 2022
Published 14 June 2022 Volume 2022:15 Pages 3477—3499
DOI https://doi.org/10.2147/JIR.S357144
Checked for plagiarism Yes
Review by Single anonymous peer review
Peer reviewer comments 2
Editor who approved publication: Professor Ning Quan
Nan Wang,1 Yuanting Gu,1 Lin Li,1 Jiangrui Chi,1 Xinwei Liu,1 Youyi Xiong,1 Chaochao Zhong2
1Department of Breast Surgery, The First Affiliated Hospital of Zhengzhou University, Zhengzhou, People’s Republic of China; 2Department of Plastic Surgery, The First Affiliated Hospital of Zhengzhou University, Zhengzhou, People’s Republic of China
Correspondence: Nan Wang, Email [email protected]
Background: The changes of lipid metabolism have been implicated in the development of many tumors, but its role in breast invasive carcinoma (BRCA) remains to be fully established. Here, we attempted to ascertain the prognostic value of lipid metabolism-related genes in BRCA.
Methods: We obtained RNA expression data and clinical information for BRCA and normal samples from public databases and downloaded a lipid metabolism-related gene set. Ingenuity Pathway Analysis (IPA) was applied to identify the potential pathways and functions of Differentially Expressed Genes (DEGs) related to lipid metabolism. Subsequently, univariate and multivariate Cox regression analyses were utilized to construct the prognostic gene signature. Functional enrichment analysis of prognostic genes was achieved by the Gene Ontology (GO) and Kyoto Encyclopedia of Genes and Genomes (KEGG). Kaplan-Meier analysis, Receiver Operating Characteristic (ROC) curves, clinical follow-up results were employed to assess the prognostic potency. Potential compounds targeting prognostic genes were screened by Connectivity Map (CMap) database and a prognostic gene-drug interaction network was constructed using Comparative Toxicogenomics Database (CTD). Furthermore, we separately validated the selected marker genes in BRCA samples and human breast cancer cell lines (MCF-7, MDA-MB-231).
Results: IPA and functional enrichment analysis demonstrated that the 162 lipid metabolism-related DEGs we obtained were involved in many lipid metabolism and BRCA pathological signatures. The prognostic classifier we constructed comprising SDC1 and SORBS1 can serve as an independent prognostic marker for BRCA. CMap filtered 37 potential compounds against prognostic genes, of which 16 compounds could target both two prognostic genes were identified by CTD. The functions of the two prognostic genes in breast cancer cells were verified by cell function experiments.
Conclusion: Within this study, we identified a novel prognostic classifier based on two lipid metabolism-related genes: SDC1 and SORBS1. This result highlighted a new perspective on the metabolic exploration of BRCA.
Keywords: lipid metabolism, breast invasive carcinoma, BRCA, prognostic classifier, SDC1, SORBS1
Corrigendum for this paper has been published.
Introduction
According to 2020 GLOBOCAN statistics of A Cancer Journal for Clinicians, breast invasive cancer (BRCA) is the most common type of cancer worldwide, comprising approximately 11.7% of new cancer cases.1 Despite advances in screening, research, and treatment, BRCA incidence continues to increase.2,3 BRCA continues to be a major public health problem globally. The risk factors for BRCA are complex and numerous, such as postpartum childbirth, obesity, metabolic syndrome, life stress, and lack of exercise.4 However, the correlation between these risk factors and the biological behavior of cancer cells has not yet been studied in depth, resulting in low value for the accurate prediction of the prognosis.5,6 Among these risk factors, the role of lipid metabolism disorders in the occurrence and development of BRCA has started to be appreciated.7–9 Establishing a more accurate model for predicting the prognosis of BRCA patients based on biomarkers related to BRCA lipid-metabolism is expected to become a valuable new research direction.
Changes in lipid metabolism and signal transduction have been recognized as one of the signs of abnormal cell growth and cancer progression.10 In addition to being a component of the cell membrane and a source of energy storage, lipids can also activate cell proliferation, differentiation, and migration, as well as induce cell death.11,12 Abnormal lipid metabolism has been reported to be related to the occurrence and development of a variety of malignant tumors, such as prostate cancer,13 ovarian cancer,14 pancreatic cancer,15 liver cancer,16 and BRCA.17 Studies have found that changes in lipid metabolism exist during the early stages of BRCA development, and a lipid-rich environment promotes the proliferation and migration of BRCA cells.18,19 Some bioinformatics studies have found that tumor gene sets and inflammation-related gene sets are highly expressed in adipocytes adjacent to BRCA, while histocytology studies have found that the lipid metabolism of residual cancer cells in patients undergoing neoadjuvant therapy for BRCA differs from that before treatment and in normal tissues.20,21 These findings suggest that genes related to lipid metabolism may become targets for BRCA treatment. Changes in lipid metabolism may also affect the target organ tropism of BRCA metastasis. It was found that the BRCA cells that are more prone to brain metastasis have significant changes in lipid metabolism.22 Although current studies have determined that abnormal lipid metabolism is related to BRCA progression and resistance to treatment, there is currently no specific diagnosis and treatment plan incorporating this information due to the complexity of the effects of lipid metabolism-related genes on BRCA.23–25
The use of bioinformatics to analyze the targets of disease diagnosis and treatment has been widely used.26,27 In this study, we analyzed and obtained the biological processes of differential lipid metabolism genes with prognostic value in BRCA based on The Cancer Genome Atlas (TCGA), Gene Expression Omnibus (GEO), Kyoto Encyclopedia of Genes and Genomes (KEGG), and Molecular Signatures Database (MSigDB) databases. We identified two genes, SDC1 and SORBS1, which we screened, analyzed, and verified as biomarker genes that may play important roles in BRCA. In addition, we not only verified the expression changes of these two genes in BRCA samples and breast cancer cell lines (MCF7, MDA-MB-231), but also verified the functions of these two genes in breast cancer cells by cell function experiments. Finally, we constructed a prognostic classifier and preliminarily verified it with datasets in the GEO database and clinical follow-up results we collected. The validation results showed that our prognostic classifier has a clinical value and can provide a new reference for the diagnosis and treatment of BRCA patients. In addition, we used Connectivity Map (CMAP) and the Comparative Toxicogenomics Database (CTD) to investigate compounds targeting prognostic genes, and to provide new insights for the synthesis of new drugs.
Materials and Methods
Cell Lines
MDA-MB-231 and MCF-7 cells were obtained from ATCC (Shanghai, China) and cultured in DMEM (Invitrogen, Carlsbad, CA, USA) at 37°C under 5% CO2.
Clinical Sample Acquisition
Tumor tissue and normal breast tissue adjacent to the tumor were collected from 30 BRCA patients. All the patients were introduced to surgery at the First Affiliated Hospital of Zhengzhou University, Henan, China, from December 2020 to January 2021 and did not receive any anti-cancer treatment before surgery. All patients were between 18 and 80 years old and agreed to accept the postoperative follow-up plan. Tissue specimens were collected within 30 min after surgery and quickly frozen in liquid nitrogen. Postoperative monitoring and treatment continued in accordance with relevant consensus guidelines. The degree of tumor differentiation was graded according to the WHO grading system. Overall survival (OS) was defined as the time between surgery and death. The study was approved by the Ethics Committee of the First Affiliated Hospital of Zhengzhou University and conducted according to the principles expressed in the Declaration of Helsinki. Written informed consent was obtained from each patient prior to collection of any samples. Detailed information of each patient, including serial number, sampling time, pathology type, ER positivity rate, HER2 status, Ki-67 expression, lymph node stage, tumor size, age, and side of affected breast, is available in Supplementary Table 1.
In order to verify the clinical applicability of our prognostic model, we collected the clinical data and pathological sections of 50 patients with BRCA who underwent surgery in our hospital from January 2015 to March 2015. The plan for clinical patient follow-up and collection of patient clinical data to verify the prognosis model was approved by the Ethics Committee of the First Affiliated Hospital of Zhengzhou University. We followed up by phone or in-person to collect the survival information of the 50 patients. All patients were between 18 and 80 years old and agreed to accept the post-operative follow-up plan. The personal information of each patient is strictly confidential, and as such, written informed consent was obtained from each patient or its entrustment. The clinical conditions and follow-up results of the patients are shown in Supplementary Table 2.
Data Sources
We acquired RNA expression data from 1171 samples (1072 breast cancer samples and 99 normal samples) from TCGA database. Of the 1072 BRCA samples, only 1069 BRCA samples recorded complete survival information, so candidate prognosis-related lipid metabolism differentially expressed genes (DEGs) were identified based on these samples. In addition, only 881 of the 1069 BRCA samples had complete clinical information, which was needed for the sample to be used in the construction of the prognostic classifier. The patients’ characteristics were presented in Supplementary Table 3.
The GSE109169 dataset28 (https://www.ncbi.nlm.nih.gov/geo/query/acc.cgi?acc=GSE109169) was downloaded from the GEO database (25 BRCA samples, 25 normal samples) and was utilized to legitimize the expression pattern of candidate prognosis‐related lipid metabolism DEGs. The patients’ characteristics were presented in Supplementary Table 4. Furthermore, we downloaded the GSE2068529 dataset from the GEO database, which was utilized as independent external validation set to authenticate the prognostic efficacy of the multigene signature. The GSE20685 dataset contains 327 BRCA samples with complete survival information and matched transcriptomic data (https://www.ncbi.nlm.nih.gov/geo/query/acc.cgi?acc=GSE20685). The characteristics of the BRCA samples in the GSE20685 dataset were available in Supplementary Tables 5. Moreover, 1499 genes related to lipid metabolism were obtained by de-duplication from 13 gene sets related to lipid metabolism, which were downloaded from the Gene Ontology (GO) and the Molecular Signatures Database (MSigDB) websites. These 13 gene sets were GO_GALACTOLIPID_METABOLIC_PROCESS, GO_GLYCEROLIPID_METABOLIC_PROCESS, GO_GLYCEROPHOSPHOLIPID_METABOLIC_PROCESS, GO_GLYCOSPHINGOLIPID_METABOLIC_PROCESS, GO_LIPID_METABOLIC_PROCESS, GO_LIPOPROTEIN_METABOLIC_PROCESS, GO_MEMBRANE_LIPID_METABOLIC_PROCESS, GO_NEUTRAL_LIPID_METABOLIC_PROCESS, GO_PHOSPHOLIPID_METABOLIC_PROCESS, GO_REGULATION_OF_LIPID_METABOLIC_PROCESS, GO_REGULATION_OF_LIPOPROTEIN_METABOLIC_PROCESS, GO_REGULATION_OF_PHOSPHOLIPID_METABOLIC_PROCESS, GO_SPHINGOLIPID_METABOLIC_PROCESS. All lipid metabolism-related genes are integrated into Supplementary Table 6.
BRCA-FPKM data were obtained from the TCGA database and log2 transformed for the gene expression files before use; the expression profiles acquired from the GEO database were log2 transformed. Moreover, we used the normalize Between Arrays function of the limma package to normalize the gene expression profiles of GSE109169 and GSE20685 datasets.
Translation level validation of identified prognostic genes was performed using the Human Protein Atlas30 database (http://www.proteinatlas.org/), an online database containing immunohistochemical expression data for approximately 20 of the most common cancers.
Differential Analysis
Transcriptome RNA-seq data of 1171 cases (normal samples, 99 cases; BRCA samples, 1072 cases) were downloaded from TCGA database. R package limma31 was used to perform differentiation analysis of the gene expression, and DEGs were generated by the comparison between the BRCA samples vs the normal samples (Supplementary Table 7). DEGs with |log2 fold change | > 1 and adjusted P < 0.05 were considered significant.
Ingenuity Pathway Analysis (IPA)
Overlapping genes (Supplementary Table 8) for DEGs and lipid metabolism-related genes were analyzed by the IPA software (version 1–19-00). RNA sequencing results were imported into IPA, and the enrichment status of canonical pathways and diseases and functions were assessed by P-values.32,33 Z scores were indicated by orange or blue to denote activation or inhibition of pathways. In IPA, terms with P < 0.05 were considered significantly enriched; furthermore, in IPA-Canonical pathway analysis, the activation and inhibition of the enriched pathway were assessed by Z-score, specifically, Z-score > 0 and P < 0.05 indicated that the pathway was active, while Z-score < 0 and P < 0.05, then the pathway was considered to be in the inhibited state.
Identification of Candidate Prognosis-Related Lipid Metabolism DEGs
Lipid metabolism DEGs were included in the univariate Cox regression analysis, and genes with a P < 0.05 were selected to be used in the multivariate Cox regression analysis. Similarly, genes with a P < 0.05 were considered as candidate prognosis-related lipid metabolism DEGs. Subsequently, GO and KEGG analyses were carried out based on the above genes using the R software clusterProfiler package. GO analysis consisted of three components: biological process (BP), molecular function (MF) and cellular component (CC). Entries with an adjusted (adj.) P < 0.05 were considered significantly enriched.
Knock-Down and Overexpression Experiments of SDC1 and SORBS1
The empty plasmids used for constructing controls of SDC1 gene overexpression and SORBS1 gene overexpression (oe-SDC1control and oe-SORBS1control), the non-targeting plasmid used for constructing controls of SDC1 gene knockdown and SORBS1 gene knockdown (si-SDC1 control and si-SORBS1 control), SDC1 knockdown plasmids, SORBS1 knockdown plasmids, SDC1 overexpression plasmids and SORBS1 overexpression plasmids were designed and constructed by Genechem (Shanghai, China). The sequences of the plasmids used in this study are provided in Supplementary Table 9. According to the manufacturer’s instruction, cells of different groups were transfected with these plasmids using Lipofectamine 2000. 72 hours after transfections, the effects of knockdown or overexpression were examined by qRT-PCR and Western blot.
RNA Isolation, Reverse Transcription, and Real-Time PCR
Total RNA was isolated from 30 paired tissues and 8 groups of experimental cells using TriQuick Reagent (Solarbio, Shanghai, China) according to the manufacturer’s instructions. Then the concentration and purity of the RNA solution was quantified using a NanoDrop 2000 nucleic acid protein quantifier (Thermo Fisher Scientific, Waltham, MA, USA). qRT-PCR was performed as described previously.34 Briefly, the extracted RNA was reverse-transcribed to cDNA using the FastQuant RT Kit with gDNA eraser (TIANGEN, Beijing, China) prior to qRT-PCR. The reverse transcription reaction consisted of 4 µL of 5x reaction buffer, 1 µL of oligo (dt) primer, 1 µL of random hexamer primer, 1 µL of Servicebio RT Enzyme Mix, and 0.1 ng–5 µg total RNA, and finally the reaction was brought to 20 µL using RNase-free water. The qRT-PCR reaction consisted of 2 µL of reverse transcription product, 10 µL of 2X SYBRGreen qPCR Master Mix (High ROX, Servicebio, Wuhan, China), 0.4 µL each of forward and reverse primer, and 7.2-µL nuclease-free water. PCR was performed in a MiniAmp Thermal Cycler (A37834, Thermo Fisher Scientific, Waltham, MA, USA) under the following conditions: 95℃ for 3 s, followed by 40 cycles of 95℃ for 15s and 60℃ for 30s. The GAPDH gene served as an internal control. 2-ΔCt method was used to calculate the RNA levels of tumor samples, paired adjacent samples and 8 groups of experimental cells. Primer sequences used for qRT-PCR are shown in Table 1.
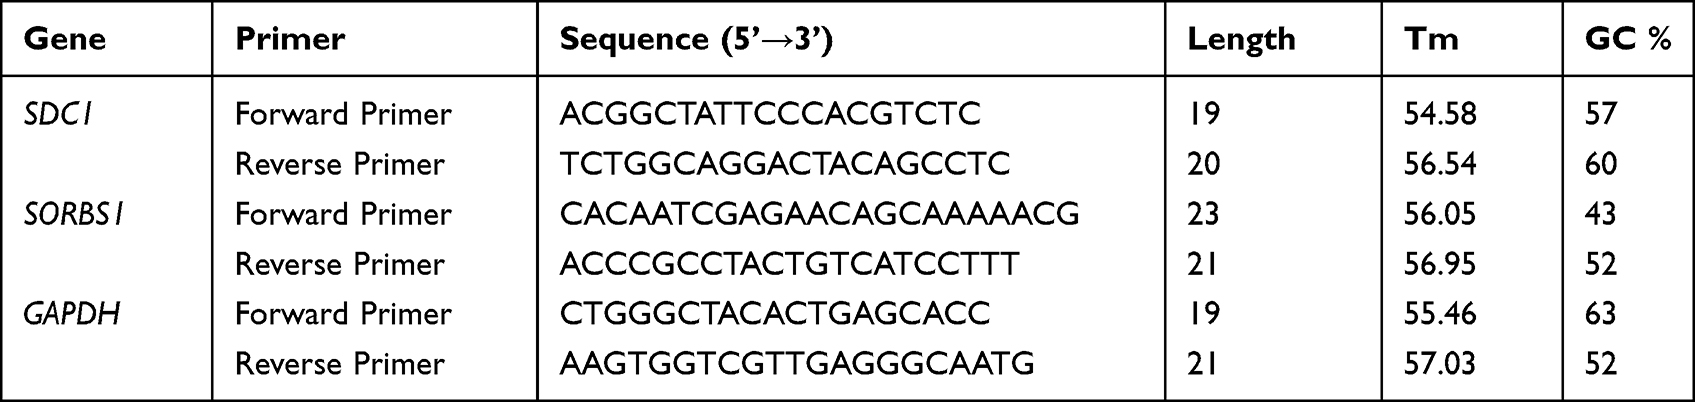 |
Table 1 Primer Sequences Used for qRT-PCR |
Western Blot Analysis
Western blot analysis was conducted using an SDS-PAGE electrophoresis system (Bio-Rad Laboratories, Hercules, CA, USA). Briefly, the total protein content was extracted from tissue or 8 groups of experimental cells using a RIPA buffer (P0013C, Beyotime, Shanghai, China). Protein samples were separated by SDS-PAGE and transferred onto nitrocellulose membranes (88,520, Thermo Fisher Scientific, Waltham, MA, USA), which were subsequently blocked 12 h at 4℃ with 5% skimmed milk containing TBST (Tris-buffered salt solution, containing 50 mmol/L Tris-HCl, 150 mmol/L NaCl, 0.1% v/ v Tween-20, pH 7.4) solution. Antibodies against SDC1 (ab128936; Abcam, Cambridge, MA, USA), SORBS1 (ab224129; Abcam, Cambridge, MA, USA), and GAPDH (T0004; Affinity Biologicals, Cincinnati, OH, USA) were used as primary antibodies. The samples were incubated with horseradish peroxidase–conjugated secondary antibodies at 37℃ for 1 h. The membrane was imaged using an Amersham Imager 600 (GE Healthcare UK Limited, Little Chalfont, UK).
Immunohistochemistry
In the present study, we performed immunohistochemical analysis on 30 BRCA tissue samples and their paired cancer-adjacent normal breast tissue samples. The tissues were collected and fixed in 4% paraformaldehyde, embedded in paraffin, and sectioned at 6-µm intervals. The sections were placed in EDTA (pH 9.0) for antigen repair, washed with PBS (pH 7.4), treated with 3% H2O2, blocked with goat serum, and then incubated 12 h at 4℃ with SORBS1 (1:500; ab224129, Abcam, Cambridge, MA, USA) and SDC1 (1:1600; 10593-1-AP, Proteintech, Rosemont, IL, USA). Subsequently, the secondary antibody goat anti-rabbit IgG (1:200; GB23303, Servicebio) was incubated for 1 h at 37℃, and the positive sites were labelled with a DAB (diaminobenzidine) color development solution (G1211, Servicebio, Wuhan, China). Finally, hematoxylin staining (G1004, Servicebio, Wuhan, China) was performed to visualize the nuclei. Images (200×) were captured with a microscope (XSP-C204, COIC, Chongqing, China), and three different visual fields were analyzed. Image-Pro Plus 6 processing software (Media Cybernetics, Inc., Rockville, MD, USA) was used to analyzed results and to calculate average optical density,35 where AOD=integrated OD/measurement area.36 The higher the AOD, the higher the expression of the protein.37,38 The person imaging the slides was uninformed during the experiment and analysis.
Invasion Assays
Cell invasion assay was done performed according to the manufacturer’s instructions. Briefly, the upper surface of a Transwell (8-μm pore size; Corning, Corning, NY, USA) was coated with 20μL diluted Matrigel (BD Biosciences, Franklin Lakes, NJ, USA). Equal numbers of the indicated cells were seeded in the upper chamber of the Transwell in serum-free medium, with FBS added to the lower chamber. After incubation for 48 hours, non-invading cells were removed with a cotton swab, and the invaded cells were stained with crystal violet. Average invaded cell number per field of view was obtained from 5 random fields.
Scratch Assays
Cells were plated in 24-well cell culture plates (1 × 10⁵ cells/well) followed by overnight incubation. When culture was confluent (24 h post transfection), a p-200 pipette tip was used to score two vertical lines and one horizontal line (average width: 700–900 μm) simulating a “wound” by scratching the culture. All the wells were washed with sterile PBS twice and reference markings were drawn near the scratch area from the bottom side of the plate with a fine tip marker. Scratch images were captured within the marked area using an inverted microscope (Laxco, Mill Creek, WA, USA) with a 10X magnification objective piece.
Prediction Model
We randomly divided TCGA database of 881 BRCA samples containing complete clinical and survival information into a training set (n = 617) and a testing set (n = 264) based on a 7:3 ratio. The characteristics between the BRCA samples in the TCGA-training and -testing sets were not significantly different (Supplementary Table 10), indicating that they could be used for subsequent analysis. In the training set, univariate and multivariate Cox regression analyses were applied to extract the optimal prognosis-related lipid metabolism DEGs based on selected candidate prognosis-related lipid metabolism DEGs. Ultimately, genes with a P < 0.05 were used to construct a prognostic gene signature. Prognosis-related lipid metabolism DEGs were visualized on the forest plots. Risk scores were simultaneously calculated for each patient in the training set, testing set, and external validation set of the following equations: risk score = (expression of Gene1 × β1Gene1) + (expression of Gene2 × β2Gene2) + (… expression of Genen × βnGenen).39,40 β was represented by the regression coefficient, which was generated by the step multivariate Cox proportional hazards regression model. Based on this score, patients were classified into high- and low-risk score groups on the basis of the median classification method.
Prognostic Analysis
Risk curves were plotted with the pheatmap package. The R survival package41 was employed to assess the relationship between lipid metabolism-related gene signature and OS (P < 0.05) and to plot Kaplan-Meier (K-M) curves. Subsequently, the survival ROC package42,43 was executed to create ROC curves and calculate AUC in order to estimate the predictive accuracy of the prognostic gene signature. The above analyses were performed simultaneously in the training set, testing set, and the external validation set (GSE20685 dataset). Univariate and multivariate independent prognostic analyses were developed by survival software packages to confirm whether risk scores could be applied as the independent prognostic indicator. The rms44 and survival packages of R were performed to construct a nomogram. Subsequently, calibration curves were plotted to evaluate the agreement between actual and predicted survival.45 Decision curve analysis (DCA) was carried out to calculate the net clinical benefit for each model. The optimal model was the one with the greatest net benefit calculated.46
Connectivity Map (CMap) Analysis
CMap is designed to reveal the relationships among genes, compounds, and biological conditions, which is a systematic, data-driven process.47 We resorted to CMap02 in order to screen potential compounds that might target prognostic genes. Compounds with |enrichment score| ≥ 0.5 and a P < 0.05 were selected as potential therapeutic drugs for BRCA. The compounds were then further filtered by CMap’s CLUE tool (https://clue.io/) for related Mechanism of Actions (MoA) and their inhibitors in order to investigate their joint intrinsic mechanism of action.
Predicting Prognostic Gene-Chemotherapy Drug Interaction Network by CTD
A network of interactions between prognostic genes and chemotherapeutic agents was constructed using the Comparative Toxicogenomics Database (CTD) to obtain chemotherapeutic agents that could reduce or increase prognostic gene expression levels. Briefly, chemotherapeutic drugs for SORBS1 and SDC1 were searched for in the CTD, and the prognostic gene-drug interaction networks were visualized by using Cytoscape 3.8.2 (https://cytoscape.org/).
Statistical Analysis
The Jvenn website (http://jvenn.toulouse.inra.fr/app/example.html) was used to produce a Venn diagram for intersection analysis. A K–M curve with Log rank test was used to assess the OS differences between different groups. An ANOVA test was performed to detect the association of the risk score with clinical characteristics, and also, to reveal the differences in the levels of risk scores within different subtypes of clinical characteristics. The statistical analyses were conducted using the R software. A P < 0.05 indicated statistically significant differences.
Model Validation by Detailed Data from 2015.01 to 2015.03
After collecting clinicopathological and follow-up data and conducting immunohistochemistry staining, correlations between SDC1 and SORBS1 expression and survival prognosis were analyzed.
Results
Identification of Differentially Expressed Lipid Metabolism-Related Genes
RNA sequencing data of 1072 BRCA samples and 99 normal samples were extracted from TCGA database. A differential analysis based on the R package limma was performed with normal samples as controls in order to screen for genes that were aberrantly expressed in BRCA, and genes satisfying |log2 FC| > 1 and adjusted P < 0.05 were identified as DEGs. We identified a total of 1732 BRCA-related DEGs, of which 644 genes were upregulated and 1088 were downregulated in the BRCA group compared with the normal group (Figure 1A; Supplementary Table 7). Subsequently, to recognize lipid metabolism-related DEGs, we performed intersection analysis based on a list of 1732 DEGs and 1499 lipid metabolism-related genes. The results were shown in Figure 1B, and a total of 162 overlapping genes were identified, which were defined as lipid metabolism-related DEGs (Supplementary Table 8). Further, the heatmap demonstrated the expression pattern of these lipid metabolism-related DEGs between 1072 BRCA and 99 normal samples in the TCGA database (Figure 1C), including 34 up-regulated genes and 128 down-regulated genes (BRCA vs normal). Canonical pathway analysis of these lipid metabolism-related DEGs in IPA revealed that several pathways related to lipid metabolism (eg, fatty acid β-oxidation I, fatty acid α-oxidation, and fatty acid activation), carcinogenesis (eg, AMPK signaling, JAK/STAT signaling, and ERK/MAPK signaling), and immune response (eg, MIF regulation of innate immunity, IL-7 signaling pathway, and glioblastoma multiforme signaling) were inhibited. Furthermore, we demonstrated that these genes were correlated with the negative regulation of estrogen-dependent BRCA signaling, HER2 signaling in BRCA, and BRCA regulation by stathmin1 (Supplementary Figure 1A; Supplementary Table 11). The diseases and functions analysis confirmed that lipid metabolism and small molecule biochemistry were the most abundant pathways (Supplementary Figure 1B; Supplementary Table 12).
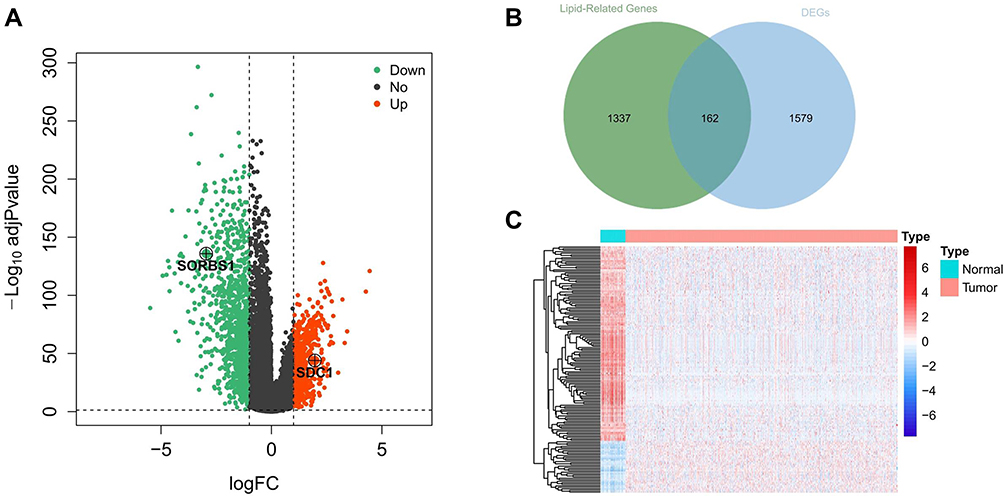 |
Figure 1 Identification of metabolism-related genes and construction of a prognostic classifier. (A) A volcano plot of all DEGs is shown combined with |log2FC| and an adjusted p-value. Red represents 644 upregulated DEGs. Green represents 1088 downregulated DEGs. (B) Extraction of metabolism-related genes from the DEGs. (C) Heatmap of lipid metabolism-related DEGs between tumor and matched adjacent normal tissue. Different colors represent the expression trend of lipid metabolism-related DEGs in the two groups, red represents high expression of genes and blue represents low expression of genes. Abbreviations: DEGs, differentially expressed genes; FC, fold change. |
Functional Enrichment Analysis of Candidate Prognosis-Related Lipid Metabolism DEGs
In the present analysis, we included 1069 BRCA samples that contained complete survival information. Univariate Cox analysis screened 76 genes with P < 0.05 from the identified 162 lipid metabolism-related DEGs (Table 2). Thirteen candidate prognosis-related lipid metabolism genes were obtained from the subsequent multivariate Cox analysis. Through examination with a forest plot, genes with HR > 1 were found to include LEPR, FGF2, GPAM, SDC1, CCDC3, PCK2, PLTP and HSD17B13, which may be risk factors for BRCA prognosis; while ABCD2, FABP4, SORBS1, FAM126A and GP1HBP1 with HR < 1 could be termed as protective factors for BRCA prognosis (Figure 2A).We then validated the expression patterns of the 13 genes mentioned above using the GSE109169 dataset. The results showed that the expression trends of these genes were consistent with those in the TCGA database. Except for SDC1, the expression of the other 12 genes was downregulated in the BRCA samples (Figure 2B and C). The underlying features of these genes were ascertained by GO and KEGG pathway analysis (Supplementary Figure 2). Undoubtedly, several GO terms related to lipid metabolism were found in biological processes, such as “positive regulation of lipid metabolic process,” “regulation of lipid biosynthetic process,” “regulation of lipid metabolic process,” “positive regulation of lipid biosynthetic process,” “glycerolipid metabolic process,” and “triglyceride metabolic process” (Supplementary Table 13). Furthermore, “lipid droplet” and “external side of plasma membrane” were the most remarkably enriched GO items of CC (Supplementary Figure 2A). As implied by the KEGG pathway analysis (Supplementary Figure 2B), candidate prognosis-related lipid metabolism genes were primarily enriched along two pathways-The proliferator-activated receptor (PPAR) signaling pathway and adipocytokine signaling pathway (Supplementary Table 14).
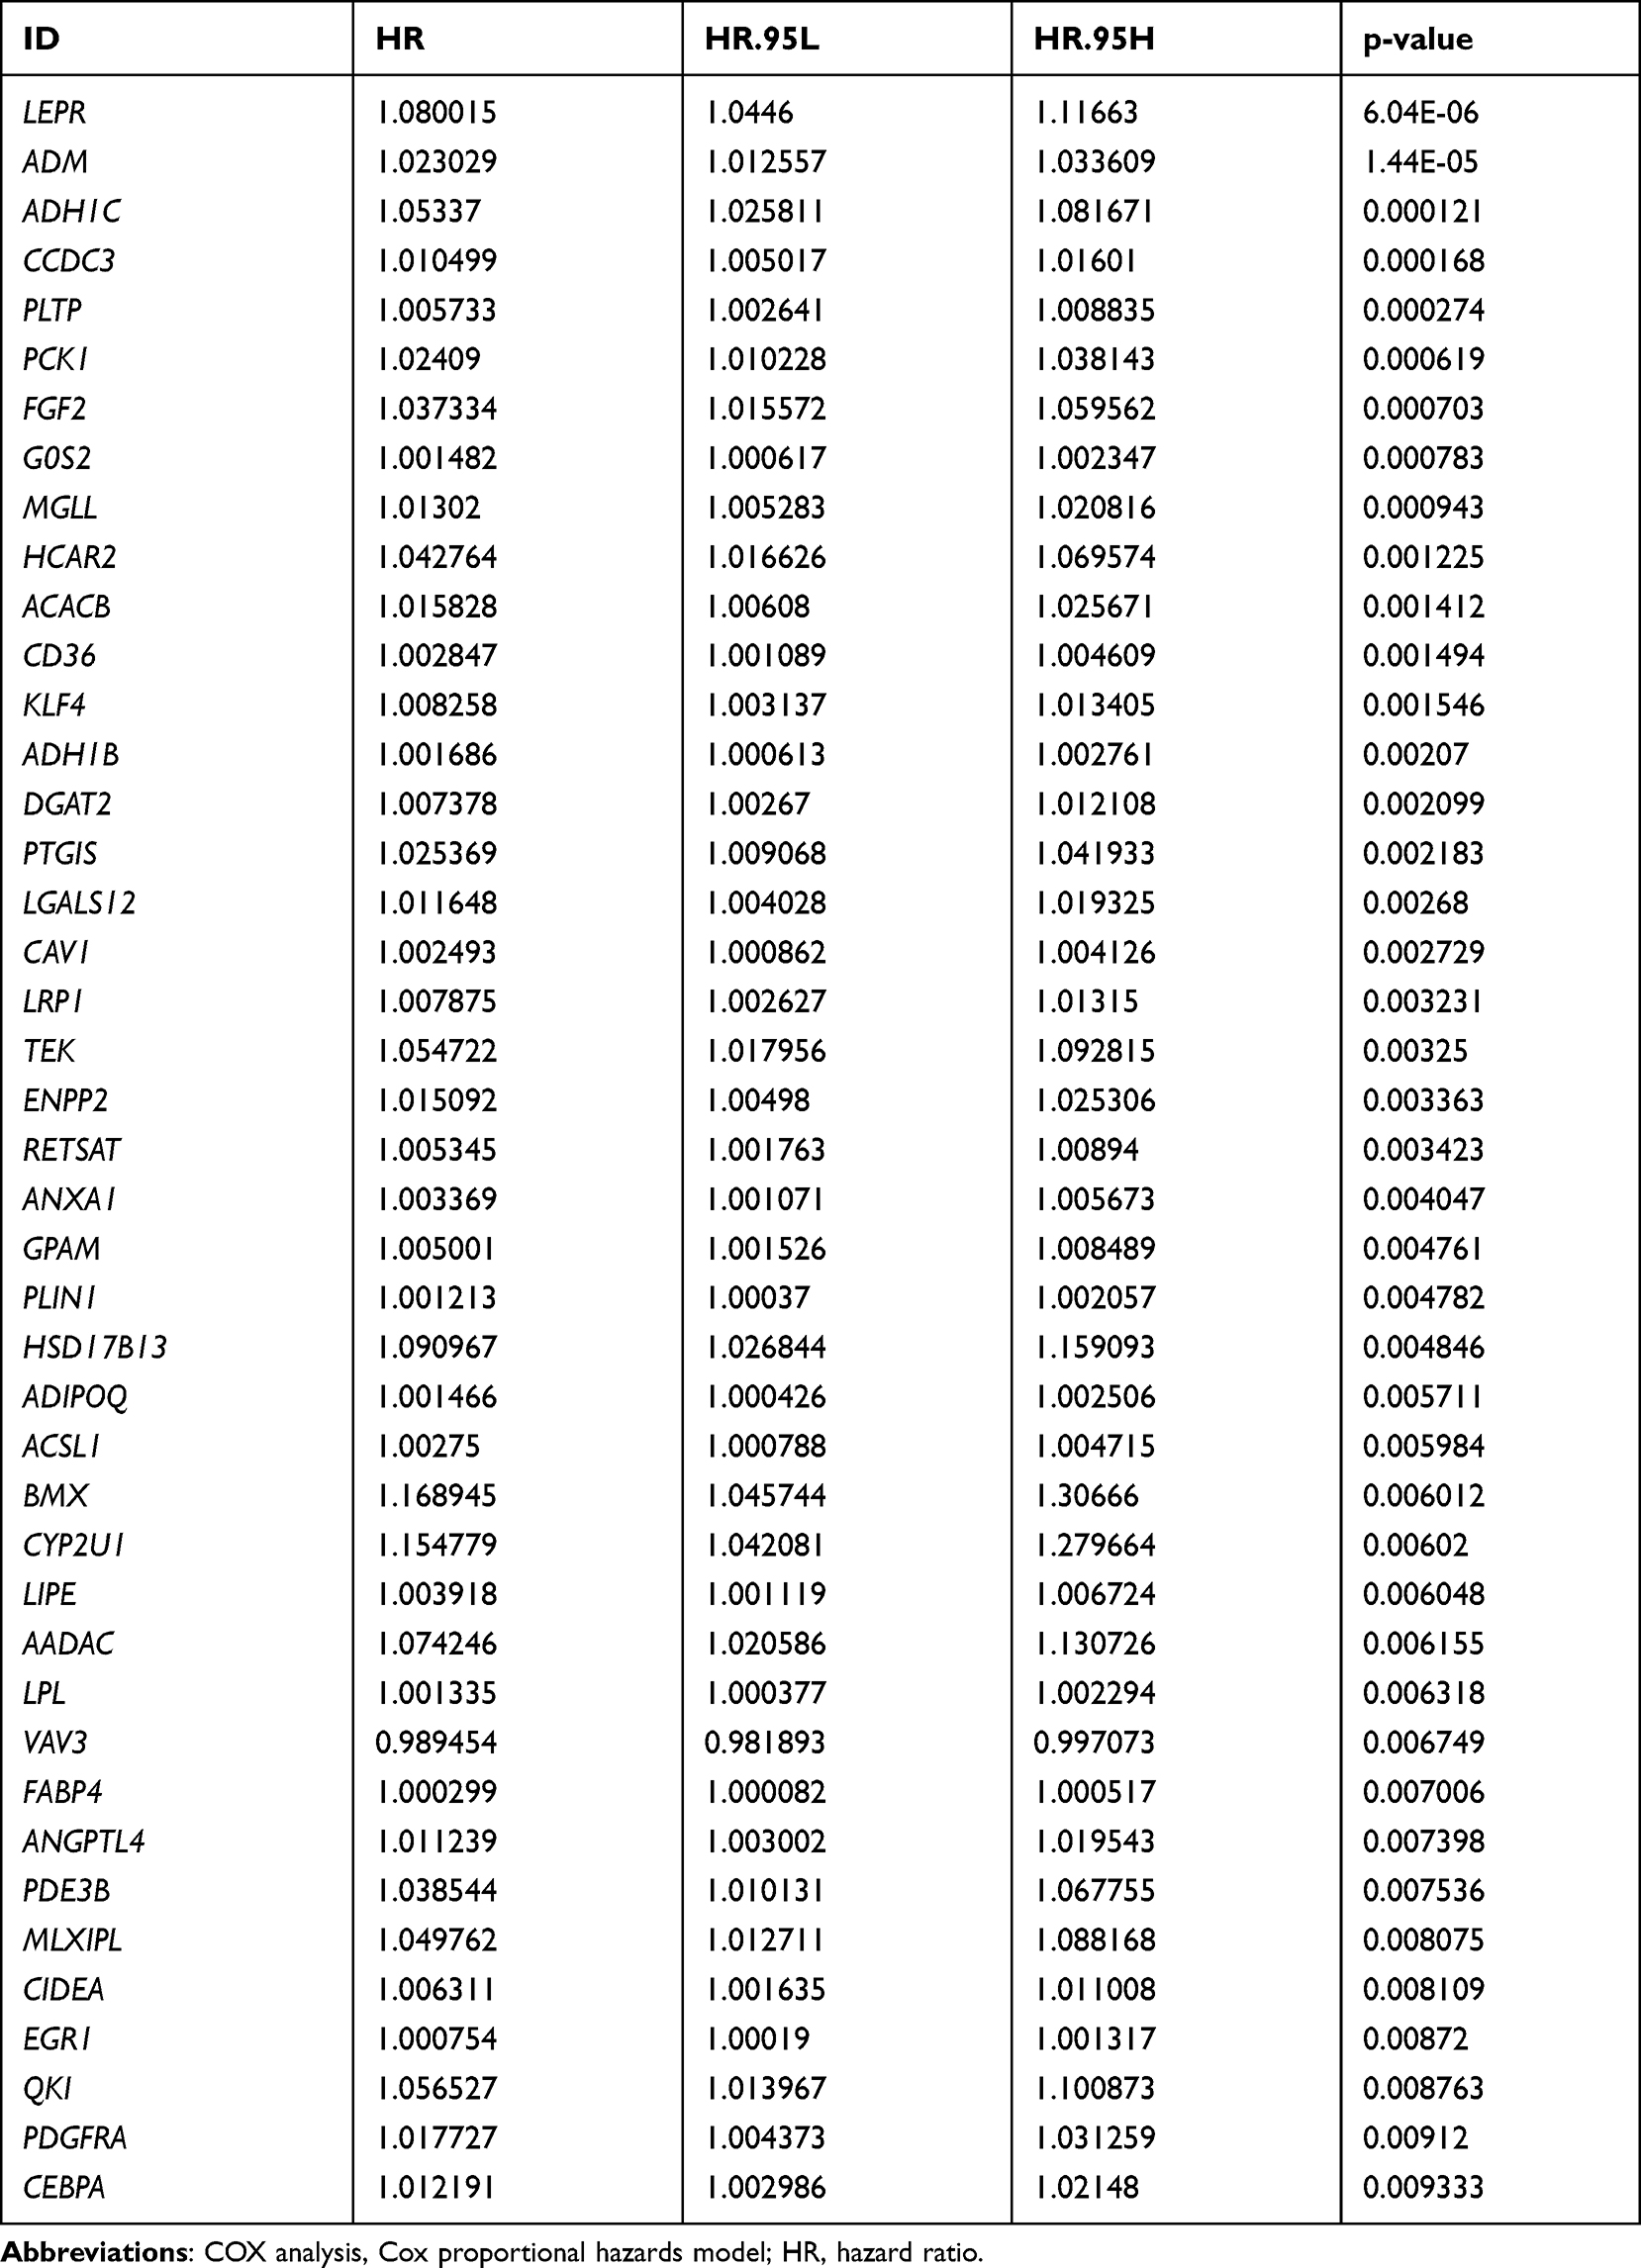 |
Table 2 Univariate COX Analysis of Different Lipid Metabolism Genes (P < 0.05) |
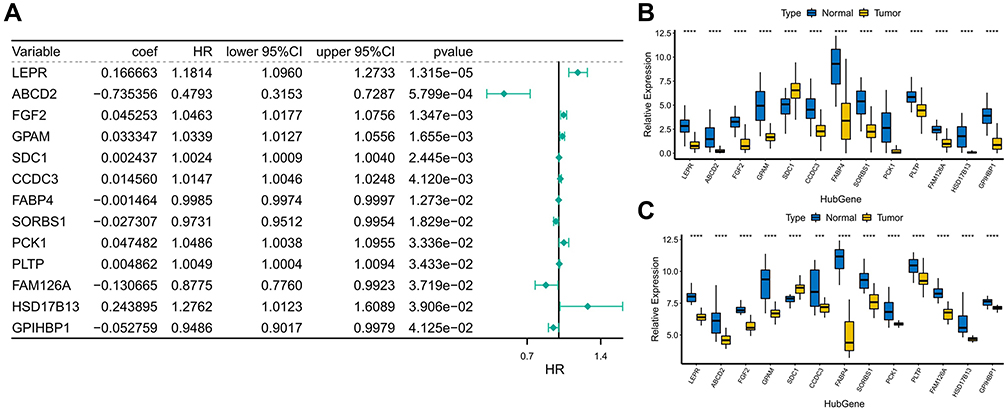 |
Figure 2 Functional enrichment analysis of candidate prognosis-related lipid metabolism DEGs (A) Forest map of lipid metabolism-related DEGs associated with prognosis. (B) Expression of prognostic lipid metabolism DEGs in TCGA, where the horizontal axis represents different gene, the vertical axis represents the gene expression distribution, where different colors represent different groups. Asterisks represent levels of significance, ****p < 0.0001. (C) Expression of prognostic lipid metabolism DEGs in GSE109169, where the horizontal axis represents different gene, the vertical axis represents the gene expression distribution, where different colors represent different groups. Asterisks represent levels of significance ***p < 0.001, ****p < 0.0001. |
Filtering Candidate Prognosis-Related Lipid Metabolism DEGs for Prognostic Prediction
Two prognosis-related genes, SDC1 (HR = 1.2638, P = 0.03076) and SORBS1 (HR = 0.7628, P = 0.03576), were retained based on the univariate Cox regression analysis in the training set (Figure 3A). Subsequently, we proceeded to risk model gene selection utilizing multivariate Cox regression (Figure 3B). The results indicated that SDC1 (P = 0.037) and SORBS1 (P = 0.043) were the optimal variables for the construction of prognostic signature. According to the hazard ratio (HR), SDC1 might be a promoter of BRCA (HR = 1.244, 95% CI: 1.014–1.523) and SORBS1 was a promising tumor suppressor gene (HR = 0.768, 95% CI: 0.595–0.991). Subsequently, based on the TCGA-training set, we revealed the association of the two identified prognostic genes with OS in BRCA patients by K-M curves. The relatively short OS of high expression of SDC1-BRCA compared to low expression of SDC1-BRCA (Figure 3C; P = 0.048); and the expression of SORBS1 was positively associated with OS in BRCA patients, with high expression of SORBS1 implying longer OS (Figure 3D; P = 0.0096), which evidence corroborated the inferences made based on HR values. Next, the expression values of prognostic genes and multivariate Cox regression coefficients (Supplementary Table 15) were utilized to generate risk scores for individual samples in the training set. Moreover, IPA exposed a sophisticated network of interactions involving the two prognostic genes (Supplementary Figures 1C–E).
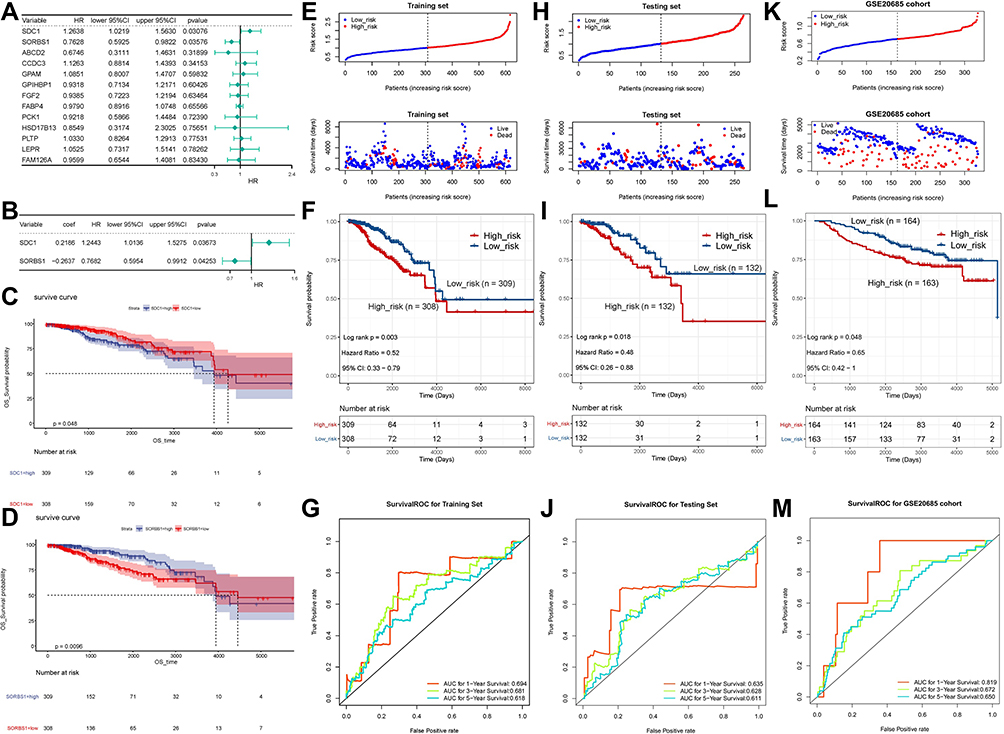 |
Figure 3 Risk score independent of the prognostic analysis. (A) Univariate Cox analysis showing the hazard ratio of each candidate prognosis-related lipid metabolism DEG in predicting overall survival in BRCA from the training set. (B) Multivariate Cox regression analysis of 2 prognostic genes. (C) Survival analysis of SDC1. (D) Survival analysis of SORBS1. (E) The distribution of risk score and survival status of the training set-BRCA patients in the high- and low-risk groups. (F) Survival analysis of the high- and low-risk groups in the training set. (G) ROC curve showing the moderate accuracy of the constructed prognostic model of BRCA from the training set. (H) The distribution of ROC analysis of the two-gene signature in the testing set. (I) The distribution of Kaplan-Meier survival analysis of the two-gene signature in the testing set. (J) The distribution of risk score and survival status analysis of the two-gene signature in the testing set. (K) The distribution of ROC analysis of the two-gene signature in the GSE20685 dataset. (L) The distribution of Kaplan-Meier survival analysis of the two-gene signature in the GSE20685 dataset. (M) The distribution of risk score and survival status analysis of the two-gene signature in the GSE20685 dataset. Abbreviations: ROC, receiver operating characteristic curve; K-M, Kaplan-Meier; SDC1, Syndecan-1; SORBS1, sorbin and SH3 domain containing 1. |
The 2-gene based prognostic signature was assessed in the training set. Depending on the training set-median risk score, the 617 samples were divided into high (n = 308) and low (n = 309) risk groups, and the risk score curves and survival status of all samples were presented in Figure 3E. K-M survival analysis showed that the risk score based on the 2-gene prognostic signature could significantly discriminate the clinical outcomes of BRCA patients, with a low-risk score implying a better prognosis (P = 0.003; Figure 3F). Subsequently, ROC curve analysis showed that the risk score predicted the AUC of 1, 3, and 5-year OS for training set-BRCA patients to be 0.694, 0.681, and 0.618, respectively (Figure 3G). Further, we evaluated the general applicability of the risk score system in the testing set and external validation set (GSE20685 dataset). The performance of risk score in the TCGA-testing set (n = 264; Figure 3H) and the independent external validation set (GSE20685 dataset, n = 327; Figure 3I) was similar to that in the TCGA-training set. High-risk scores were significantly associated with poor prognosis (all P < 0.05). The AUC of the ROC curve at 1, 3, and 5 years was 0.635, 0.628, and 0.611 in the testing set, and the AUCs in the GSE20685 dataset were 0.819, 0.672, and 0.650, respectively. This evidence suggested that the SDC1 and SORBS1-based prognostic signature possessed robust prognostic predictive power. Additionally, heat maps were constructed to visualize the expression of prognostic genes in each cohort (Supplementary Figure 3A–C), with SDC1 being relatively highly expressed in the high-risk group and SORBS1 being relatively overexpressed in the low-risk group. Moreover, immunohistochemical results, pathological results, and follow-up results of 50 patients (Supplementary Table 16) collected from January 2015 to March 2015 were divided into high-risk and low-risk groups according to this prognostic model, and the difference in the survival curves between the two groups was found to be statistically significant by survival analysis (P = 2.516e-02) (Supplementary Figure 3D).
The Obtained Two-Gene Signature Was Linked to Pathological Features of BRCA
We further investigated whether the genetic signature was implicated in the pathological features of BRCA. Specifically, in the AJCC pathologic T-stage subgroup (Figure 4A), risk score levels were significantly higher in the T2/T4 subtype than in the T1 subtype; interestingly, risk score levels were markedly lower in the T3 subtype compared with the T2 subtype; compared with the T3 subtype, risk score levels were remarkably higher in the T4 subtype; however, risk score levels were comparable between the T1 and T3 and T2 and T4 subtypes. In the AJCC pathologic N-stage subgroup (Figure 4B), risk score levels were increased considerably in the N1 and N2 subtypes relative to the N0 subtype; however, risk score levels were not statistically different between the N0 and N3, N1 and N2/N3, and N2 and N3 subtypes. In the AJCC pathologic stage subgroup (Figure 4C), the risk score levels were proportional to the stage level, with the higher the stage level, the higher the risk score level; however, there was no significant difference in the risk score levels among stage II, stage III, and stage IV. We also assessed the relationship between different types of BRCA and risk scores (Figure 4D). Of the 4 types of BRCA, HER2-enrich BRCA had the highest risk score, followed by luminal B, basal-like, and luminal A BRCA. Such results suggested a substantial interaction between lipid metabolism genes and clinical molecular features.
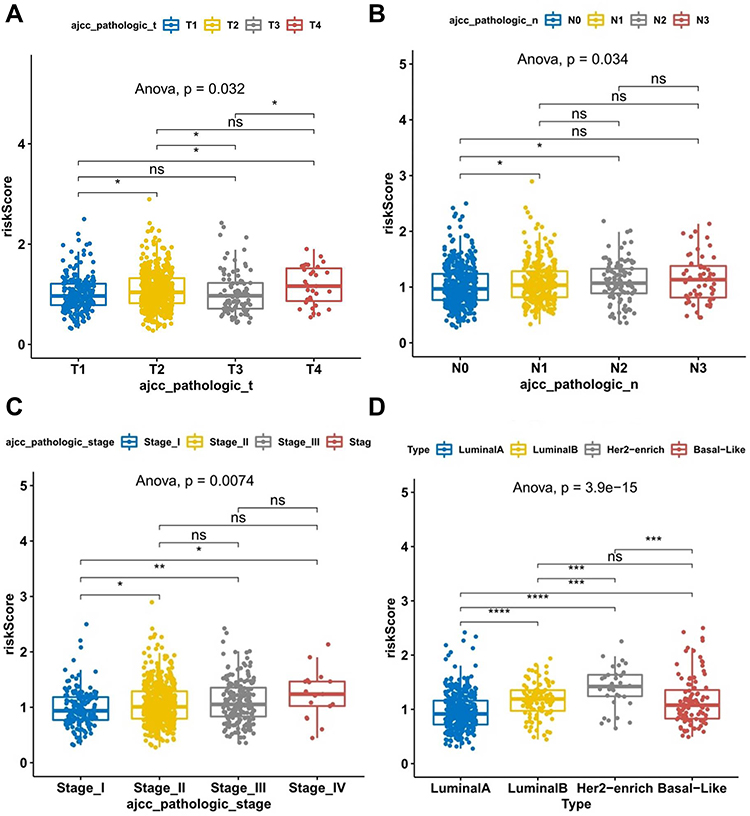 |
Figure 4 Scatter dot plot shows the association between risk score of TCGA breast cancer samples and clinical characteristics. (A) Risk scores in the different pathologic T stages of BC. (B) Risk scores in the different pathologic N stages of BC. (C) Risk scores in the different pathologic stages of BC. (D) Risk scores of different BC subtypes. *P < 0.05; **P < 0.01; ***P < 0.001; ****P < 0.0001. Abbreviations: BC, breast cancer; TCGA, The Cancer Genome Atlas. |
Furthermore, we performed stratified survival analysis in the TCGA-training set, TCGA-test set, and independent external validation set, respectively, to explore whether the prognostic value of the risk score was applicable to other clinical factors. All patients were divided into designated subgroups based on clinical characteristics in the corresponding datasets. BRCA samples in the TCGA-training set and -test set were analyzed stratified according to age, gender, pathologic T-stage, pathologic N-stage, pathologic M-stage, and pathologic tumor stage. In the TCGA-training set, the 2-gene signature was useful in >60 years, female, T2, T3, N2, N3, M0, and stage III subgroups, with clinically and statistically significant prognostic value (Supplementary Figure 4). In the TCGA-test set, the prognostic model was able to significantly differentiate the clinical outcomes of patients in the <60 years, female, N3, M1, and stage IV subgroups (Supplementary Figure 5). BRCA samples in the independent external validation set were analyzed stratified according to age, gender, metastatic events, regional recurrence or not, adjuvant chemotherapy, pathologic N stage, pathologic M stage, pathologic tumor stage, and subtype. In the independent external validation set, the 2-gene signature had clinically and statistically significant prognostic value in the <60, female, no regional recurrence, N0, and type I subgroups (Supplementary Figure 6).
The Independent Utility of the Prognostic Classifier
First, univariate Cox regression analysis indicated that age, tumor stage, AJCC pathologic stage, AJCC pathologic TNM stage, and risk score were correlated with OS (Figure 5A). Subsequent multivariate Cox regression analysis suggested that age, AJCC pathologic stage, and risk score could serve as independent prognostic factors (Figure 5B). A nomogram was derived based on the Cox regression analysis results that employed four independent prognostic factors to predict the prognosis of patients with BRCA in TCGA database (Figure 5C). The concordance index of the nomogram was 0.739. The calibration curves suggested that the nomogram (combined model) was possibly under- or overestimating the mortality (Figure 5D). Decision curve analysis (DCA) evidenced that the combined model exhibited the best net returns for the 5-year OS as opposed to 3-year OS (Figures 5E and F). Regrettably, we were unable to capture the net returns of the combined model on 1-year OS, possibly owing to the inadequacy of the 1-year OS data. Collectively, these results indicated that the nomogram constructed using a combined model may be the optimal nomogram in predicting long-term survival (5 years) for patients with BRCA as compared to the nomogram obtained using individual prognostic factors, which may assist in clinical management.
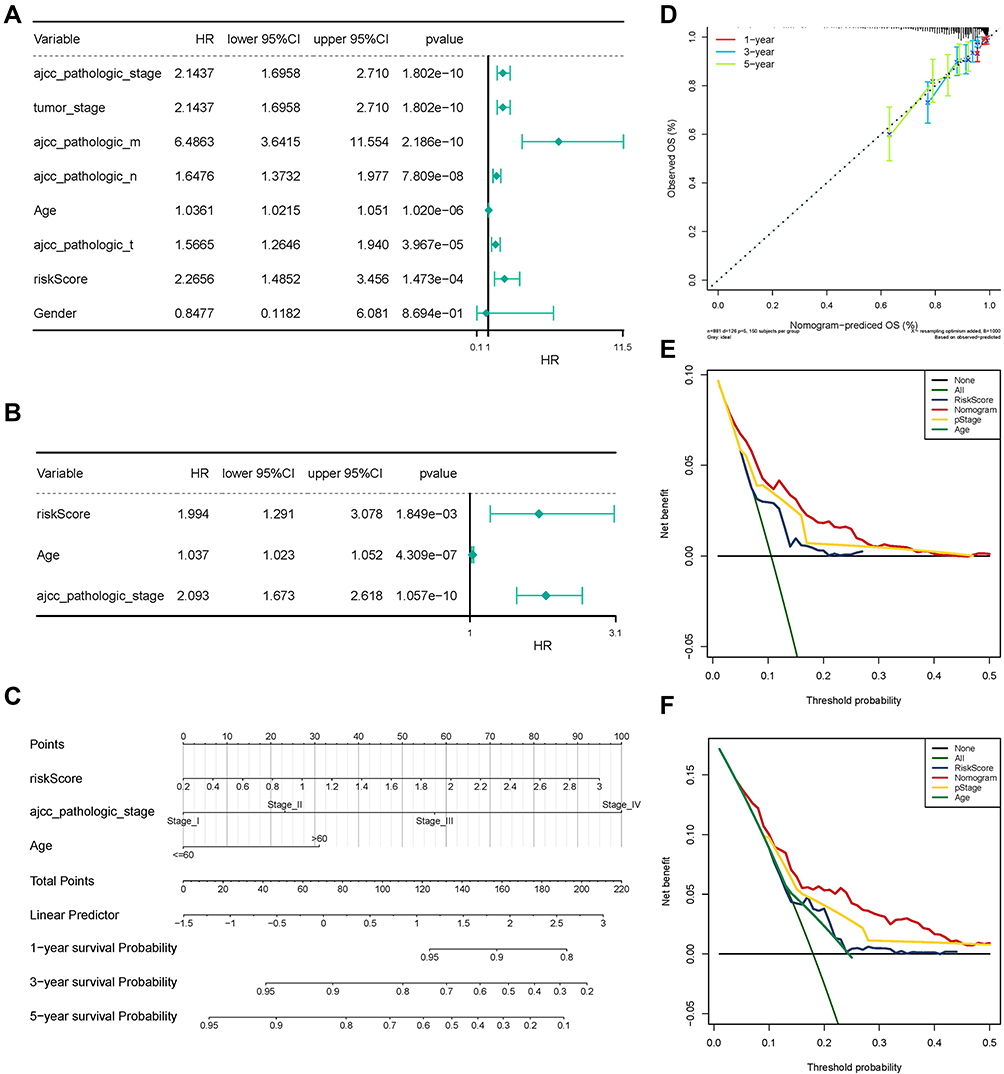 |
Figure 5 The Independent Utility of the Prognostic Classifier. (A) Univariate Cox regression analysis of clinical features and the prognostic signature. (B) Multivariate Cox regression analysis of clinical features and the prognostic signature. (C) Nomogram to predict survival probability at 1, 3, and 5 years. (D) The calibration curves for the nomogram. (E) The 3-year decision curve for the nomogram and other clinical traits. (F) The 5-year decision curve for the nomogram and other clinical traits. Abbreviation: COX analysis, Cox proportional hazards model. |
Validation of Prognostic Genes Based on Clinical Samples
We performed qRT-PCR analysis to assess the expression levels of the two genes used to construct our prognostic model. Consistent with the results of the biochemical analysis, SORBS1 was significantly downregulated in the tumor samples as compared to the adjacent healthy samples (Figure 6A), while SDC1 was markedly overexpressed in the tumor samples (Figure 6B). Furthermore, we performed Western blot analysis and found that protein expression of SORBS1 was downregulated in BRCA (Figures 6C), and the protein expression level of SDC1 was upregulated in BRCA (Figure 6D). The results of immunohistochemistry showed positive staining for SORBS1 and SDC1 proteins in a brown or tan color, which revealed the localization of SORBS1 and SDC1 to be in the cytoplasm/membrane of BRCA tissue and adjacent normal breast tissue, respectively (Figure 6E and F). The AOD of SORBS1 was higher in the adjacent healthy group as compared to the BRCA group (Figure 6G; P < 0.05). The AOD of SDC1 protein was significantly higher in the BRCA group than in the adjacent healthy group (Figure 6H; P < 0.05). Besides, we explored the protein expression levels of these prognostic genes in BRCA using the HPA database. Consistently, protein levels of SDC1 were not expressed in normal breast tissue, while moderate expression levels of this gene were observed in breast cancer tissue (Supplementary Figure 7A); meanwhile, moderate protein expression levels of SORBS1 were observed in normal breast tissue, while low protein expression levels of these genes were observed in breast cancer tissue (Supplementary Figure 7B). In conclusion, the present results suggested that the transcriptional and translational expression levels of SDC1 were overexpressed in BRCA patients while SORBS1 were overexpressed in normal tissues.
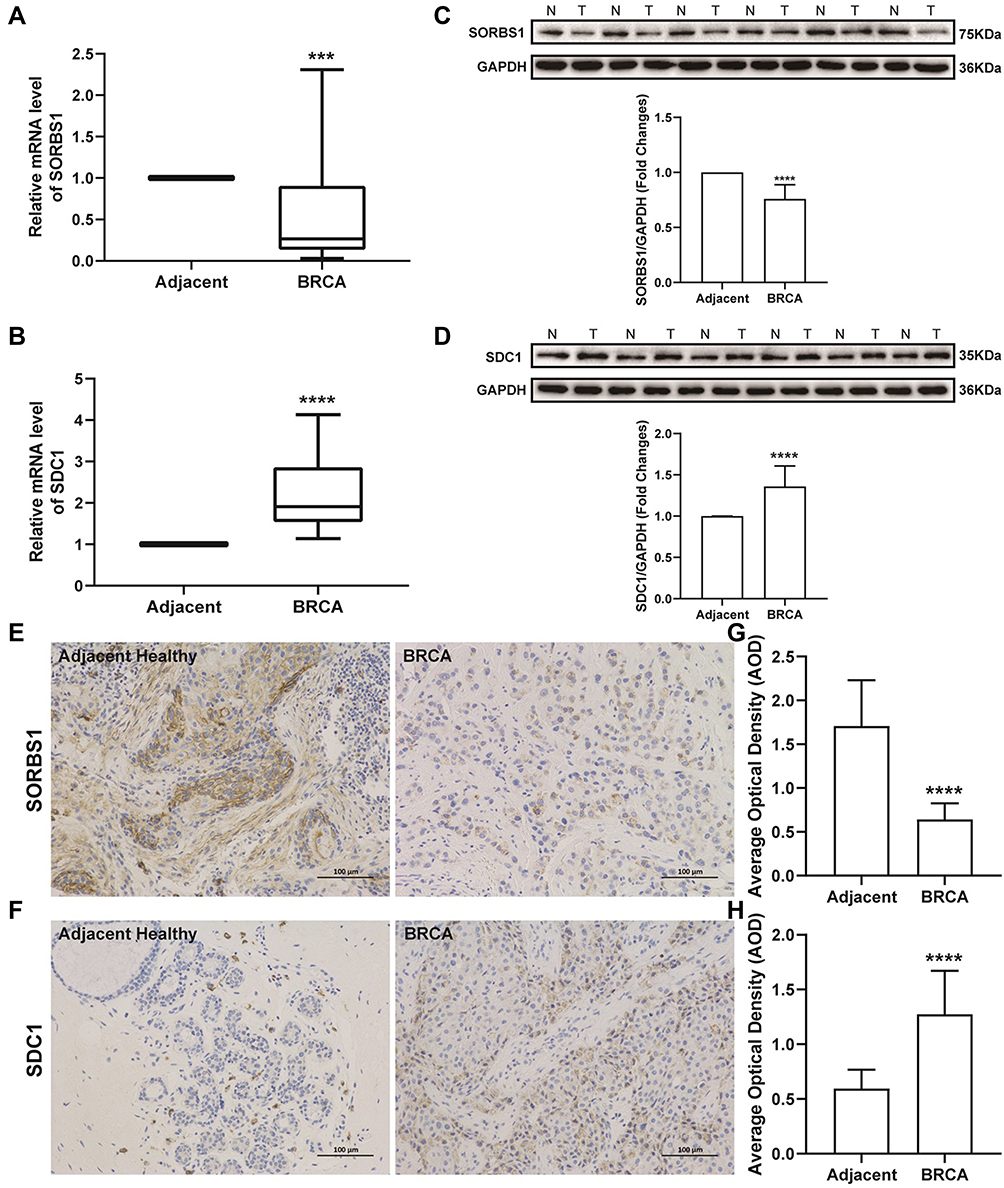 |
Figure 6 Expression levels of SORBS1 and SDC1 proteins in clinical samples. (A) Expression levels of SORBS1 measured by qRT-PCR analysis. (B) Expression levels of SDC1 measured by qRT-PCR analysis. (C) Representative image of Western blot analysis of SORBS1 protein. N, Adjacent healthy samples; T, BRCA samples. (D) Representative image of Western blot analysis of SDC1 protein. (E) Immunohistochemical staining (SORBS1 protein) of BRCA and adjacent healthy groups; magnification, ×200. (F) Immunohistochemical staining (SDC1 protein) of BRCA and adjacent healthy groups; magnification, ×200. (G and H) The AOD of SORBS1 and SDC1 protein in BRCA and adjacent healthy groups. Mean ± SEM; n = 30; ***P < 0.001 vs adjacent healthy; ****P < 0.0001 vs adjacent healthy. Abbreviations: SORBS1, sorbin and SH3 domain containing 1; SDC1, Syndecan-1; AOD, average optical density. |
CMap Analysis Identified Novel Candidate Compounds Targeting the Prognostic Genes
To identify potential compounds capable of targeting prognostic lipid metabolism-related genes (SDC1 and SORBS1), we screened a total of 76 compounds that met the |enrichment score| > 0.5, P < 0.05 by the CMap02 database (Supplementary Table 17). Unfortunately, only 37 of the 76 compounds could be traced in the CLUE tool. The 37 compounds that were able to inhibit prognostic gene expression as described above are illustrated in Supplementary Figure 8A. Subsequent CMap MoA analysis revealed 44 mechanisms of action common to the above compounds. Amitriptyline was involved in four MoAs, including norepinephrine inhibitor, norepinephrine reuptake inhibitor, serotonin receptor agonist, and serotonin reuptake inhibitor, while the MoAs involving acetylcholine release stimulant, acetylcholinesterase inhibitor, butyrylcholinesterase inhibitor, and potassium channel antagonist were all modulated by the compound tacrine. Furthermore, a total of 11 compounds shared the following six mechanisms: 1) adrenergic receptor agonist, 2) bacterial cell wall synthesis inhibitor, 3) glucocorticoid receptor agonist, 4) histone deacetylase (HDAC) inhibitor, 5) progesterone receptor agonist, and 6) sterol demethylase inhibitor.
Prognostic Gene-Drug Interaction Network Analysis
Interactions between prognostic genes and drugs used for cancer treatment were probed through the CTD database and visualized via Cytoscape. As depicted in Supplementary Figure 8B, there were 50 and 42 drugs that affected the expression of SDC1 and SORBS1, respectively, of which 16 drugs regulated the expression of both prognostic genes. For instance, abrine reduced the SDC1 expression levels, while upregulating the SORBS1 expression (Supplementary Table 18).
SDC1 Could Promote the Migration and Invasion of Breast Cancer Cells
To verify transduction efficacy, RT-PCR and Western blot were used to detect the expression of SDC1 following 24 h of transduction (Figure 7A and B). To explore the effect of SDC1 on breast cell invasion and migration, transwell invasion assays and wound healing assays were performed. Transwell invasion assays demonstrated that si-SDC1 could reduce the invasion ability of MCF-7 and MDA-MB-231 cells and oe-SDC1 could enhance the invasion ability of MCF-7 and MDA-MB-231 cells in vitro (Figure 7C and D). The wound healing assays demonstrated that the migratory abilities of MCF-7 and MDA-MB-231 cells were significantly suppressed following transfection of si-SDC1 (Figure 7E and F). Similarly, compared with the corresponding negative control groups, the speed of wound closure was significantly faster in the MCF-7 and MDA-MB-231 cells transfected with SDC1 plasmid (Figure 7E and F). These results suggest that SDC1 can increase the invasiveness of breast cancer cells.
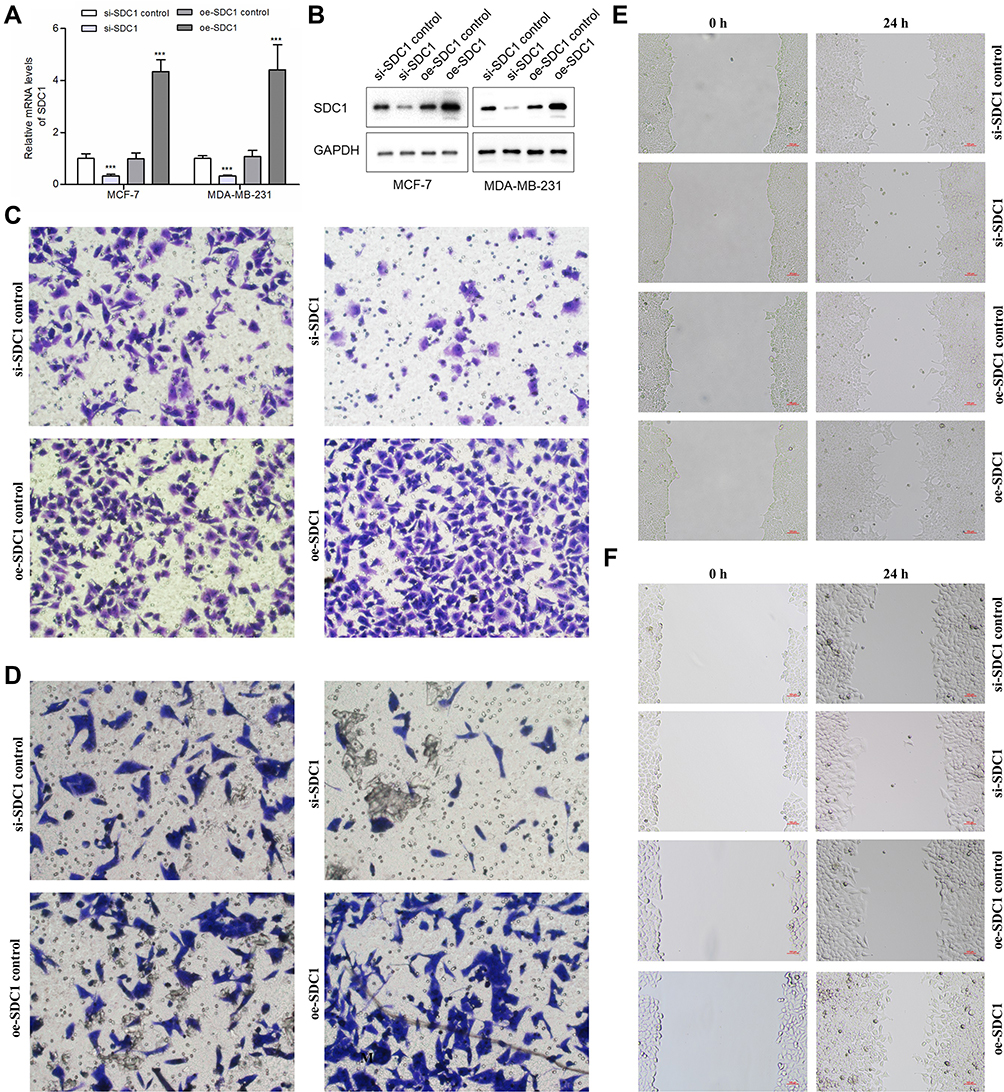 |
Figure 7 Effects of SDC1 knockdown or overexpression on BC cells’ invasion and migration. (A) Quantitative PCR analysis of SDC1 expression levels in si-SDC1 control, si-SDC1, oe-SDC1 control and oe-SDC1 breast cancer cell lines (MCF-7 and MDA-MB-231). (B) Western blot of SDC1 expression levels in si-SDC1 control, si-SDC1, oe-SDC1 control and oe-SDC1 breast cancer cell lines (MCF-7 and MDA-MB-231). (C) Effects of SDC1 knockdown or overexpressed on invasion of MDA-MB-231 breast cancer cells. (D) Effects of SDC1 knockdown or overexpressed on invasion of MCF-7 breast cancer cells. (E) Effects of SDC1 knockdown or overexpressed on migration of MDA-MB-231 breast cancer cells showed by scratch assays. (F) Effects of SDC1 knockdown or overexpressed on migration of MCF-7 breast cancer cells showed by scratch assays. ***:P < 0.001. |
SORBS1 Could Inhibit the Migration and Invasion of Breast Cancer Cells
To verify transduction efficacy, qRT-PCR and Western blot were used to detect the expression of SOBRS1 following 24h of transduction (Figure 8A and B). In the transwell invasion assays, the invasion ability of MCF-7 and MDA-MB-231 cells in the si-SORBS1 group was significantly increased compared with si-SORBS1 control group, and the invasion ability of MCF-7 and MDA-MB-231 cells in the oe-SORBS1 control groups was significantly increased compared with oe-SORBS1 groups (Figure 8C and D). The wound healing assays demonstrated that the migratory abilities of MCF-7 and MDA-MB-231 cells were significantly promoted following transfection of si-SORBS1 (Figure 8E and F). Similarly, the speed of wound closure was significantly slower in the MCF-7 and MDA-MB-231 cells transfected with SORBS1 plasmid comparing with the negative control groups (Figure 8E and F). Taken together, SORBS1 inhibits the migration and invasion of breast cancer cells, and SORBS1 depletion conversely promotes the migration and invasion of breast cancer cells.
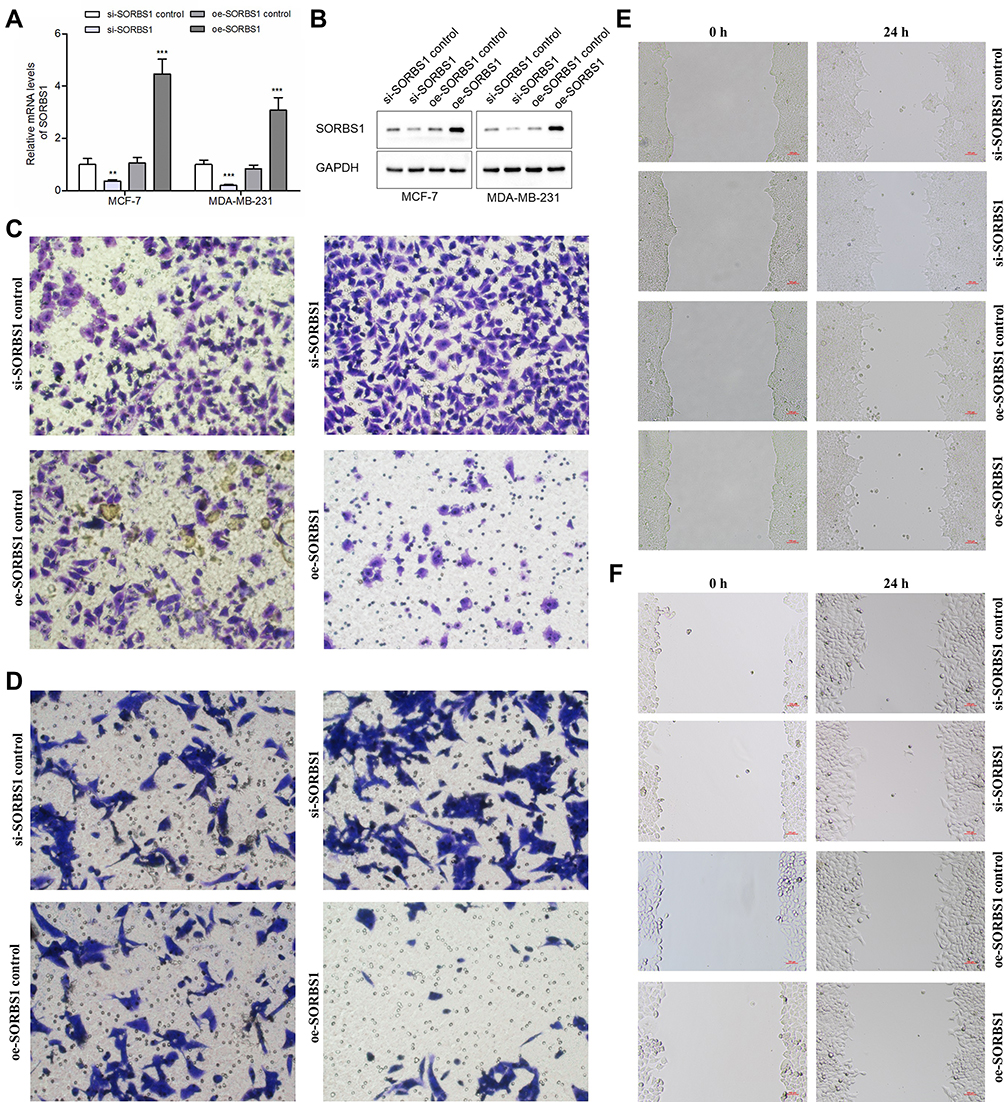 |
Figure 8 Effects of SORBS1 knockdown or overexpression on BC cells’ invasion and migration. (A) Quantitative PCR analysis of SORBS1 expression levels in si-SORBS1 control, si-SORBS1, oe-SORBS1 control and oe-SORBS1 breast cancer cell lines (MCF-7 and MDA-MB-231). (B) Western blot of SORBS1 expression levels in si-SORBS1 control, si-SORBS1, oe-SORBS1 control and oe-SORBS1 breast cancer cell lines (MCF-7 and MDA-MB-231). (C) Effects of SORBS1 knockdown or overexpressed on invasion of MDA-MB-231 breast cancer cells. (D) Effects of SORBS1 knockdown or overexpressed on invasion of MCF-7 breast cancer cells. (E) Effects of SORBS1 knockdown or overexpressed on migration of MDA-MB-231 breast cancer cells showed by scratch assays. (F) Effects of SORBS1 knockdown or overexpressed on migration of MCF-7 breast cancer cells showed by scratch assays. **:P < 0.01; ***:P < 0.001. |
Discussion
The high annual incidence rate of BRCA has a serious impact on human health and the social economy.48 Detection of BRCA at an early stage is a critical step for successful treatment and improvement of the prognosis.49 The transformation of metabolic pattern is one of the important characteristics of tumor cells. A number of studies have found that tumor cells will undergo lipid metabolism reprogramming to meet the needs of rapid proliferation.50,51 Because the tumor microenvironment is rich in adipokines, abnormal lipid metabolism plays a more important role in breast cancer than other malignant tumors. In recent years, great achievements have been made in abnormal lipid metabolism in tumors.12,19 Lipid molecules with the diagnostic potential for BRCA are constantly being discovered.12,52 Studies have found that the abnormal lipid metabolism of BRCA cells is closely related to their resistance to HER2 inhibitors and CDK4/6 inhibitors.53 In addition, some studies have reported changes of phospholipids in the plasma, serum,54,55 and urine56,57 of BRCA patients. However, lipid metabolism involves both exogenous and endogenous processes, and its impact on BRCA risk and prognosis needs to be further determined. Thus, lipid metabolism-related genes in BRCA may be a breakthrough point that can further improve the prognosis of breast cancer patients.
In this study, a risk assessment classifier closely related to the prognosis of BRCA was constructed through the analysis of differentially expressed lipid metabolism-related genes with prognostic value in BRCA and revealed the correlation between BRCA and lipid metabolism. We not only used the GEO database, but also the cell function experiments and the clinical data of tissue samples to verify that this prognostic classifier can offer good clinical application value.
In addition, we analyzed the correlation between the prognostic classifier and pathological conditions and clinical characteristics and found that the risk of TNBC was significantly higher. TNBC is histologically defined as lacking estrogen and progesterone receptors (ER/PR) and human epidermal growth factor receptor 2 (HER2) amplification, it is a subtype of BRCA with the worst prognosis and highest risk because of the lack of effective therapeutic targets.58,59 However, no targeted drugs for TNBC have been discovered so far.60,61 At present, the main systemic treatment for TNBC is still chemotherapy.62 Antibody drug conjugates (ADCs), immune-oncology (I/O) therapies, and polyadenosine diphosphate-ribose polymerase (PARP) inhibitors have joined the armamentarium against specific types of TNBC but have limited durable efficacy in TNBC patients.63 Our findings may provide information for the development of drugs that target lipid metabolism genes, thus, making it possible to find new pathways in the treatment of TNBC.
In order to further explore the mechanism of the lipid metabolism DEGs related to BRCA survival, we performed network analysis using IPA and KEGG and GO enrichment analysis on the 13 genes selected. We found that PPAR signaling pathways and adipokine signaling pathways had the highest correlation with these genes, and IPA uncovered a significant enrichment of lipid metabolism pathways and estrogen-dependent BRCA signaling. Moreover, the effect of PPAR signaling pathway and estrogen-dependent signaling in BRCA was previously confirmed and the related drugs are in clinical application,64–67 so these results verified our research’s directions and methods are scientific from the other side. The top GO terms involved in lipid metabolism were “lipid droplet” and “external side of the plasma membrane.” Adipokine signaling pathways are the main pathways of lipid metabolism, and their relevance to tumors has been confirmed in many studies.68–71 They play an independent and combined role in the activation of intracellular signaling networks related to the malignant phenotype of BRCA cells.72 The GO term “external side of the plasma membrane” has also been reported to be associated with testicular cancer.73 Lipid droplets74 are the natural immune center that integrates cell metabolism and host defense and are gradually being recognized as a prominent feature of many cancers.75,76 Studies have reported that lipid droplet and the PPAR signaling pathway are closely related to the metastasis of TNBC.77–79 Furthermore, lipid droplets have been found to have increased expression in drug-resistant TNBC cells.21 In addition, based on the current progress of immunotherapy for BRCA and the increasing recommendation of immunotherapy in the treatment regimen of TNBC,80 although our functional enrichment analysis did not indicate that the lipid metabolism-related DEGs were related to immune cells, we still calculated the correlation between SDC1 and SORBS1 and immune cells based on TIMER database, but no positive result was obtained. This means that SDC1 and SORBS1 do not affect the prognosis of BRCA through immune function pathway, which also suggests that it may be a new direction for us to explore the diagnosis and treatment of BRCA from the factors related to lipid metabolism. These findings have a certain correlation with the poor prognosis of TNBC in the prognostic classifier we established in this study and support the development of therapies for TNBC targeting lipid metabolism.
The genes we used for prognostic classifier constructing were SORBS1 and SDC1. SORBS1 encodes a CasitasB.1ineagelymphoma (CBL)–associated protein that functions in the signaling and stimulation of insulin, and it also been confirmed to be related to COPD.81–83 Studies have found that SORBS1 can participate in immune-related gene signal transduction, and its increased expression is closely related to poor prognosis in cervical cancer,84 gastric cancer,85 prostate cancer,86 and colorectal cancer.87 However, the exact role and diagnostic significance of SORBS1 in BRCA are not yet clear. Syndecan-1 (SDC1, also known as CD138) is a key regulator of fatty acid synthesis and catalyzes the formation of mono-unsaturated fatty acids (MUFA) from saturated fatty acids (SFA).88–91 SDC1 has been implicated in various cancers, including BRCA.92–95 The inactivation of SDC1 can lead to the consumption of unsaturated fatty acids, thereby inhibiting cancer cells.91,96,97 However, the imbalance in the ratio of saturated to unsaturated fat can lead to a cellular stress response and death in both normal and transformed cells.91,98 Therefore, although SDC1 has potential as a biomarker, its complex relationship with the body limits its clinical application.99–101 In this study, we constructed a prognostic classifier based on SORBS1, which is currently less studied, and SDC1, which has a complex effect on the body. In addition, we examined the correlation between invasiveness and expression of SDC1 and SORBS1 in MCF-7 and MDA-MB-231 breast cancer cell lines by cell function experiments. This is the first prognostic classifier that combines the two genes in order to jointly assess their prognostic risk in BRCA and this classifier can change the limited application status of SDC1 and SORBS1.
Through the CMap02 database, we screened potential drugs that target genes related to lipid metabolism as a means to control the progression of BRCA. We also used the CTD database to explore the interaction between selected prognostic genes and cancer treatment drugs. We found that vorinostat, abrine, and NSC 689534 are very promising drugs. Vorinostat is a simple molecule histone deacetylase (HDAC) inhibitor which has both oral and vena formulation. The main indication currently approved by the FDA is the treatment of skin T-cell lymphoma and its combination with pembrolizumab (a monoclonal anti-PD1 antibody) can increases the response rate of head and neck malignancies to immunotherapy.102 Whereas, pembrolizumab combined with standard chemotherapy plays an important role in the treatment of advanced TNBC, and this may mean that we can try adding vorinostat to this treatment to increase the tumor response rate to pembrolizumab. In addition, the main metabolic pathway of vorinostat is via hydroxamic acid glucuronidation and oxidative cleavage of the aliphatic methylene chain.67 This confirms our findings that this drug may be effective in treating BRCA patients carrying the prognosis-related lipid metabolism genes we screened. Abrine is an alkaloid, and the main component of the traditional Chinese medicine cochinchinensis.103 In addition, abrine has a structure that can form hydrogen bonds with peroxisome PPARs, thereby affecting the PPAR pathway.104 Our analysis found that abrine reduces the expression level of SDC1 while increasing the expression of SORBS1, which indicated that it may have a dual protective effect on BRCA patients. The inhibitory effect of abrine on BRCA cells has been confirmed in several in vitro experiments.105,106 It is our hope that our research results can prompt experts in the field of chemistry and pharmacy to pay attention to this compound with therapeutic potential. NSC 689534 (2-pyridinecarbaldehyde N, N-bis (2-pyridinylmethyl) thiosemicarbazone) is a member of the heterocyclic thiosemicarbazone family of compounds, and its biological activity is significantly different between the unbound state and the metal-bound state.107,108 In recent years, there have been reports about the effects of these drugs on human cancer, but most of them are pharmacological studies. It is found that the chelating ability of thiosemicarbazone NSC 689534 can induce oxidative/ER stress and inhibit tumor growth in vitro and in vivo.108 Our findings suggest that NSC 689534 is a potential drug for the treatment of BRCA which is worthy of further preclinical investigation.
Our analysis provides a reference for the prognosis of BRCA patients, a basis for the diagnosis and treatment of patients, and a new research direction for BRCA research. This study still has some certain limitations, these results are preliminary that mainly based on the secondary mining and analysis of previously published datasets. Although PCR experiments, Western blot experiments, immunohistochemistry experiments and cell function experiments were performed in this study to initially validate the association between the two genes and breast cancer, we still need to conduct prospective studies in order to further verify the clinical applicability of this prognostic classifier.
Conclusions
In summary, we have constructed a prognostic classifier of BRCA based on two lipid metabolism-related genes: SDC1 and SORBS1. This classifier has a value in predicting the disease-free survival rate of BRCA patients and identifying high-risk patients. Our results strengthen the underestimated role of abnormal tumor lipid metabolism in the prognosis of BRCA. The translational application of this classifier will guide clinicians to make a more informed decision regarding adjuvant systemic treatments and choosing follow-up plan.
Abbreviations
qRT-PCR, Real-Time Quantitative Reverse Transcription PCR; SDC1, Syndecan-1;TNBC, triple negative breast cancer; AMPK, Adenosine 5‘-monophosphate (AMP)-activated protein kinase; AUC, area Under Curve; COPD, chronic obstructive pulmonary disease; EDTA, Ethylene Diamine Tetraacetic Acid; GAPDH, glyceraldehyde-3-phosphate dehydrogenase; MIF, Macrophage Migration Inhibitory Factor; SDS-PAGE, sodium dodecyl sulfate polyacrylamide gel electrophoresis; AJCC, American Joint Committee on Cancer; BRCA, breast cancer; CMap, Connectivity Map; CTD, Comparative Toxicogenomics Database; DEGs, differentially expressed genes; GEO, Gene Expression Omnibus; GO, Gene Ontology; IPA, Ingenuity Pathway Analysis; PPARs, proliferator-activated receptors; TCGA, The Cancer Genome Atlas.
Data Sharing Statement
Some or all data, models, or code generated or used during the study are available from the corresponding author by request.
Ethics Statement
Written informed consent was obtained from the patients/participants for publication of this article. The studies involving human participants were reviewed and approved by the Ethics Committee of the First Affiliated Hospital of Zhengzhou University.
Acknowledgments
We thank the experimental platform of Translational Medicine Center of the First Affiliated Hospital of Zhengzhou University for supporting this study. And we thank LetPub (www.letpub.com) for its linguistic assistance during the preparation of this manuscript.
Author Contributions
All authors made a significant contribution to the work reported, whether that is in the conception, study design, execution, acquisition of data, analysis and interpretation. All authors gave final approval of the version to be published and agreed to be accountable for all aspects of the work.
Funding
Health Commission of Henan Province, Youth Project of Medical Science and Technology Project of Henan Province, Award Number: SBGJ202103070; Recipient: Nan Wang, M.D. Science and Technology Department of Henan Province; Award Number: LHGJ20200356; Recipient: Nan Wang, M.D.
Disclosure
The authors declare that the research was conducted in the absence of any commercial or financial relationships that could be construed as a potential conflict of interest.
References
1. Sung H, Ferlay J, Siegel RL, et al. Global cancer statistics 2020: GLOBOCAN estimates of incidence and mortality Worldwide for 36 cancers in 185 Countries. A Cancer J Clin. 2021;71(3):209–249. doi:10.3322/caac.21660
2. Britt KL, Cuzick J, Phillips KA. Key steps for effective breast cancer prevention. Nat Rev Cancer. 2020;20(8):417–436. doi:10.1038/s41568-020-0266-x
3. Thorat MA, Balasubramanian R. Breast cancer prevention in high-risk women. Best Pract Res Clin Obstet Gynaecol. 2020;65:18–31. doi:10.1016/j.bpobgyn.2019.11.006
4. Paluch-Shimon S, Cardoso F, Partridge AH, et al. ESO-ESMO 4th international consensus guidelines for breast cancer in young women (BCY4). Annals Oncol. 2020;31(6):674–696. doi:10.1016/j.annonc.2020.03.284
5. Jin G, Lv J, Yang M, et al. Genetic risk, incident gastric cancer, and healthy lifestyle: a meta-analysis of genome-wide association studies and prospective cohort study. Lancet Oncol. 2020;21(10):1378–1386. doi:10.1016/S1470-2045(20)30460-5
6. Carr PR, Weigl K, Edelmann D, et al. Estimation of absolute risk of colorectal cancer based on healthy lifestyle, genetic risk, and colonoscopy status in a population-based study. Gastroenterology. 2020;159(1):129–138.e129. doi:10.1053/j.gastro.2020.03.016
7. Johnson KE, Siewert KM, Klarin D, et al. The relationship between circulating lipids and breast cancer risk: a Mendelian randomization study. PLoS Med. 2020;17(9):e1003302. doi:10.1371/journal.pmed.1003302
8. McLaughlin SA, Brunelle CL, Breast Cancer-Related TA. Lymphedema: risk factors, screening, management, and the impact of locoregional treatment. J Clin Oncol. 2020;38(20):2341–2350. doi:10.1200/JCO.19.02896
9. Caffa I, Spagnolo V, Vernieri C, et al. Fasting-mimicking diet and hormone therapy induce breast cancer regression. Nature. 2020;583(7817):620–624. doi:10.1038/s41586-020-2502-7
10. Corn KC, Windham MA, Rafat M. Lipids in the tumor microenvironment: from cancer progression to treatment. Prog Lipid Res. 2020;80:101055. doi:10.1016/j.plipres.2020.101055
11. Bleve A, Durante B, Sica A, Consonni FM. Lipid metabolism and cancer immunotherapy: immunosuppressive myeloid cells at the crossroad. Int J Mol Sci. 2020;21(16):5845. doi:10.3390/ijms21165845
12. Guo R, Chen Y, Borgard H, et al. The function and mechanism of lipid molecules and their roles in the diagnosis and prognosis of breast cancer. Molecules. 2020;25(20):4864. doi:10.3390/molecules25204864
13. Pang B, Zhu Y, Ni J, et al. Extracellular vesicles: the next generation of biomarkers for liquid biopsy-based prostate cancer diagnosis. Theranostics. 2020;10(5):2309–2326. doi:10.7150/thno.39486
14. Mukherjee A, Chiang CY, Daifotis HA, et al. Adipocyte-induced FABP4 expression in ovarian cancer cells promotes metastasis and mediates carboplatin resistance. Cancer Res. 2020;80(8):1748–1761. doi:10.1158/0008-5472.CAN-19-1999
15. Auciello FR, Bulusu V, Oon C, et al. A stromal lysolipid-autotaxin signaling axis promotes pancreatic tumor progression. Cancer Discov. 2019;9(5):617–627. doi:10.1158/2159-8290.CD-18-1212
16. Wu L, Zhang X, Zheng L, et al. RIPK3 orchestrates fatty acid metabolism in tumor-associated macrophages and hepatocarcinogenesis. Cancer Immunol Res. 2020;8(5):710–721. doi:10.1158/2326-6066.CIR-19-0261
17. Wang J, Shidfar A, Ivancic D, et al. Overexpression of lipid metabolism genes and PBX1 in the contralateral breasts of women with estrogen receptor-negative breast cancer. Int J Cancer. 2017;140(11):2484–2497. doi:10.1002/ijc.30680
18. Balaban S, Shearer RF, Lee LS, et al. Adipocyte lipolysis links obesity to breast cancer growth: adipocyte-derived fatty acids drive breast cancer cell proliferation and migration. Cancer Metab. 2017;5(1):1. doi:10.1186/s40170-016-0163-7
19. Marino N, German R, Rao X, et al. Upregulation of lipid metabolism genes in the breast prior to cancer diagnosis. NPJ Breast Cancer. 2020;6(1):50. doi:10.1038/s41523-020-00191-8
20. Havas KM, Milchevskaya V, Radic K, et al. Metabolic shifts in residual breast cancer drive tumor recurrence. J Clin Invest. 2017;127(6):2091–2105. doi:10.1172/JCI89914
21. Sirois I, Aguilar-Mahecha A, Lafleur J, et al. A unique morphological phenotype in chemoresistant triple-negative breast cancer reveals metabolic reprogramming and PLIN4 expression as a molecular vulnerability. Mol Cancer Res. 2019;17(12):2492–2507. doi:10.1158/1541-7786.MCR-19-0264
22. Jin X, Demere Z, Nair K, et al. A metastasis map of human cancer cell lines. Nature. 2020;588(7837):331–336. doi:10.1038/s41586-020-2969-2
23. Heer E, Harper A, Escandor N, Sung H, McCormack V, Fidler-Benaoudia MM. Global burden and trends in premenopausal and postmenopausal breast cancer: a population-based study. Lancet Global Health. 2020;8(8):e1027–e1037. doi:10.1016/S2214-109X(20)30215-1
24. Demark-Wahnefried W, Rogers LQ, Gibson JT, et al. Randomized trial of weight loss in primary breast cancer: impact on body composition, circulating biomarkers and tumor characteristics. Int J Cancer. 2020;146(10):2784–2796. doi:10.1002/ijc.32637
25. Hultsch S, Kankainen M, Paavolainen L, et al. Association of tamoxifen resistance and lipid reprogramming in breast cancer. BMC Cancer. 2018;18(1):850. doi:10.1186/s12885-018-4757-z
26. Chen Q, Meng X, Liao Q, Chen M. Versatile interactions and bioinformatics analysis of noncoding RNAs. Brief Bioinform. 2019;20(5):1781–1794. doi:10.1093/bib/bby050
27. Yan X, He B, Hu L, Gao J, Chen S, Jiang G. Insight into the endocrine disrupting effect and cell response to butyltin compounds in H295R cell: evaluated with proteomics and bioinformatics analysis. Sci Total Environ. 2018;628:1489–1496. doi:10.1016/j.scitotenv.2018.02.165
28. Chang JW, Kuo WH, Lin CM, et al. Wild-type p53 upregulates an early onset breast cancer-associated gene GAS7 to suppress metastasis via GAS7-CYFIP1-mediated signaling pathway. Oncogene. 2018;37(30):4137–4150. doi:10.1038/s41388-018-0253-9
29. Kao KJ, Chang KM, Hsu HC, Huang AT. Correlation of microarray-based breast cancer molecular subtypes and clinical outcomes: implications for treatment optimization. BMC Cancer. 2011;11(1):143. doi:10.1186/1471-2407-11-143
30. Shahid M, Mubeen A, Tse J, et al. Branched chain in situ hybridization for albumin as a marker of hepatocellular differentiation: evaluation of manual and automated in situ hybridization platforms. Am J Surg Pathol. 2015;39(1):25–34. doi:10.1097/PAS.0000000000000343
31. Ritchie ME, Phipson B, Wu D, et al. limma powers differential expression analyses for RNA-sequencing and microarray studies. Nucleic Acids Res. 2015;43(7):e47. doi:10.1093/nar/gkv007
32. Hasegawa M, Takahashi H, Rajabi H, et al. Functional interactions of the cystine/glutamate antiporter, CD44v and MUC1-C oncoprotein in triple-negative breast cancer cells. Oncotarget. 2016;7(11):11756–11769. doi:10.18632/oncotarget.7598
33. Yi S, Zhang H, Gong L, et al. Deep sequencing and bioinformatic analysis of lesioned sciatic nerves after crush injury. PLoS One. 2015;10(12):e0143491. doi:10.1371/journal.pone.0143491
34. Cai B, Ma W, Ding F, et al. The long noncoding RNA CAREL controls cardiac regeneration. J Am Coll Cardiol. 2018;72(5):534–550. doi:10.1016/j.jacc.2018.04.085
35. Jin L, Qin C, Qi X, Hong T, Yang X, Zhu X. Clinicopathological significance of Sox10 expression in triple-negative breast carcinoma; 2020.
36. Hu J, Song K, Zhang J, Zhang Y, Tan BZ. Effects of menstrual blood‑derived stem cells on endometrial injury repair. Mol Med Rep. 2019;19(2):813–820. doi:10.3892/mmr.2018.9744
37. Chen F, Pan SX, Feng HL. [Distribution and content of transforming growth factor-β1 and vascular endothelial growth factor in each layer of concentrated growth factors]. Beijing da Xue Xue Bao Yi Xue Ban. 2016;48(5):860–865. Chinese.
38. Andrade Wde C, Silva LF, Coelho MC, Tannuri AC, Alves VA, Tannuri U. Effects of the administration of pentoxifylline and prednisolone on the evolution of portal fibrogenesis secondary to biliary obstruction in growing animals: immunohistochemical analysis of the expression of TGF-β and VEGF. Clinics. 2012;67(12):1455–1461. doi:10.6061/clinics/2012(12)17
39. Liao X, Zhu G, Huang R, et al. Identification of potential prognostic microRNA biomarkers for predicting survival in patients with hepatocellular carcinoma. Cancer Manag Res. 2018;10:787–803. doi:10.2147/CMAR.S161334
40. Liao X, Liu X, Yang C, et al. Distinct diagnostic and prognostic values of minichromosome maintenance gene expression in patients with hepatocellular carcinoma. J Cancer. 2018;9(13):2357–2373. doi:10.7150/jca.25221
41. Zhang C, Zheng Y, Li X, Hu X, Qi F, Luo J. Genome-wide mutation profiling and related risk signature for prognosis of papillary renal cell carcinoma. Ann Transl Med. 2019;7(18):427. doi:10.21037/atm.2019.08.113
42. Heagerty PJ, Zheng Y. Survival model predictive accuracy and ROC curves. Biometrics. 2005;61(1):92–105. doi:10.1111/j.0006-341X.2005.030814.x
43. Lin P, He RQ, Ma FC, et al. Systematic analysis of survival-associated alternative splicing signatures in gastrointestinal pan-adenocarcinomas. EBioMedicine. 2018;34:46–60. doi:10.1016/j.ebiom.2018.07.040
44. Sun D, Tian L, Zhu Y, et al. Subunits of ARID1 serve as novel biomarkers for the sensitivity to immune checkpoint inhibitors and prognosis of advanced non-small cell lung cancer. Mol Med. 2020;26(1):78. doi:10.1186/s10020-020-00208-9
45. Liu Y, Wu L, Ao H, et al. Prognostic implications of autophagy-associated gene signatures in non-small cell lung cancer. Aging. 2019;11(23):11440–11462. doi:10.18632/aging.102544
46. Liu GM, Zeng HD, Zhang CY, Xu JW. Identification of a six-gene signature predicting overall survival for hepatocellular carcinoma. Cancer Cell Int. 2019;19(1):138. doi:10.1186/s12935-019-0858-2
47. He Z, Wang C, Xue H, Zhao R, Li G. Identification of a metabolism-related risk signature associated with clinical prognosis in glioblastoma using integrated bioinformatic analysis. Front Oncol. 2020;10:1631. doi:10.3389/fonc.2020.01631
48. Wang N, Gu Y, Li L, et al. Circular RNA circMYO9B facilitates breast cancer cell proliferation and invasiveness via upregulating FOXP4 expression by sponging miR-4316. Arch Biochem Biophys. 2018;653:63–70. doi:10.1016/j.abb.2018.04.017
49. Jørgensen KJ, Paludan-Müller AS. Breast cancer screening and diagnosis. Ann Intern Med. 2020;172(12):838–839. doi:10.7326/L20-0253
50. Fhu CW, Ali A. Fatty acid synthase: an emerging target in cancer. Molecules. 2020;25(17):17. doi:10.3390/molecules25173935
51. Kim JA. Peroxisome metabolism in cancer. Cells. 2020;9:7. doi:10.3390/cells9071692
52. Zeleznik OA, Clish CB, Kraft P, Avila-Pacheco J, Eliassen AH, Tworoger SS. Circulating lysophosphatidylcholines, phosphatidylcholines, ceramides, and sphingomyelins and ovarian cancer risk: a 23-year prospective study. J Natl Cancer Inst. 2020;112(6):628–636. doi:10.1093/jnci/djz195
53. Feng WW, Kurokawa M. Lipid metabolic reprogramming as an emerging mechanism of resistance to kinase inhibitors in breast cancer. Cancer Drug Resist. 2020;3(1). doi:10.20517/cdr.22019.20100
54. Yang L, Cui X, Zhang N, et al. Comprehensive lipid profiling of plasma in patients with benign breast tumor and breast cancer reveals novel biomarkers. Anal Bioanal Chem. 2015;407(17):5065–5077. doi:10.1007/s00216-015-8484-x
55. Hammad LA, Wu G, Saleh MM, et al. Elevated levels of hydroxylated phosphocholine lipids in the blood serum of breast cancer patients. Rapid Commun Mass Spectrom. 2009;23(6):863–876. doi:10.1002/rcm.3947
56. Kim H, Min HK, Kong G, Moon MH. Quantitative analysis of phosphatidylcholines and phosphatidylethanolamines in urine of patients with breast cancer by nanoflow liquid chromatography/tandem mass spectrometry. Anal Bioanal Chem. 2009;393(6–7):1649–1656. doi:10.1007/s00216-009-2621-3
57. Min HK, Kong G, Moon MH. Quantitative analysis of urinary phospholipids found in patients with breast cancer by nanoflow liquid chromatography-tandem mass spectrometry: II. Negative ion mode analysis of four phospholipid classes. Anal Bioanal Chem. 2010;396(3):1273–1280. doi:10.1007/s00216-009-3292-9
58. Vagia E, Mahalingam D, Cristofanilli M. The landscape of targeted therapies in TNBC. Cancers. 2020;12(4):916. doi:10.3390/cancers12040916
59. Keenan TE, Tolaney SM. Role of immunotherapy in triple-negative breast cancer. J Natl Compr Cancer Netw. 2020;18(4):479–489. doi:10.6004/jnccn.2020.7554
60. Park SY, Choi JH, Nam JS. Targeting cancer stem cells in triple-negative breast cancer. Cancers. 2019;11(7):965. doi:10.3390/cancers11070965
61. Dees S, Ganesan R, Singh S, Grewal IS. Bispecific antibodies for triple negative breast cancer. Trends Cancer. 2021;7(2):162–173. doi:10.1016/j.trecan.2020.09.004
62. Garrido-Castro AC, Lin NU, Polyak K. Insights into molecular classifications of triple-negative breast cancer: improving patient selection for treatment. Cancer Discov. 2019;9(2):176–198. doi:10.1158/2159-8290.CD-18-1177
63. Huynh MM, Pambid MR, Jayanthan A, Dorr A, Los G, Dunn SE. The Dawn of targeted therapies for triple negative breast cancer (TNBC): a snapshot of investigational drugs in Phase I and II trials. Expert Opin Investig Drugs. 2020;29(11):1199–1208. doi:10.1080/13543784.2020.1818067
64. Tacconi EM, Badie S, De Gregoriis G, et al. Chlorambucil targets BRCA1/2-deficient tumours and counteracts PARP inhibitor resistance. EMBO Mol Med. 2019;11(7):e9982. doi:10.15252/emmm.201809982
65. Keung MY, Wu Y, Badar F, Vadgama JV. Response of breast cancer cells to PARP inhibitors is independent of BRCA status. J Clin Med. 2020;9:4. doi:10.3390/jcm9040940
66. Arun B, Akar U, Gutierrez-Barrera AM, Hortobagyi GN, Ozpolat B. The PARP inhibitor AZD2281 (Olaparib) induces autophagy/mitophagy in BRCA1 and BRCA2 mutant breast cancer cells. Int J Oncol. 2015;47(1):262–268. doi:10.3892/ijo.2015.3003
67. Chen XQ, Zhang F, Su QC, Zeng C, Xiao FH, Peng Y. Methylome and transcriptome analyses reveal insights into the epigenetic basis for the good survival of hypomethylated ER-positive breast cancer subtype. Clin Epigenetics. 2020;12(1):16. doi:10.1186/s13148-020-0811-1
68. Kisková T, Kassayová M. Resveratrol action on lipid metabolism in cancer. Int J Mol Sci. 2019;20(11):2704. doi:10.3390/ijms20112704
69. Xu H, Zhou S, Tang Q, Xia H, Bi F. Cholesterol metabolism: new functions and therapeutic approaches in cancer. Biochim Biophys Acta Rev Cancer. 2020;1874(1):188394. doi:10.1016/j.bbcan.2020.188394
70. Ondruskova N, Cechova A, Hansikova H, Honzik T, Jaeken J. Congenital disorders of glycosylation: still “hot” in 2020. Biochim Biophys Acta Gen Subj. 2021;1865(1):129751. doi:10.1016/j.bbagen.2020.129751
71. Guillaumond F, Bidaut G, Ouaissi M, et al. Cholesterol uptake disruption, in association with chemotherapy, is a promising combined metabolic therapy for pancreatic adenocarcinoma. Proc Natl Acad Sci U S A. 2015;112(8):2473–2478. doi:10.1073/pnas.1421601112
72. Christodoulatos GS, Spyrou N, Kadillari J, Psallida S, Dalamaga M. The role of adipokines in breast cancer: current evidence and perspectives. Curr Obes Rep. 2019;8(4):413–433. doi:10.1007/s13679-019-00364-y
73. Ke ZB, Wu YP, Huang P, et al. Identification of novel genes in testicular cancer microenvironment based on ESTIMATE algorithm-derived immune scores. J Cell Physiol. 2021;236(1):706–713. doi:10.1002/jcp.29898
74. Graney PL, Tavakol DN, Chramiec A, Ronaldson-Bouchard K, Vunjak-Novakovic G. Engineered models of tumor metastasis with immune cell contributions. I Science. 2021;24(3):102179.
75. Bosch M, Sánchez-álvarez M, Fajardo A, et al. Mammalian lipid droplets are innate immune hubs integrating cell metabolism and host defense. Science. 2020;370(6514):eaay8085. doi:10.1126/science.aay8085
76. Li Z, Liu H, Luo X. Lipid droplet and its implication in cancer progression. Am J Cancer Res. 2020;10(12):4112–4122.
77. Wright HJ, Hou J, Xu B, et al. CDCP1 drives triple-negative breast cancer metastasis through reduction of lipid-droplet abundance and stimulation of fatty acid oxidation. Proc Natl Acad Sci U S A. 2017;114(32):E6556–E6565. doi:10.1073/pnas.1703791114
78. Kwong SC, Jamil AHA, Rhodes A, Taib NA, Chung I. Metabolic role of fatty acid binding protein 7 in mediating triple-negative breast cancer cell death via PPAR-α signaling. J Lipid Res. 2019;60(11):1807–1817. doi:10.1194/jlr.M092379
79. Apaya MK, Hsiao PW, Yang YC, Shyur LF. Deregulating the CYP2C19/epoxy-eicosatrienoic acid-associated FABP4/FABP5 signaling network as a therapeutic approach for metastatic triple-negative breast cancer. Cancers. 2020;12(1):199. doi:10.3390/cancers12010199
80. Kao TJ, Wu CC, Phan NN, et al. Prognoses and genomic analyses of proteasome 26S subunit, ATPase (PSMC) family genes in clinical breast cancer. Aging. 2021;13(14):17970. doi:10.18632/aging.203345
81. Zhou N, Chen X, Xi J, et al. Novel genomic targets of valosin-containing protein in protecting pathological cardiac hypertrophy. Sci Rep. 2020;10(1):18098. doi:10.1038/s41598-020-75128-z
82. Chang TJ, Wang WC, Hsiung CA, et al. Genetic variation of SORBS1 gene is associated with glucose homeostasis and age at onset of diabetes: a SAPPHIRe Cohort Study. Sci Rep. 2018;8(1):10574. doi:10.1038/s41598-018-28891-z
83. Brandsma CA, Guryev V, Timens W, et al. Integrated proteogenomic approach identifying a protein signature of COPD and a new splice variant of SORBS1. Thorax. 2020;75(2):180–183. doi:10.1136/thoraxjnl-2019-213200
84. Mei J, Xing Y, Lv J, et al. Construction of an immune-related gene signature for prediction of prognosis in patients with cervical cancer. Int Immunopharmacol. 2020;88:106882. doi:10.1016/j.intimp.2020.106882
85. Gong C, Hu Y, Zhou M, et al. Identification of specific modules and hub genes associated with the progression of gastric cancer. Carcinogenesis. 2019;40(10):1269–1277. doi:10.1093/carcin/bgz040
86. Aakula A, Kohonen P, Leivonen SK, et al. Systematic identification of microRNAs that impact on proliferation of prostate cancer cells and display changed expression in tumor tissue. Eur Urol. 2016;69(6):1120–1128. doi:10.1016/j.eururo.2015.09.019
87. Cho WC, Jang JE, Kim KH, Yoo BC, Ku JL. SORBS1 serves a metastatic role via suppression of AHNAK in colorectal cancer cell lines. Int J Oncol. 2020;56(5):1140–1151. doi:10.3892/ijo.2020.5006
88. Zhu S, Xiang X, Xu X, Gao S, Mai K, Ai Q. TIR domain-containing adaptor-inducing interferon-β (TRIF) participates in antiviral immune responses and hepatic lipogenesis of large yellow croaker (larimichthys crocea). Front Immunol. 2019;10:2506. doi:10.3389/fimmu.2019.02506
89. Yokoyama S, Cai Y, Murata M, et al. A novel pathway of LPS uptake through syndecan-1 leading to pyroptotic cell death. eLife. 2018;7. doi:10.7554/eLife.37854
90. Igal RA. Stearoyl-CoA desaturase-1: a novel key player in the mechanisms of cell proliferation, programmed cell death and transformation to cancer. Carcinogenesis. 2010;31(9):1509–1515. doi:10.1093/carcin/bgq131
91. Gharbaran R. Advances in the molecular functions of syndecan-1 (SDC1/CD138) in the pathogenesis of malignancies. Crit Rev Oncol Hematol. 2015;94(1):1–17. doi:10.1016/j.critrevonc.2014.12.003
92. Spinler K, Bajaj J, Ito T, et al. A stem cell reporter based platform to identify and target drug resistant stem cells in myeloid leukemia. Nat Commun. 2020;11(1):5998. doi:10.1038/s41467-020-19782-x
93. Stow JL, Hung Y, Wall AA. Macropinocytosis: insights from immunology and cancer. Curr Opin Cell Biol. 2020;65:131–140. doi:10.1016/j.ceb.2020.06.005
94. Betriu N, Bertran-Mas J, Andreeva A, Semino CE. Syndecans and pancreatic ductal adenocarcinoma. Biomolecules. 2021;11(3):3. doi:10.3390/biom11030349
95. Hollósi P, Váncza L, Karászi K, et al. Syndecan-1 promotes hepatocyte-like differentiation of hepatoma cells targeting Ets-1 and AP-1. Biomolecules. 2020;10(10):10. doi:10.3390/biom10101356
96. Reszegi A, Karászi K, Tóth G, et al. Overexpression of human syndecan-1 protects against the diethylnitrosamine-induced hepatocarcinogenesis in mice. Cancers. 2021;13(7):7. doi:10.3390/cancers13071548
97. Chen J, Tang J, Chen W, et al. Effects of syndecan-1 on the expression of syntenin and the migration of U251 glioma cells. Oncol Lett. 2017;14(6):7217–7224. doi:10.3892/ol.2017.7170
98. Sundberg EL, Deng Y, Burd CG. Syndecan-1 mediates sorting of soluble lipoprotein lipase with sphingomyelin-rich membrane in the golgi apparatus. Dev Cell. 2019;51(3):387–398.e384. doi:10.1016/j.devcel.2019.08.014
99. Gharbaran R, Goy A, Tanaka T, et al. Fibroblast growth factor-2 (FGF2) and syndecan-1 (SDC1) are potential biomarkers for putative circulating CD15+/CD30+ cells in poor outcome Hodgkin lymphoma patients. J Hematol Oncol. 2013;6(1):62. doi:10.1186/1756-8722-6-62
100. Lu W, Li N, Liao F. Identification of key genes and pathways in pancreatic cancer gene expression profile by integrative analysis. Genes. 2019;10(8):8. doi:10.3390/genes10080612
101. Bowlt Blacklock K, Birand Z, Biasoli D, et al. Identification of molecular genetic contributants to canine cutaneous mast cell tumour metastasis by global gene expression analysis. PLoS One. 2018;13(12):e0208026. doi:10.1371/journal.pone.0208026
102. Rodriguez CP, Wu QV, Voutsinas J, et al. A phase II trial of pembrolizumab and vorinostat in recurrent metastatic head and neck squamous cell carcinomas and salivary gland cancer. Clin Cancer Res. 2020;26(4):837–845. doi:10.1158/1078-0432.CCR-19-2214
103. Yang M, Al Zaharna M, Chen YS, Li L, Cheung HY. In vitro antioxidant activities and anti-proliferative properties of the functional herb Abrus cantoniensis and its main alkaloid abrine. Food Funct. 2014;5(9):2268–2277. doi:10.1039/C4FO00217B
104. Chen KC, Chen CY. In silico identification of potent PPAR-γ agonists from traditional Chinese medicine: a bioactivity prediction, virtual screening, and molecular dynamics study. eCAM. 2014;2014:192452. doi:10.1155/2014/192452
105. Laskar S, Espino O, Bandyopadhyay D. Isolation, solid-state structure determination, in silico and in vitro anticancer evaluation of an indole amino acid Alkaloid L-Abrine. Curr Cancer Drug Targets. 2019;19(9):707–715. doi:10.2174/1568009619666190111111937
106. Lee WY, Chen KC, Chen HY, Chen CY. Potential mitochondrial isocitrate dehydrogenase R140Q mutant inhibitor from traditional Chinese medicine against cancers. Biomed Res Int. 2014;2014:364625. doi:10.1155/2014/364625
107. García-Tojal J, García-Orad A, Díaz AA, et al. Biological activity of complexes derived from pyridine-2-carbaldehyde thiosemicarbazone. Structure of. J Inorg Biochem. 2001;84(3–4):271–278. doi:10.1016/S0162-0134(01)00184-2
108. Hancock CN, Stockwin LH, Han B, et al. A copper chelate of thiosemicarbazone NSC 689534 induces oxidative/ER stress and inhibits tumor growth in vitro and in vivo. Free Radic Biol Med. 2011;50(1):110–121. doi:10.1016/j.freeradbiomed.2010.10.696
 © 2022 The Author(s). This work is published and licensed by Dove Medical Press Limited. The full terms of this license are available at https://www.dovepress.com/terms.php and incorporate the Creative Commons Attribution - Non Commercial (unported, v3.0) License.
By accessing the work you hereby accept the Terms. Non-commercial uses of the work are permitted without any further permission from Dove Medical Press Limited, provided the work is properly attributed. For permission for commercial use of this work, please see paragraphs 4.2 and 5 of our Terms.
© 2022 The Author(s). This work is published and licensed by Dove Medical Press Limited. The full terms of this license are available at https://www.dovepress.com/terms.php and incorporate the Creative Commons Attribution - Non Commercial (unported, v3.0) License.
By accessing the work you hereby accept the Terms. Non-commercial uses of the work are permitted without any further permission from Dove Medical Press Limited, provided the work is properly attributed. For permission for commercial use of this work, please see paragraphs 4.2 and 5 of our Terms.