")
Back to Journals » International Journal of General Medicine » Volume 15
Development and Validation of a Model That Predicts the Risk of Diabetic Nephropathy in Type 2 Diabetes Mellitus Patients: A Cross-Sectional Study
Received 21 February 2022
Accepted for publication 12 May 2022
Published 20 May 2022 Volume 2022:15 Pages 5089—5101
DOI https://doi.org/10.2147/IJGM.S363474
Checked for plagiarism Yes
Review by Single anonymous peer review
Peer reviewer comments 2
Editor who approved publication: Dr Scott Fraser
Jing Yang,* Sheng Jiang*
State Key Laboratory of Pathogenesis, Prevention and Treatment of High Incidence Diseases in Central Asia; Department of Endocrinology, The First Affiliated Hospital of Xinjiang Medical University, Urumqi, 830017, People’s Republic of China
*These authors contributed equally to this work
Correspondence: Sheng Jiang, Email [email protected]
Purpose: To develop a nomogram model that predicts the risk of diabetic nephropathy (DN) incidence in type 2 diabetes mellitus (T2DM) patients.
Methods: We collect information from electronic medical record systems. The data were split into a training set (n=521) containing 73.8% of patients and a validation set (n=185) holding the remaining 26.2% of patients based on the date of data collection. Stepwise and multivariable logistic regression analyses were used to screen out DN risk factors. A predictive model including selected risk factors was developed by logistic regression analysis. The results of binary logistic regression are presented through forest plots and nomogram. Lastly, the c-index, calibration plots, and receiver operating characteristic (ROC) curves were used to assess the accuracy of the nomogram in internal and external validation. The clinical benefit of the model was evaluated by decision curve analysis.
Results: Predictors included serum creatinine (Scr), hypertension, glycosylated hemoglobin A1c (HbA1c), blood urea nitrogen (BUN), body mass index (BMI), triglycerides (TG), and Diabetic peripheral neuropathy (DPN). Harrell’s C-indexes were 0.773 (95% CI:0.726– 0.821) and 0.758 (95% CI:0.679– 0.837) in the training and validation sets, respectively. Decision curve analysis (DCA) demonstrated that the novel nomogram was clinically valuable.
Conclusion: Our simple nomogram with seven factors may help clinicians predict the risk of DN incidence in patients with T2DM.
Keywords: type 2 diabetes mellitus, diabetic nephropathy, nomogram, risk factors
Introduction
Diabetes mellitus is one of the most common chronic diseases in our country. According to the International Diabetes Federation (IDF), the number of adults with diabetes worldwide has reached 537 million (10.5%) in 2021, an increase of 74 million people with diabetes compared to 2019, highlighting the alarming increase in the global prevalence of diabetes. The IDF speculates that this number will reach 783 million by 2045. T2DM is a disease characterized by hyperglycemia caused by insulin resistance and relative insulin deficiency and accounts for 90–95% of all diabetes.1 T2DM can lead to various complications such as cardiovascular disease, DN, diabetic retinopathy, and DPN.2–4
DN is the most significant single cause of the end-stage renal disease (ESRD) in Western societies,5,6 and the annual mortality rate of ESRD (nearly 9%) is 10 to 20 times higher than that of the general population.7 The prevalence of DN has increased rapidly in China in recent decades, which has led to severe socio-economic and public health consequences.8,9 At the same time, DN affects the quality of life of patients and the economic burden on local governments.
Nomogram is a prediction model that has been proven as a tool for initial diagnosis and prognostic assessment of illness.10,11 Clinical indicators for accurately distinguishing DN from non-diabetic renal disease in T2DM are lacking. In addition, DN is still observed in one-third to a half of T2D patients undergoing renal biopsy due to suspicion of an alternative cause of kidney disease.12 To improve the accuracy of predictions as well as to reduce operational risks in the target population requiring renal biopsy, it is essential to develop useful prediction models to predict DN in T2D patients. Therefore, we will develop a nomogram to assess the risk of DN morbidity in T2DM patients by some clinical indicators. The model effectively predicts the probability of DN occurrence, which can help high-risk individuals take timely intervention measures to reduce the morbidity and mortality of diabetes-related complications.
Materials and Methods
Study Population
We reviewed the records of 834 patients who visited and completed T2DM screening at the Endocrinology Department of the First Affiliated Hospital of Xinjiang Medical University from March 1, 2021, to December 30, 2021. Based on the inclusion and exclusion criteria, 706 study subjects were finally included.52 We used 521 (73.8%) cases of T2DM patients collected before November 15, 2021, as the training set, and 185 (26.2%) cases of T2DM patients after November 15, 2021, as the validation set (Figure 1).
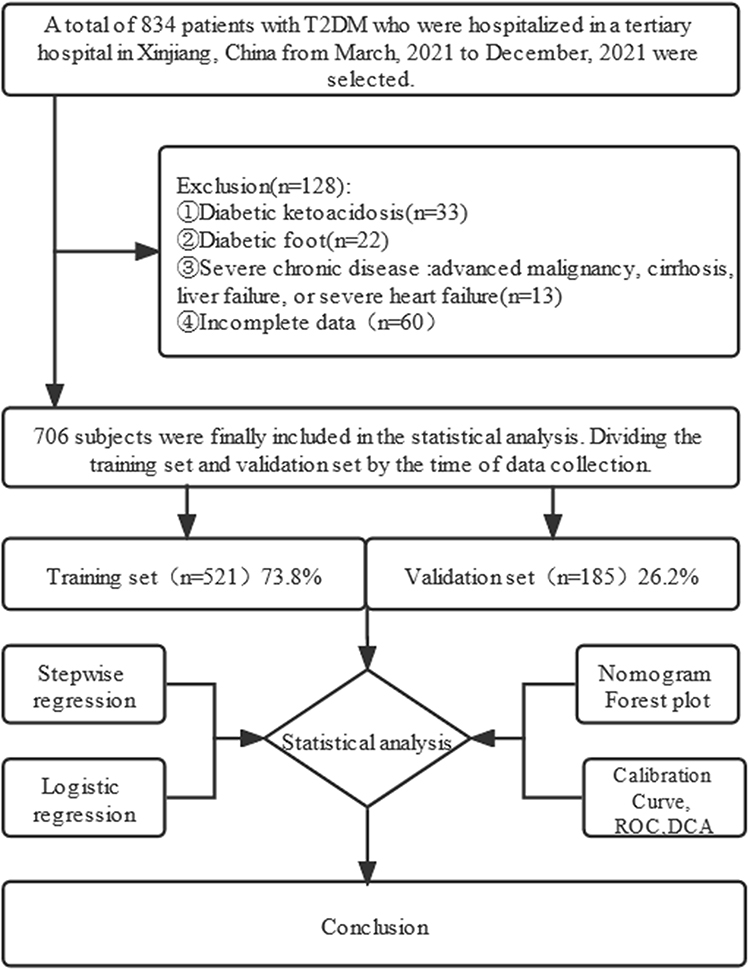 |
Figure 1 Logic flow plot of this study. |
Data Collection
Following clinical variables were reviewed from electronic medical records: age, sex, BMI, office blood pressure, and some biochemical indicators, including plasma glucose, HbA1c, Scr, BUN, total cholesterol (TC), and TG, as determined by Beckman Coulter Fully Automatic Biochemistry Analyzer. Moreover, we collected serum insulin-like growth factor-1 (IGF-1) and insulin-like growth factor binding protein-3 (IGFBP-3). Serum IGF-1 and IGFBP-3 levels were measured by the chemiluminescence immunometric method (Siemens Healthcare Diagnostics Products Ltd, United Kingdom). Serum creatinine concentration was determined by the Jaffé method. Low-density lipoprotein (LDL-C) and high-density lipoprotein (HDL-C) were measured by the direct method, TC by enzymatic method, TG by GPO-POD method, and fasting blood glucose (FBG) by hexokinase method (Beckman Coulter Fully Automatic Biochemistry Analyzer, Beckman Coulter, Inc, USA). GFR is estimated using the simplified Modification of Diet in Renal Disease (MDRD) formula. MDRD: [eGFR [mL/min/1.73 m2] =186.3 × serum creatinine [mg/dL]−1.154 × age [years]−0.203 × (0.742 for women)].13,14
Definitions
The diagnostic criteria for T2DM are based on the 1999 World Health Organization criteria: Typical symptoms of diabetes (polydipsia, polyuria, polyphagia, weight loss) + random venous plasma blood glucose ≥ 11.1 mmol/L (200 mg/dl) or fasting blood glucose ≥ 7.0 mmol/L (126 mg/dl) or OGTT 2-hour glucose in venous plasma (for those without diabetic symptoms, repeat the test on another day) ≥ 11.1 mmol/L (200 ng/dl). Hypertension was defined as the presentation of systolic blood pressure (SBP) ≥ 140 mmHg or/and diastolic blood pressure (DBP) ≥ 90 mmHg. According to the China Adult Dyslipidemia Prevention Guide (2007).15 We defined dyslipidemia according to the Chinese guidelines for the prevention and treatment of type 2 diabetes (2020) as a manifestation of the following four indicators: TC ≥ 4.5 mmol/L, TG ≥ 1.7 mmol/L, HDL-C < 1.0 mmol/L, and LDL-C ≥ 2.6 mmol/L.
According to the criteria of Mogensen,16 DN was divided into three stages: non-albuminuria (NAU) with UAER < 20μg/min, microalbuminuria (MAU) with 20≤UAER≤200μg/min, and clinical albuminuria (CAU) with UAER>200μg/min, Both MAU and CAU indicated DN in this study.17,18
Patients were considered to have DR when any of the following lesions were detected at dilated fundoscopy: intra-retinal microvascular abnormalities, microaneurysms, cotton wool spots, hard exudates, hemorrhages, venous beading, and new vessels. DPN was screened by symptoms and physical examination. In all patients, other causes of neuropathy were excluded. The diagnosis was confirmed by electromyography and/or nerve conduction study.
Statistical Analysis
Statistical data analysis was performed using a statistical computer program for the R (version 4.1.1) project. All the statistical tests were considered significant at the 0.05 probability level.
There were a training set and a validation set in the study. Comparisons of continuous and categorical variables between training and validation sets were performed using the t-test and chi-square test, respectively. The training set was used for building a nomogram. Within the training set, Univariate logistic regression analysis was used to assess the significance of each variable. All variables associated with DN at a significant level were candidates for stepwise multivariate analysis. The independent predictors related to incident DN were used to build a nomogram.
To evaluate the predictive power of the model, we calculated the C-index. To reduce the bias, the calibration was conducted by using 1000 bootstrap samples.19 An area under the receiver operating characteristic curve (AUC) to assess the specificity and sensitivity of the DN risk nomogram.20
DCA is a simple method for evaluating clinical predictive models, diagnostic tests, and molecular markers. While traditional diagnostic test metrics such as sensitivity, specificity, and area under the ROC curve only measure the diagnostic accuracy of a predictive model and do not take into account the clinical utility of a particular model, the advantage of DCA is that it integrates patient or decision-maker preference analysis.21
Results
Characteristics of the Study Population
A total of 706 patients with T2DM were included in this study, all Chinese. 521 and 185 patients were divided into the training and validation sets. The training and validation sets are divided into DN and NDN groups according to the DN diagnosis criteria. The number of diagnosed DN in the training and validation sets was 133 and 62, respectively. Table 1 describes the baseline characteristics of the training and validation sets. There were no statistically significant differences between the two groups in terms of gender, duration of diabetes, BMI, hypertension, dyslipidemia, DPN, DR, smoking status, alcohol consumption, FBG, 2hour-oral glucose tolerance test (2H-OGTT), HbA1c, estimate glomerular filtration rate (eGFR), BUN, TG, TC, LDL-C, HDL-C, and IGFBP-3.
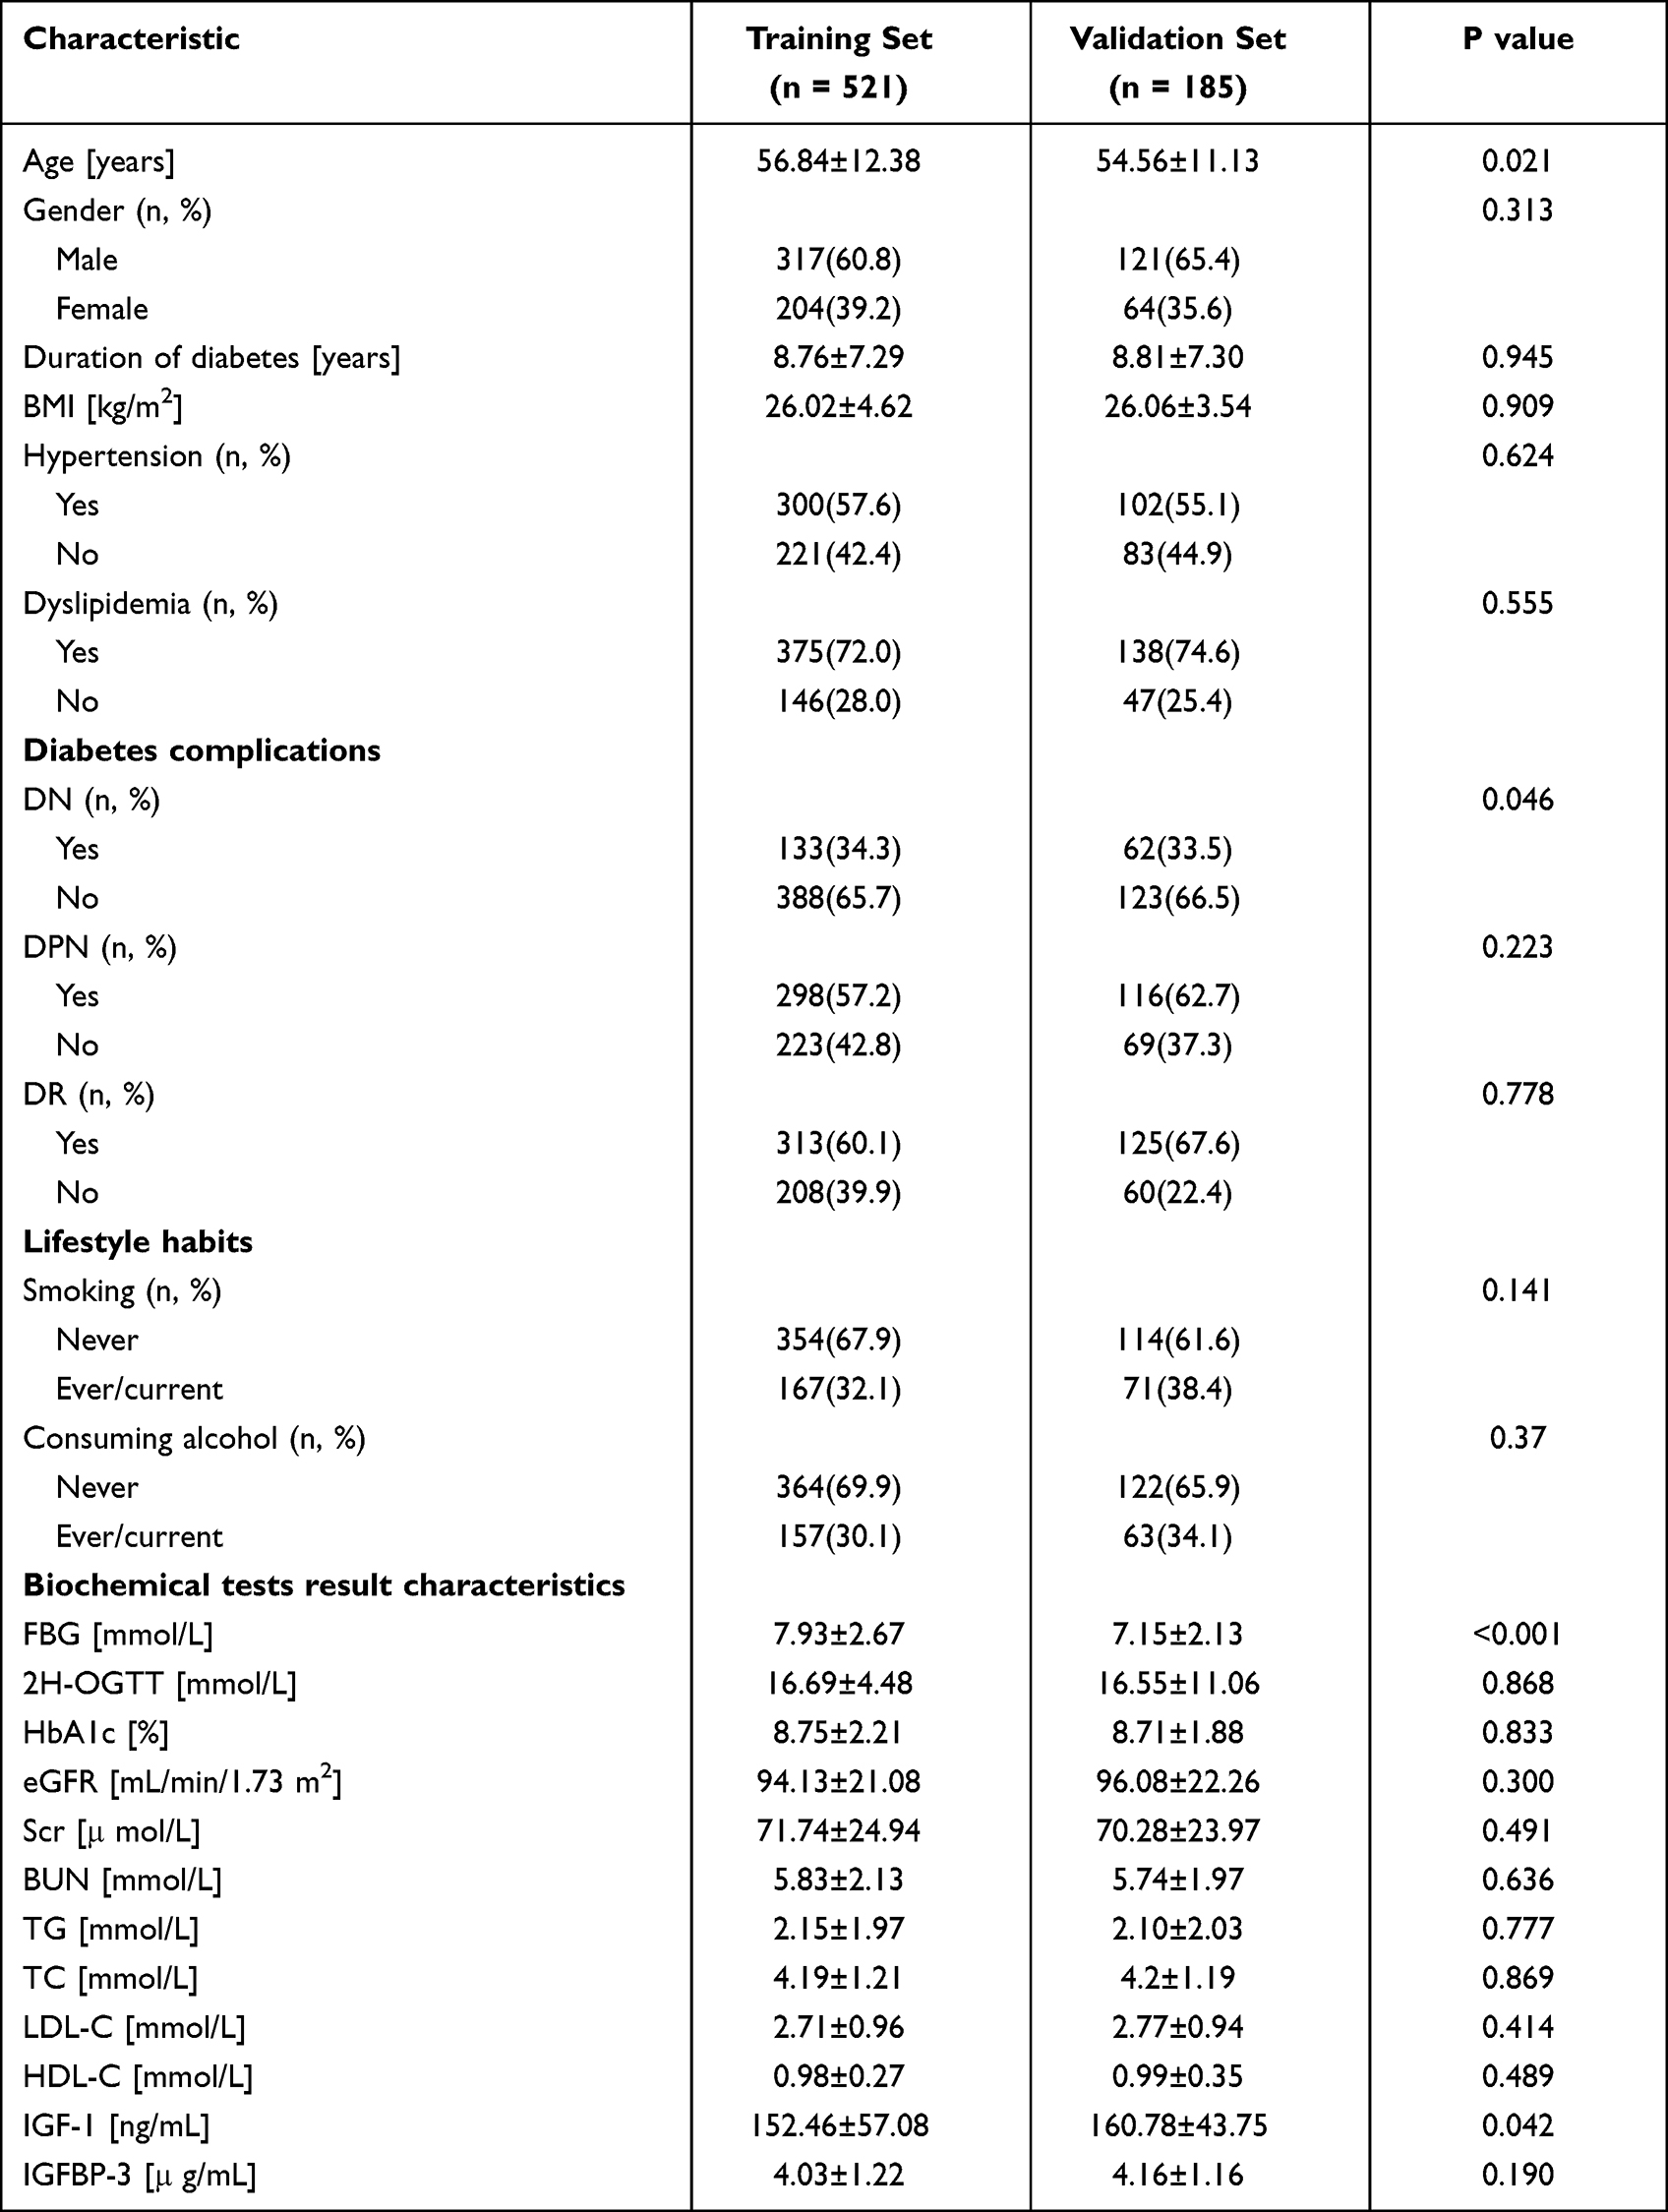 |
Table 1 Baseline Characteristics of Training and Validation Sets |
Feature Selection
Table 2 lists the variables identified as predictors of DN incidence in patients with T2DM. Univariate logistic regression analysis showed that age, gender, history of diabetes, BMI, hypertension, DPN, DR, HbA1c, eGFR, Cr, BUN, TG, and HDL-C were risk factors associated with the incidence of DN in patients with T2DM. Stepwise regression screens the variables, and the best model has the smallest AIC value. Based on the results of univariate logistics, the risk factors related to the risk of DN in T2DM patients were further screened by stepwise regression according to the principle of the Akaike Information Criterion (the best model had the smallest AIC value).
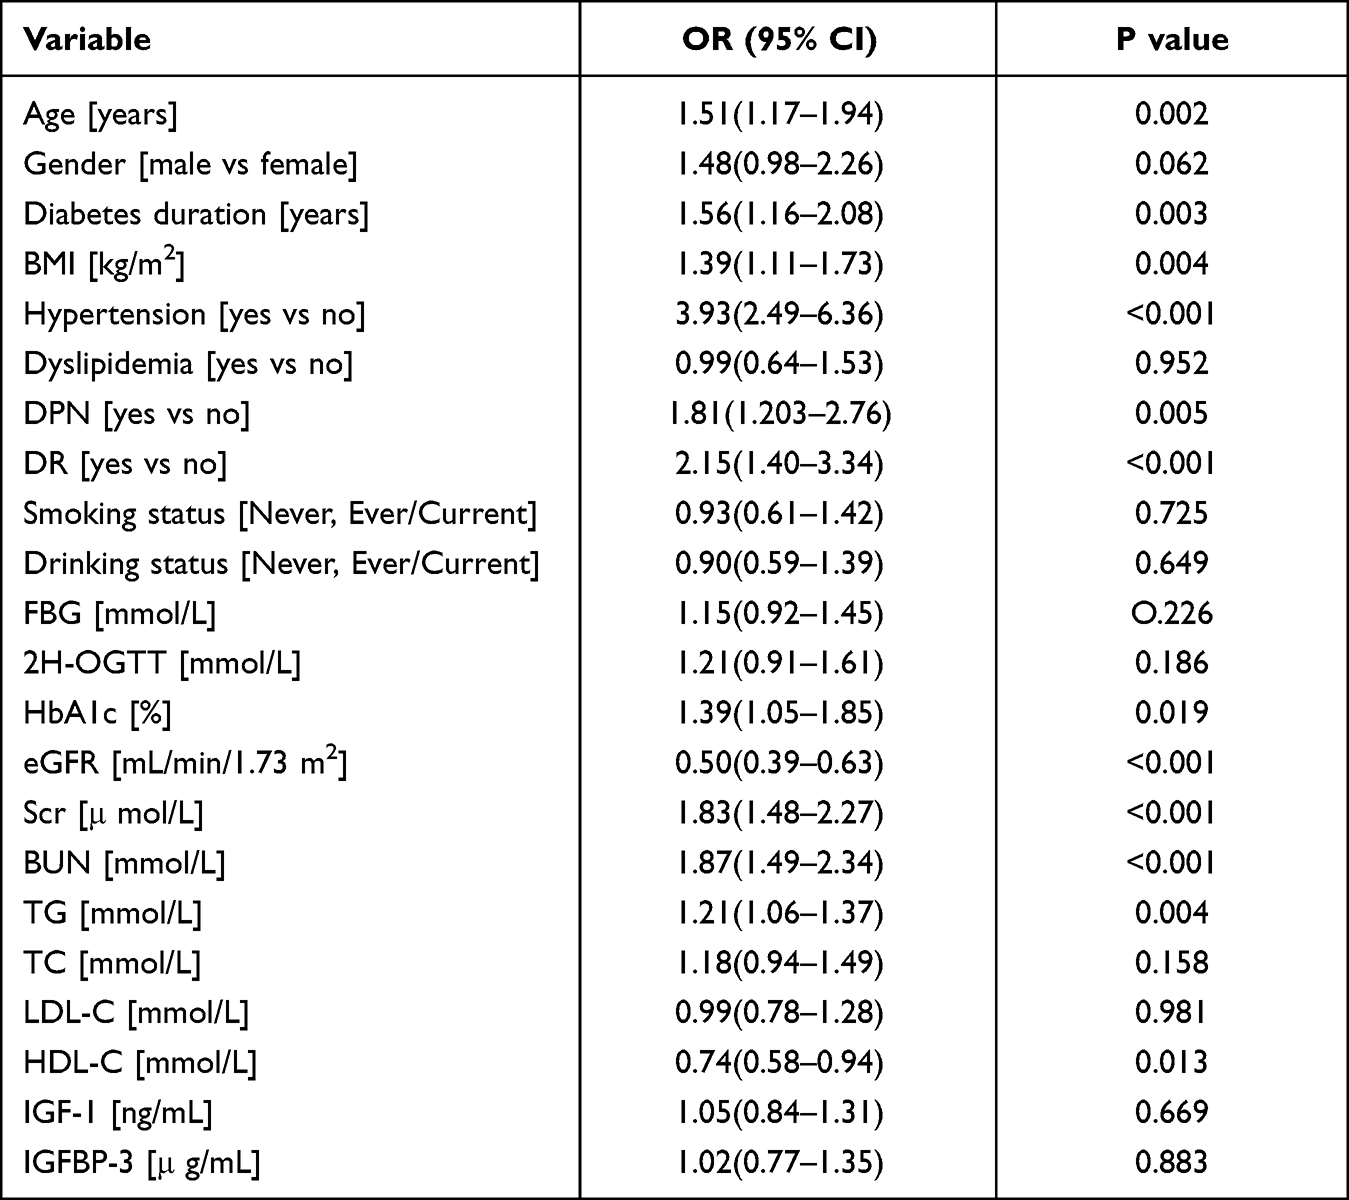 |
Table 2 Univariable Logistic Analysis to Extract the Potential Predictors |
Construction of the Nomogram Prediction Model
Binary logistic regression analysis showed that Scr, hypertension, HbA1c, BUN, BMI, TG, and DPN were independent risk predictors of DN in T2DM patients (Table 3) and were further used to establish nomogram (Figure 2). The binary logistic regression results are shown in the forest plot (Figure 3).
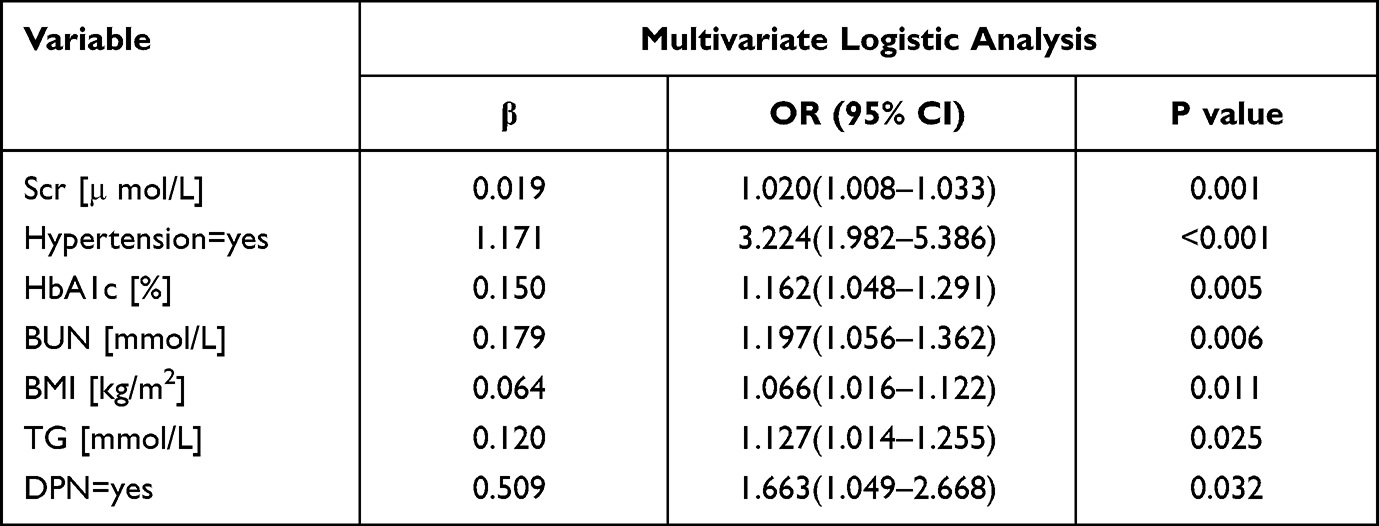 |
Table 3 Multivariate Logistic Regression Analysis of Step AIC Selection to Construct a Nomogram Model |
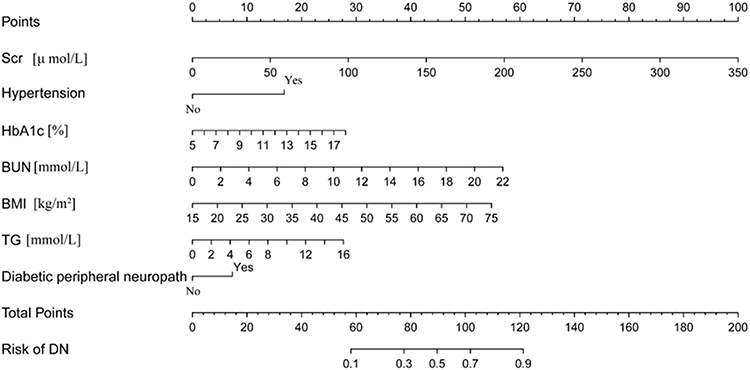 |
Figure 2 A nomogram for predicting the incidence of diabetic nephropathy in T2DM patients. Notes: The nomogram was developed in the training dataset, with Scr, Hypertension, HbA1c, BUN, BMI, TG, and DPN incorporated. Points of each variable were acquired by drawing a straight line upward from the corresponding value to the “Points” line. Then sum the points received from each variable and located the number on the “Total Points” axis. To conclude the patient’s sort of probability having DN, draw a straight line down to the corresponding “Probability of DN” axis. |
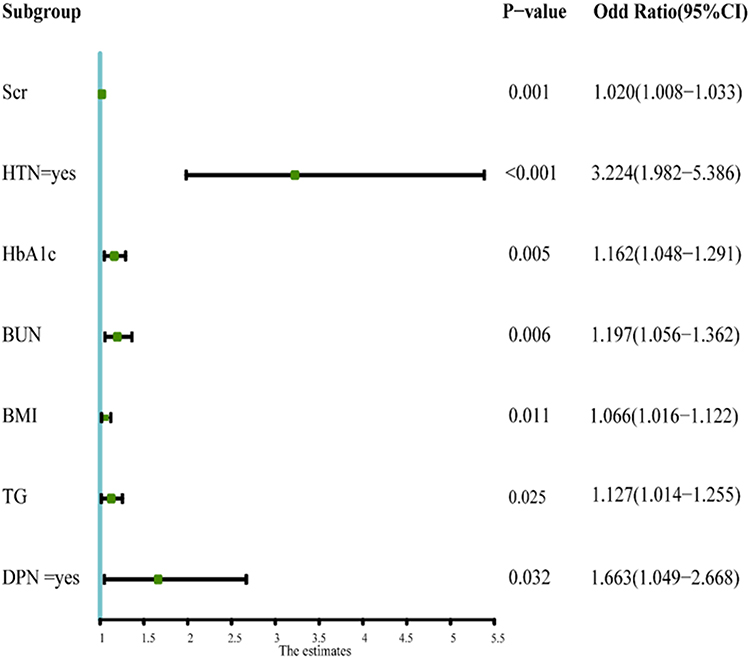 |
Figure 3 The forest plot of the OR of the selected feature. Notes: Use forest plot to visualize logistic regression analysis. |
Performance of the DN Risk Nomogram
The c-index in the training set is 0.773, indicating a relatively good discriminative ability. Similarly, the c-index in the validation set is 0.758, which shows satisfactory prediction results. The calibration curves show excellent agreement between the predicted results and the actual observations in the training (Figure 4A) and validation sets (Figure 4B). The ROC curve of the model had an AUC of 0.773 (95% CI; 0.726–0.821) for the training set (Figure 5A) and 0.758 (95% CI; 0.679–0.837) for the validation set (Figure 5B). These results suggest that the nomogram can accurately predict the incidence of DN in T2DM patients.
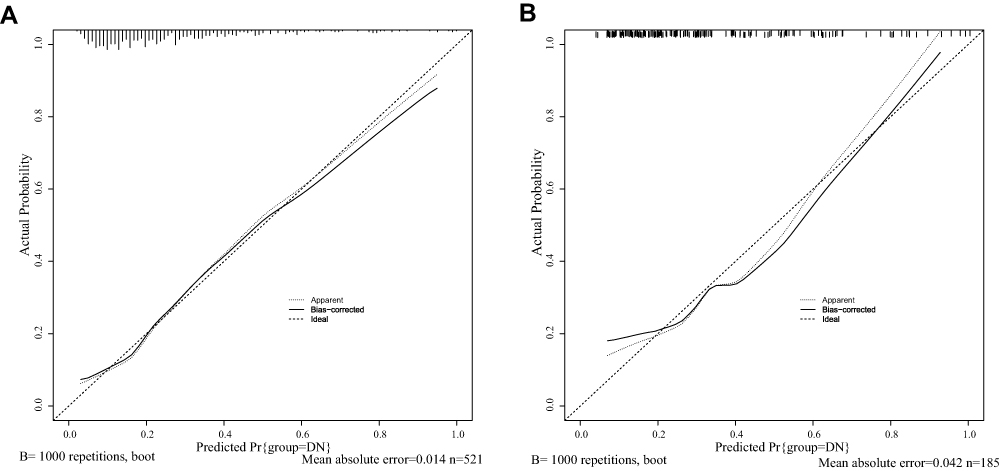 |
Figure 4 Calibration curves for the nomogram. Notes: A represents the training set. B represents a validation set. The x-axis represents the predicted probability of DN. The y-axis represents the actual diagnosed DN. The diagonal dotted line represents a perfect prediction by an ideal model. The solid line represents the performance of the nomogram, of which a closer fit to the diagonal dotted line represents a better prediction. DN, diabetic nephropathy. |
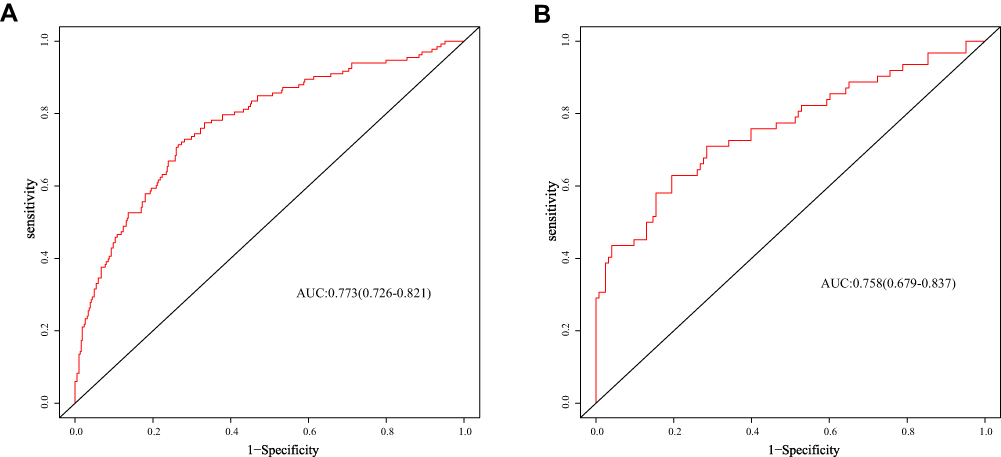 |
Figure 5 ROC curves for the nomogram. Notes: A represents the training set and B represents the validation set. The y-axis means the true positive rate of the risk prediction. The x-axis means the false positive rate of the risk prediction. The red line represents the performance of the nomogram. |
Clinical Use
The decision curve of the DN risk nomogram is shown in Figure 6. According to decision curve analysis, nomograms are clinically beneficial in predicting the risk of DN incidence between a considerable range of threshold probabilities.
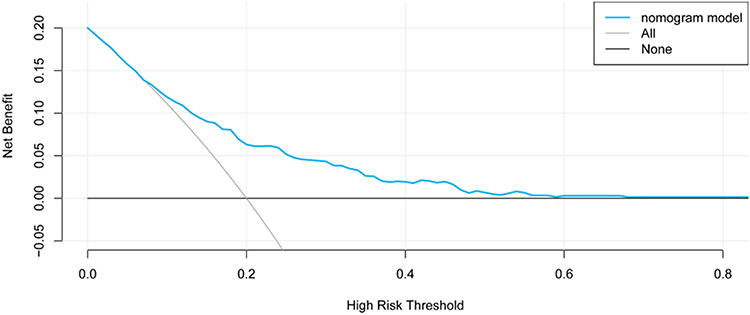 |
Figure 6 Decision curve analysis for the DN incidence risk nomogram. Notes: The y-axis measures the net benefit. The blue line represents the DN incidence risk nomogram. The thin solid line represents the assumption that all patients are diagnosed as DN. The thin thick solid line represents the assumption that no patients are diagnosed as DN. The decision curve showed that if the threshold probability of a patient and a doctor is >20%, respectively, using this DN incidence risk nomogram in the current study to predict DN incidence risk adds more benefit than the intervention-all-patients scheme. |
Discussion
DN is one of the major microvascular complications in diabetic patients and a significant cause of ESRD in developed and some developing countries.8 DN is a progressively deteriorating chronic kidney disease with complications such as hypertension, congestive heart failure, and end-stage renal disease as the disease progresses. This condition often requires dialysis or transplantation for lifelong kidney replacement therapy, creating a massive health and economic burden worldwide.8,22 Early diagnosis and treatment can reduce DN’s mortality and disability rate and improve the quality of life. However, due to the insidious onset of DN, most patients have already developed irreversible renal impairment at the time of diagnosis. Therefore, this study aimed to develop a proper and straightforward predictive tool to assess the risk of DN occurrence by physical examination and biochemical tests in patients with T2DM.
In this study, we developed and validated a new risk prediction tool for DN incidence in patients with T2DM using seven readily available clinical indicators. It can help clinicians determine a patient’s high or low risk of developing DN. Our prediction model includes Scr, Hypertension, HbA1c, BUN, BMI, TG, and DPN. Our model shows good accuracy with a relatively high c-index (0.773 and 0.758, respectively) in the training and validation sets and good agreement with the calibration curves. The satisfactory performance of the nomogram in external validation shows that our model has good portability and generality, and the nomogram can be widely and accurately used.
As an example to better explain the nomogram, if the T2DM patient’s TG was 3.18 mmol/L, without DPN, BMI was 26 kg/m2, HbA1c was 8.7%, BUN was 6.7mmol/L, Scr was 57.5μmol/L, and hypertension, the probability of DN was estimated to be 23.9% (Figure 7).
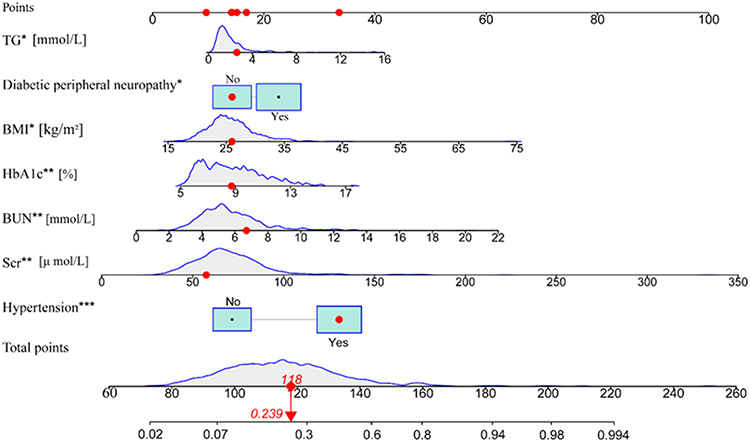 |
Figure 7 An example of nomogram for DN. Notes: The nomogram was developed in the training dataset, with Scr, Hypertension, HbA1c, BUN, BMI, TG, and DPN incorporated. Points of each variable were acquired by drawing a straight line upward from the corresponding value to the “Points” line. Then sum the points received from each variable and located the number on the “Total Points” axis. To conclude the patient’s sort of probability having DN, draw a straight line down to the corresponding “Probability of DN” axis. ***p<0.001, **p<0.01, *p<0.05. |
The prevalence of DN in our study is consistent with reflections on the prevalence of diabetic nephropathy in Germany and India (20–30%).23,24 Data from the 2011 Korean National Health and Nutrition Survey showed that 26.7% of people with diabetes had DN.25 A Saudi Arabian study retrospectively investigated the medical files of 1952 type 2 diabetic patients followed up in Saudi Arabian tertiary hospitals from January 1989 to January 2004 and found that 32.1% of patients developed DN.26 These phenomena can be explained by racial or ethnic differences in the prevalence of DN. Zhang et al meta-analysis of observational studies on the prevalence of diabetic nephropathy in Chinese patients with T2DM found that the combined prevalence of DN was highest in western China, and further stratified analysis by province/city showed that Sichuan and Gansu are the provinces with the highest prevalence of DN.27 Although there is no data for Xinjiang, Xinjiang belongs to the west, and the same geographical environment and life characteristics may also lead to a high incidence of DN. Therefore, it is vital to establish a predictive model. Early diagnosis and timely intervention can reduce the pressure on my country’s health care system and financial burden.
The prevalence and progression of DN are different between both males and females. Overall, men seem to be at a higher risk for microvascular complications in diabetes, while the consequences of diabetic macrovascular complications may be greater in women.28 Because there was male predominance in the present study (62%), and this may cause some bias, the confirmation of the results should be needed in independent cohorts from elsewhere.
Urea nitrogen is the end product of protein metabolism, and creatinine is the product of muscle metabolism; both are excreted by glomerular filtration. BUN and Scr are often used to evaluate the function of the kidney. Two cross-sectional studies involving models of DN incidence in patients with T2DM found that BUN was an independent risk factor for DN incidence.29,30 A retrospective study conducted in Guilin, China, found that BUN was strongly associated with an increased risk of DN in patients with type 2 DM and found that increased Scr levels also increased the risk of DN progression.31 Our result confirms that BUN and Scr are risk factors for DN in T2DM patients. This is similar to the results of previous studies, suggesting that BUN and Scr are risk factors for DN. Cheema et al found Scr as an independent risk factor for DN in a cross-sectional survey of diabetic microvascular complications in the Middle East.32 Another study conducted in Jiangsu, China, developed a predictive model for diabetic nephropathy in the Chinese population, in which Scr was found to be a significant independent risk factor for DN.33
Current studies show that people with T2DM have 1.5–3 times the prevalence of hypertension than their age-matched non-type 2 diabetic counterparts.34 In our study, 56.9% of patients with T2DM also had hypertension. Hill et al. Global prevalence of chronic kidney disease-A systematic review and meta-analysis found that diabetes and hypertension, either alone or in combination, eventually lead to end-stage renal failure in about 80% of patients.35 A prospective study of T2DM patients in developing countries found that reduced eGFR in hypertensive patients is a significant factor in the development of diabetic nephropathy and indicated that hypertension is an independent risk factor for diabetic nephropathy.36 In a regression study of microvascular complications of type 2 diabetes and their associated risk factors in Bangladesh, SBP>120mmHg and DBP>80mmHg were significant risk factors for DN.37 Our study found that SBP and DBP values were higher in DN patients than in NDN patients, confirming that hypertension is a risk factor for DN development in patients with T2DM. In our study, it was proved that hypertension is a risk factor for DN in obese T2DM patients.
Jiang et al developed and validated a predictive model for the risk of early diabetic nephropathy based on a systematic review and meta-analysis of 20 cohorts in which BMI was the underlying risk factor, and the risk of DN increased by 16% when BMI increased by 5 kg/m2.38 A study of patients with advanced DN showed a significant 12% reduction in Scr levels after a short-term rigorous weight loss intervention.39 The pathological mechanisms underlying the pathogenesis of obesity and DN are not fully understood. However, adipose tissue is associated with the release of inflammatory mediators, such as interleukin-6 and tumor necrosis factor-A, and the process of fat metabolism plays an essential role in insulin resistance.40 Combining these factors may lead to changes in kidney structure, ultimately leading to obesity-related glomerulopathy. In this study on the DN of patients with T2DM, we obtained results showing that BMI is one of the risk factors for DN in patients with T2DM. Combining the results of this study with those of previous studies, BMI is a risk factor for the development of T2DM and a risk factor for the development of DN in T2DM patients; therefore, T2DM patients should be more concerned about their weight.
HbA1c provides information on the overall control of glucose over a 2–3month period, which is considered the best biochemical indicator to assess the long-term metabolic management of diabetic patients.41 Elevated serum glycated hemoglobin predicts the progression of diabetes, and many prospective studies have reported a close relationship between HbA1c and diabetic complications.42,43 HbA1c initiates the expression of inflammatory factors,44 promotes oxidative stress through ROS production, induces apoptosis, and ultimately leads to impaired target organ function in diabetes.45 Atkin et al showed that the proportion of subjects with elevated urinary albumin creatinine ratios was significantly higher in subjects with HbA1c levels greater than or equal to 7.0% compared to those with HbA1c levels below 5.0%.46 This further reflects that high HbA1c increases the risk of DN.
Hypertriglyceridemia is one of the most common clinical dyslipidemia. In a large prospective cohort study in China, high TG was found to be significantly associated with DN development in patients with new-onset diabetes. In addition, participants with reasonable control of high TG may have a reduced risk of DKD compared to those without control.47 Although glycemic control can reduce the risk of kidney disease, dyslipidemia can still damage the kidney by enhancing lipid-mediated inflammation, oxidative stress, lipogenesis, and ectopic lipid deposition.3 In another study of Indians with T2DM, dyslipidemia similarly predicted the progressiveness of diabetic nephropathy, particularly by a relatively high TG.48 In our research, TG was further confirmed as a risk factor for DN development in patients with T2DM.
DN is a common microvascular complication of T2DM, and nearly 50% of patients with ten years of diabetes have combined DPN, which can cause foot ulcers and eventually lead to foot amputation.49 As the peripheral nerve and renal vessels are exposed to the diabetic milieu, it is often assumed that the development and progression of DN and DPN occur at the same time. In this study, of 133 patients with DN, 90 (67.7%) presented with DR, and of 388 NDN patients, 208 (53.6%) had DR, suggesting that DPN is a good indicator of DN. Marsida et al established a DN prediction model to analyze risk factors for microvascular complications in patients with T2DM and found that DPN was closely associated with DN.50 Xu et al found a strong correlation between diabetic nephropathy and neuropathy at different stages in patients with type 2 diabetes mellitus, and DN was closely associated with DPN in patients with T2DM.51 Consistent with these reports, our multivariate logistic regression analysis results showed that DPN was significantly associated with an increased risk of DN.
Our study has many strengths, including the development of a new nomogram with only 7 indicators that are easily detectable by clinicians, providing an easy assessment of DN. Our study is the first to incorporate DPN into the DN risk nomogram model, which provides a theoretical basis for further research on the relationship between DN and DPN. The final risk model was validated internally and externally and achieved good agreement (C-index of 0.773 and 0.758, respectively).
However, our study had several limitations. Firstly, the current study is a cross-sectional design where exposure and outcome variables coexist, and the temporal order of exposure and outcome occurrence cannot be judged. Secondly, there is a lack of dynamic testing of treatment status and some indicators . Secondly, this study is a single-center study and does not represent all Chinese T2DM patients. Fourth, we could not collect all potential factors for DN incidence because of the data collection from the medical record system. Finally, although our nomogram achieved good predictive power with internal and external validation in this population, further evaluation of the model’s accuracy is needed in patients with T2DM from different regions.
Conclusion
We established a nomogram based on seven risk factors for Scr, Hypertension, HbA1c, BUN, BMI, TG, and DPN to help clinicians assess the risk of DN incidence in T2DM patients. Our nomograms show good performance on both training and validation sets. This study provides a theoretical and clinical basis for preventing the occurrence and development of DN in T2DM patients.
Abbreviations
DN, diabetic nephropathy; T2DM, type 2 diabetes mellitus; ROC, receiver operating characteristic; Scr, serum creatinine; HbA1c, glycosylated hemoglobin A1c; BUN, blood urea nitrogen; BMI, body mass index; TG, triglycerides; DPN, Diabetic peripheral neuropathy; DCA, decision curve analysis; IDF, International Diabetes Federation; ESRD, end-stage renal disease; TC, total cholesterol; IGF-1, insulin-like growth factor-1; IGFBP-3, insulin-like growth factor binding protein-3; LDL-C, Low-density lipoprotein; HDL-C, high-density lipoprotein; FBG, fasting blood glucose; MDRD, modification of diet in renal disease; SBP, systolic blood pressure; DBP, diastolic blood pressure; NAU, non-albuminuria; MAU, microalbuminuria; CAU, clinical albuminuria; OR, odds ratio.
Data Sharing Statement
The data used to support the findings of this study are available from the corresponding author upon request.
Ethics Approval and Consent to Participate
The study was performed by the ethical guidelines of the 1975 Declaration of Helsinki and was reviewed and approved by the human research ethics committee of the Affiliated Hospital of Xinjiang Medical University. Written informed consent was waived due to the retrospective nature and low risk of the study.
Acknowledgment
This work was supported by the fund project in the state key laboratory of Pathogenesis, Prevention, and Treatment of high incidence diseases in Central Asia. (Name of the fund: The role of TCF7L2/Wnt/GLP-1 signaling pathway and environmental factors in the pathogenesis of type-2 diabetes in Kazakhs (No.SKL-HIDCA-2019-15).
Author Contributions
All authors made a significant contribution to the work reported, whether that is in the conception, study design, execution, acquisition of data, analysis, and interpretation, or in all these areas; took part in drafting, revising, or critically reviewing the article; gave final approval of the version to be published; have agreed on the journal to which the article has been submitted, and agree to be accountable for all aspects of the work.
Disclosure
The authors report no conflicts of interest in this work.
References
1. American Diabetes Association. Diagnosis and classification of diabetes mellitus. Diabetes Care. 2014;37(Suppl.1):S81–S90. doi:10.2337/dc14-S081
2. Wolde HF, Atsedeweyen A, Jember A, et al. Predictors of vascular complications among type 2 diabetes mellitus patients at University of Gondar Referral Hospital: a retrospective follow-up study. BMC Endocr Disord. 2018;18(1). doi:10.1186/s12902-018-0280-0
3. Eid S, Sas KM, Abcouwer SF, et al. New insights into the mechanisms of diabetic complications: role of lipids and lipid metabolism. Diabetologia. 2019;62(9):1539–1549. doi:10.1007/s00125-019-4959-1
4. Fuso L, Pitocco D, Antonelli Incalzi R. Diabetic lung, an underrated complication from restrictive functional pattern to pulmonary hypertension. Diabetes Metab Res Rev. 2019;35(6). doi:10.1002/dmrr.3159
5. Forbes JM, Cooper ME. Mechanisms of diabetic complications. Physiol Rev. 2013;93(1):137–188. doi:10.1152/physrev.00045.2011
6. Xue R, Gui D, Zheng L, et al. Mechanistic insight and management of diabetic nephropathy: recent progress and future perspective. J Diabetes Res. 2017;2017:1–7. doi:10.1155/2017/1839809
7. Han SS, Park JY, Kang S, et al. Dialysis modality and mortality in the elderly: a meta-analysis. Clin J Am Soc Nephrol. 2015;10(6):983–993. doi:10.2215/CJN.05160514
8. Zhang L, Long J, Jiang W, et al. Trends in chronic kidney disease in China. N Engl J Med. 2016;375(9):905–906. doi:10.1056/NEJMc1602469
9. Zhang L, Wang F, Wang L, et al. Prevalence of chronic kidney disease in China: a cross-sectional survey. Lancet. 2012;379(9818):815–822. doi:10.1016/S0140-6736(12)60033-6
10. Kong J, Wang T, Shen S, et al. A nomogram predicting the prognosis of young adult patients diagnosed with hepatocellular carcinoma: a population-based analysis. PLoS One. 2019;14(7):e219654. doi:10.1371/journal.pone.0219654
11. Mao L, Zhang X, Hu Y, et al. Nomogram based on cytokines for cardiovascular diseases in Xinjiang Kazakhs. Mediators Inflamm. 2019;2019:1–8.
12. Shimin J, Yining W, Zheng Z, et al. Accuracy of hematuria for predicting non-diabetic renal disease in patients with diabetes and kidney disease: a systematic review and meta-analysis. Diabetes Res Clin Pract. 2018;143:288–300.
13. Jalalonmuhali M, Lim SK, Md Shah MN, et al. MDRD vs. CKD-EPI in comparison to 51Chromium EDTA: a cross sectional study of Malaysian CKD cohort. BMC Nephrol. 2017;18(1). doi:10.1186/s12882-017-0776-2
14. Porrini E, Ruggenenti P, Luis-Lima S, et al. Estimated GFR: time for a critical appraisal. Nat Rev Nephrol. 2019;15(3):177–190. doi:10.1038/s41581-018-0080-9
15. Mao L, Zhang X, Hu Y, et al. Nomogram based on cytokines for cardiovascular diseases in Xinjiang Kazakhs. Mediators Inflamm. 2019;2019:4756295–4756298. doi:10.1155/2019/4756295
16. Mogensen CE. Microalbuminuria predicts clinical proteinuria and early mortality in maturity-onset diabetes. N Engl J Med. 1984;310(6):356–360. doi:10.1056/NEJM198402093100605
17. Chen Y, Liu P, Chen X, et al. Effects of different doses of irbesartan combined with spironolactone on urinary albumin excretion rate in elderly patients with early type 2 diabetic nephropathy. Am J Med Sci. 2018;355(5):418–424. doi:10.1016/j.amjms.2018.01.017
18. Ma J, Xu L, Dong J, et al. Effects of zishentongluo in patients with early-stage diabetic nephropathy. Am J Chin Med. 2013;41(2):333. doi:10.1142/S0192415X13500249
19. Steyerberg E, Vergouwe Y. Towards better clinical prediction models: seven steps for development and an ABCD for validation. Eur Heart J. 2014;35(29):1925–1931. doi:10.1093/eurheartj/ehu207
20. Lätti S, Niinivehmas S, Pentikäinen OT. Rocker: open source, easy-to-use tool for AUC and enrichment calculations and ROC visualization. J Cheminform. 2016;8(1):45. doi:10.1186/s13321-016-0158-y
21. Van Calster B, Wynants L, Verbeek JFM, et al. Reporting and interpreting decision curve analysis: a guide for investigators. Eur Urol. 2018;74(6):796–804. doi:10.1016/j.eururo.2018.08.038
22. Zimbudzi E, Lo C, Ranasinha S, et al. Predictors of health-related quality of life in patients with co-morbid diabetes and chronic kidney disease. PLoS One. 2016;11(12):e168491. doi:10.1371/journal.pone.0168491
23. Pommer W. Prevalence of nephropathy in the German diabetes population–is early referral to nephrological care a realistic demand today? Clin Kidney J. 2008;1(suppl 4):v2–v5. doi:10.1093/ndtplus/sfn115
24. Pradeepa R, Rema M, Vignesh J, et al. Prevalence and risk factors for diabetic neuropathy in an urban south Indian population: the Chennai Urban Rural Epidemiology Study (CURES-55). Diabetic Med. 2008;25(4):407–412. doi:10.1111/j.1464-5491.2008.02397.x
25. Ahn JH, Yu JH, Ko S, et al. Prevalence and determinants of diabetic nephropathy in Korea: Korea national health and nutrition examination survey. Diabetes Metab J. 2014;38(2):109.
26. Alwakeel JS, Al-Suwaida A, Isnani AC, et al. Concomitant macro and microvascular complications in diabetic nephropathy. Saudi J Kidney Dis Transpl. 2009;20(3):402–409.
27. Zhang X, Kong J, Yun K. Prevalence of diabetic nephropathy among patients with type 2 diabetes mellitus in China: a meta-analysis of observational studies. J Diabetes Res. 2020;2020:1–11.
28. Maric-Bilkan C. Sex differences in micro- and macro-vascular complications of diabetes mellitus. Clin Sci. 2017;131(9):833–846. doi:10.1042/CS20160998
29. Shi R, Niu Z, Wu B, et al. Nomogram for the risk of diabetic nephropathy or diabetic retinopathy among patients with type 2 diabetes mellitus based on questionnaire and biochemical indicators: a cross-sectional study. Diabetes Metab Syndr Obes. 2020;13:1215.
30. Hu Y, Shi R, Mo R, et al. Nomogram for the prediction of diabetic nephropathy risk among patients with type 2 diabetes mellitus based on a questionnaire and biochemical indicators: a retrospective study. Aging. 2020;12(11):10317–10336. doi:10.18632/aging.103259
31. Xi C, Wang C, Rong G, et al. A nomogram model that predicts the risk of diabetic nephropathy in type 2 diabetes mellitus patients: a retrospective study. Int J Endocrinol. 2021;2021:6672444. doi:10.1155/2021/6672444
32. Cheema S, Maisonneuve P, Zirie M, et al. Risk factors for microvascular complications of diabetes in a high-risk middle east population. J Diabetes Res. 2018;2018:1–7. doi:10.1155/2018/8964027
33. Miao DD, Pan EC, Zhang Q, et al. Development and validation of a model for predicting diabetic nephropathy in Chinese people. Biomed Environ Sci. 2017;30(2):106–112. doi:10.3967/bes2017.014
34. Arauz-Pacheco C, Parrott MA, Raskin P. The treatment of hypertension in adult patients with diabetes. Diabetes Care. 2002;25(1):134–147. doi:10.2337/diacare.25.1.134
35. Hill NR, Fatoba ST, Oke JL, et al. Global prevalence of chronic kidney disease – a systematic review and meta-analysis. PLoS One. 2016;11(7):e158765. doi:10.1371/journal.pone.0158765
36. Verma A. Diabetic kidney disease and hypertension: a true love story. J Clin Diagnostic Res. 2016. doi:10.7860/JCDR/2016/18806.7511
37. Khanam PA, Hoque S, Begum T, et al. Microvascular complications and their associated risk factors in type 2 diabetes mellitus. Diabetes Metab Syndr. 2017;11:S577–S581. doi:10.1016/j.dsx.2017.04.007
38. Jiang W, Wang J, Shen X, et al. Establishment and validation of a risk prediction model for early diabetic kidney disease based on a systematic review and meta-analysis of 20 cohorts. Diabetes Care. 2020;43(4):925–933. doi:10.2337/dc19-1897
39. Friedman AN, Chambers M, Kamendulis LM, et al. Short-term changes after a weight reduction intervention in advanced diabetic nephropathy. Clin J Am Soc Nephrol. 2013;8(11):1892–1898. doi:10.2215/CJN.04010413
40. Madero M, Katz R, Murphy R, et al. Comparison between different measures of body fat with kidney function decline and incident CKD. Clin J Am Soc Nephrol. 2017;12(6):893–903. doi:10.2215/CJN.07010716
41. International Expert Committee. International expert committee report on the role of the A1C assay in the diagnosis of diabetes. Diabetes Care. 2009;32(7):1327–1334. doi:10.2337/dc09-9033
42. Zhang X, Gregg EW, Williamson DF, et al. A1C level and future risk of diabetes: a systematic review. Diabetes Care. 2010;33(7):1665–1673. doi:10.2337/dc09-1939
43. Selvin E, Ning Y, Steffes MW, et al. Glycated hemoglobin and the risk of kidney disease and retinopathy in adults with and without diabetes. Diabetes. 2011;60(1):298–305. doi:10.2337/db10-1198
44. Franko B, Brault J, Jouve T, et al. Differential impact of glucose levels and advanced glycation end-products on tubular cell viability and pro-inflammatory/profibrotic functions. Biochem Biophys Res Commun. 2014;451(4):627–631. doi:10.1016/j.bbrc.2014.08.042
45. Elmhiri G, Mahmood DFD, Niquet-Leridon C, et al. Formula-derived advanced glycation end products are involved in the development of long-term inflammation and oxidative stress in kidney of IUGR piglets. Mol Nutr Food Res. 2015;59(5):939–947. doi:10.1002/mnfr.201400722
46. Atkin SL, Butler AE, Hunt SC, et al. The retinopathy-derived HbA1c threshold of 6.5% for type 2 diabetes also captures the risk of diabetic nephropathy in NHANES. Diabetes Obes Metab. 2021;23(9):2109–2115. doi:10.1111/dom.14449
47. Gong L, Wang C, Ning G, et al. High concentrations of triglycerides are associated with diabetic kidney disease in new-onset type 2 diabetes in China: findings from the China cardiometabolic disease and cancer cohort (4C) study. Diabetes Obes Metab. 2021;23(11):2551–2560. doi:10.1111/dom.14502
48. Afshinnia F, Nair V, Lin J, et al. Increased lipogenesis and impaired β-oxidation predict type 2 diabetic kidney disease progression in American Indians. JCI Insight. 2019;4(21). doi:10.1172/jci.insight.130317
49. Faselis C, Katsimardou A, Imprialos K, et al. Microvascular complications of type 2 diabetes mellitus. Curr Vasc Pharmacol. 2020;18(2):117–124. doi:10.2174/1570161117666190502103733
50. Marsida T, Giulia C, Lucia S, et al. Risk factors for the development of micro-vascular complications of type 2 diabetes in a single-centre cohort of patients. Diabetes Vasc Dis Res. 2018;15(5):424–432.
51. Xu L, Lin X, Guan M, et al. Correlation between different stages of diabetic nephropathy and neuropathy in patients with T2DM: a cross-sectional controlled study. Diabetes Ther. 2018;9(6):2335–2346. doi:10.1007/s13300-018-0519-9
52. Yang J, Jiang S. Development and Validation of a Model that Predicts the Risk of Diabetic Retinopathy in Type 2 Diabetes Mellitus Patients. Diabetes Metab Syndr Obes. In press 2022
 © 2022 The Author(s). This work is published and licensed by Dove Medical Press Limited. The full terms of this license are available at https://www.dovepress.com/terms.php and incorporate the Creative Commons Attribution - Non Commercial (unported, v3.0) License.
By accessing the work you hereby accept the Terms. Non-commercial uses of the work are permitted without any further permission from Dove Medical Press Limited, provided the work is properly attributed. For permission for commercial use of this work, please see paragraphs 4.2 and 5 of our Terms.
© 2022 The Author(s). This work is published and licensed by Dove Medical Press Limited. The full terms of this license are available at https://www.dovepress.com/terms.php and incorporate the Creative Commons Attribution - Non Commercial (unported, v3.0) License.
By accessing the work you hereby accept the Terms. Non-commercial uses of the work are permitted without any further permission from Dove Medical Press Limited, provided the work is properly attributed. For permission for commercial use of this work, please see paragraphs 4.2 and 5 of our Terms.